Race &Recovery
Jobless Rates From 15 U.S. Cities Show Racial Gap Is Widening
Bloomberg is tracking the economic recovery in minority communities across the country
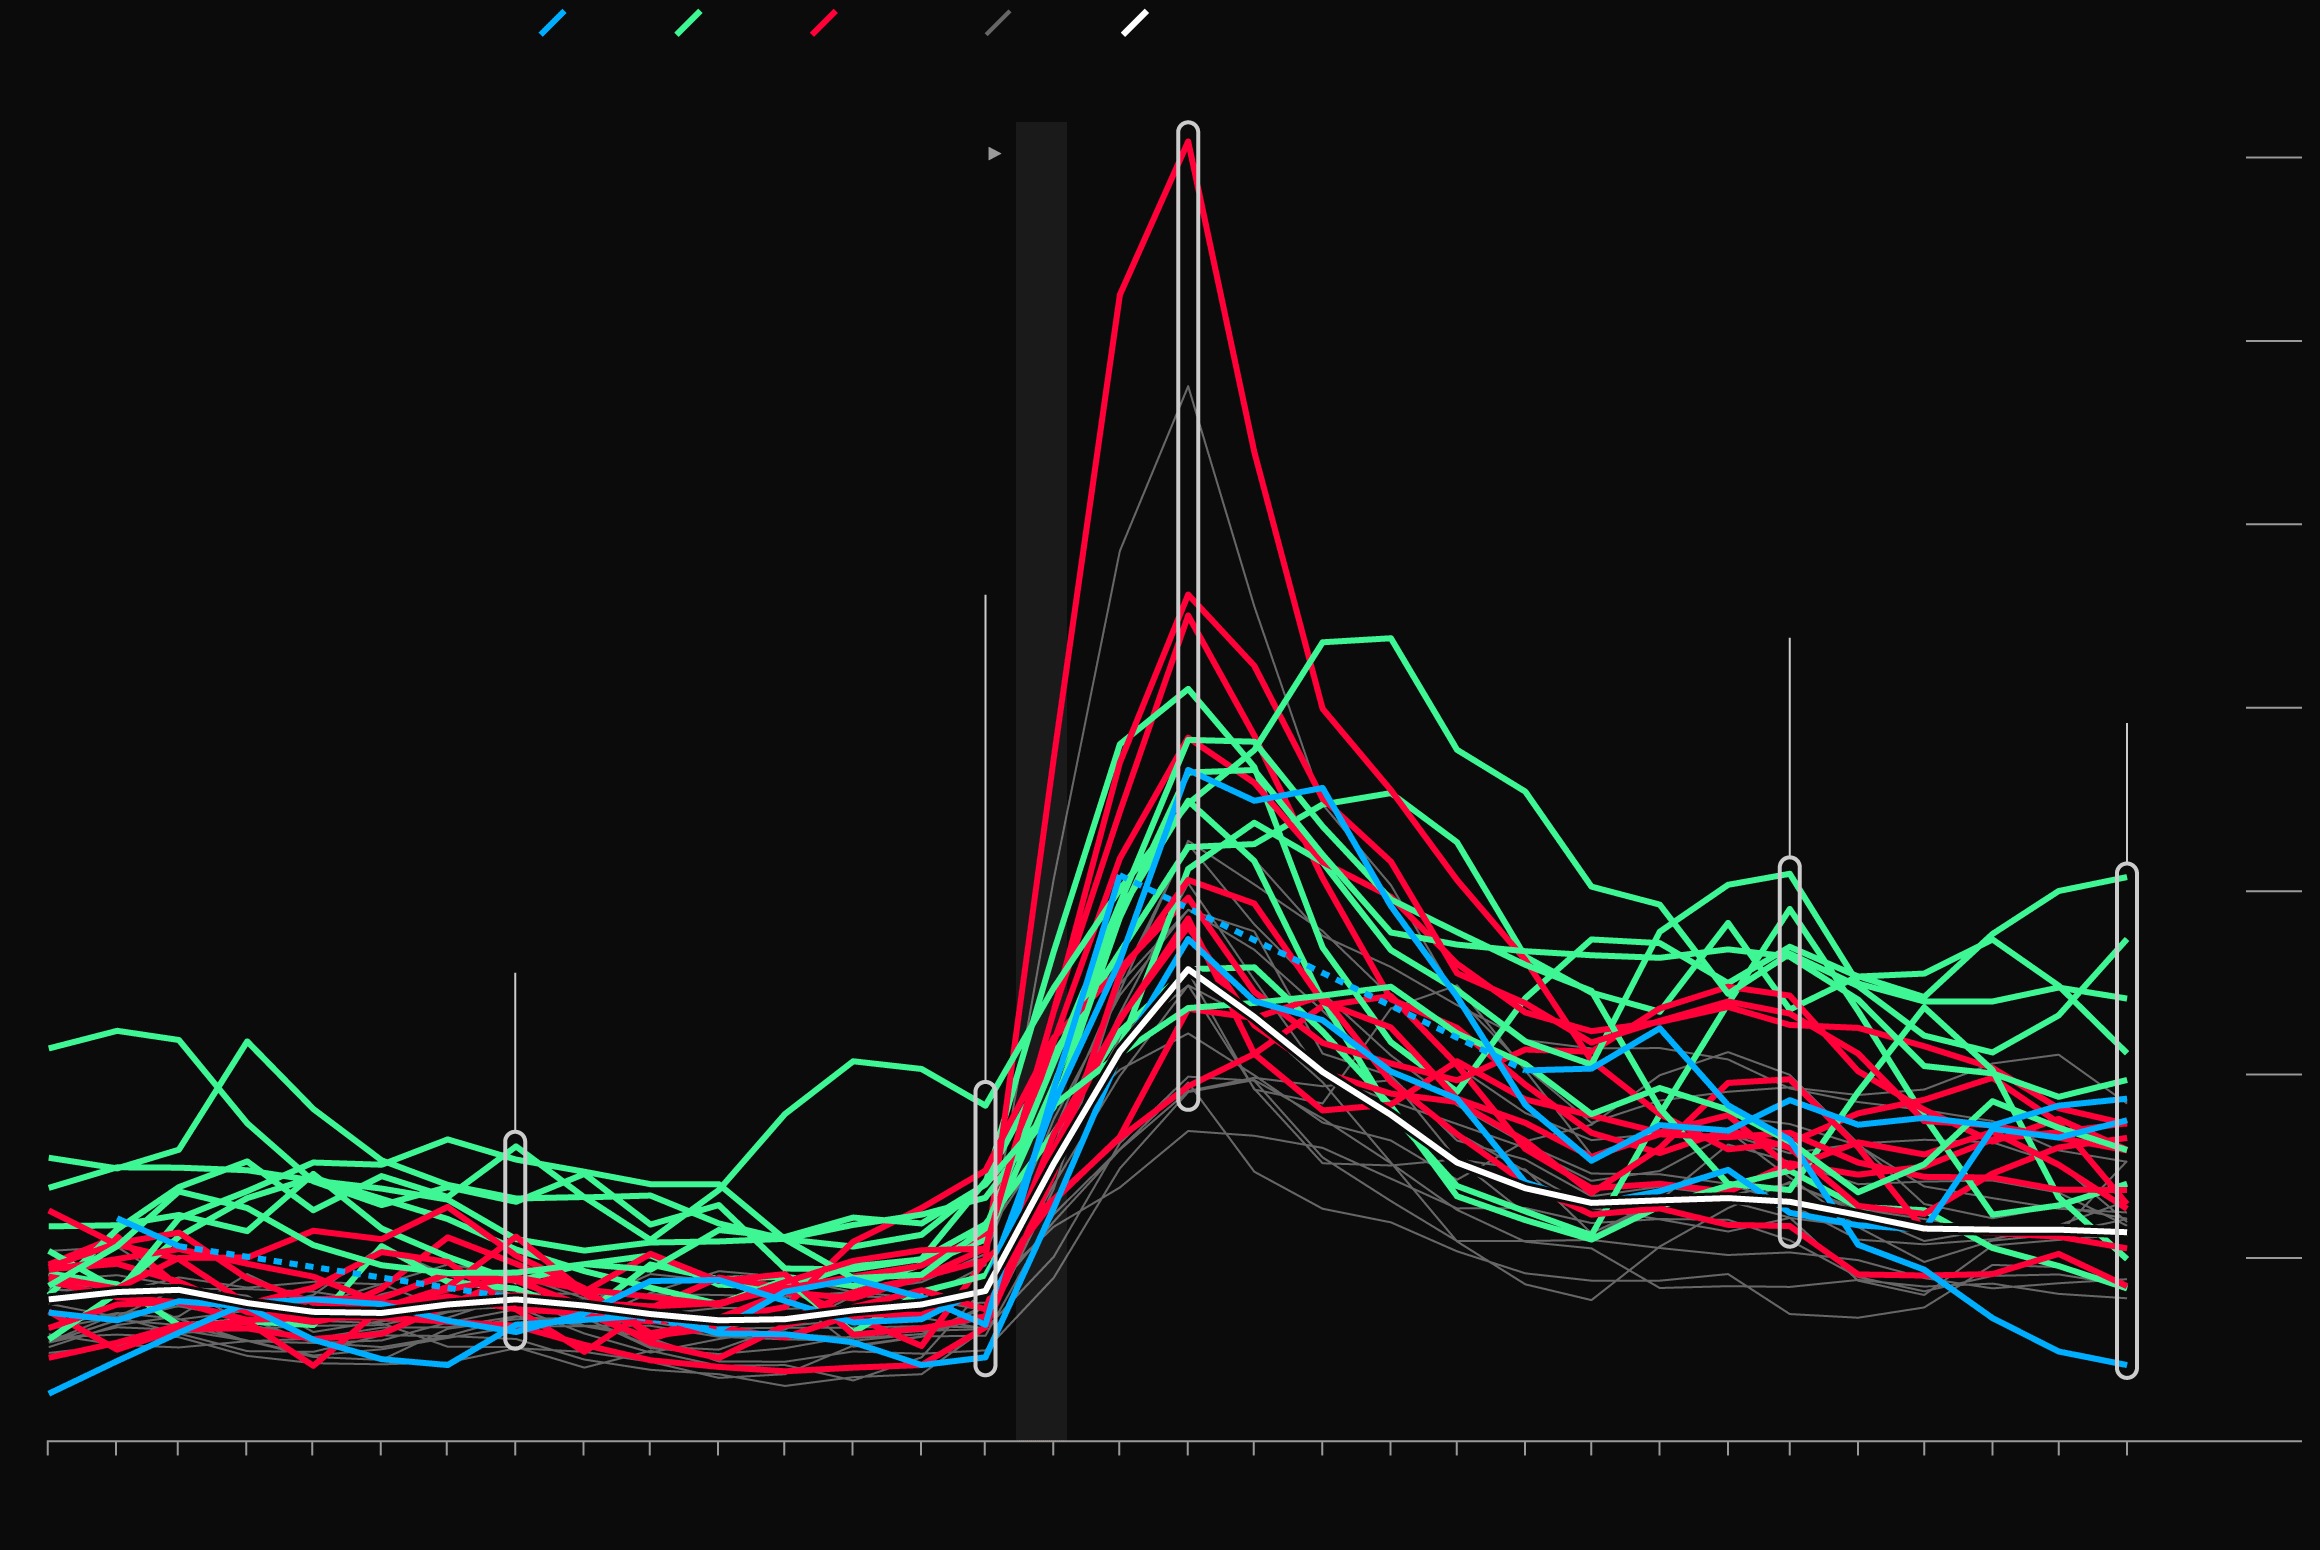
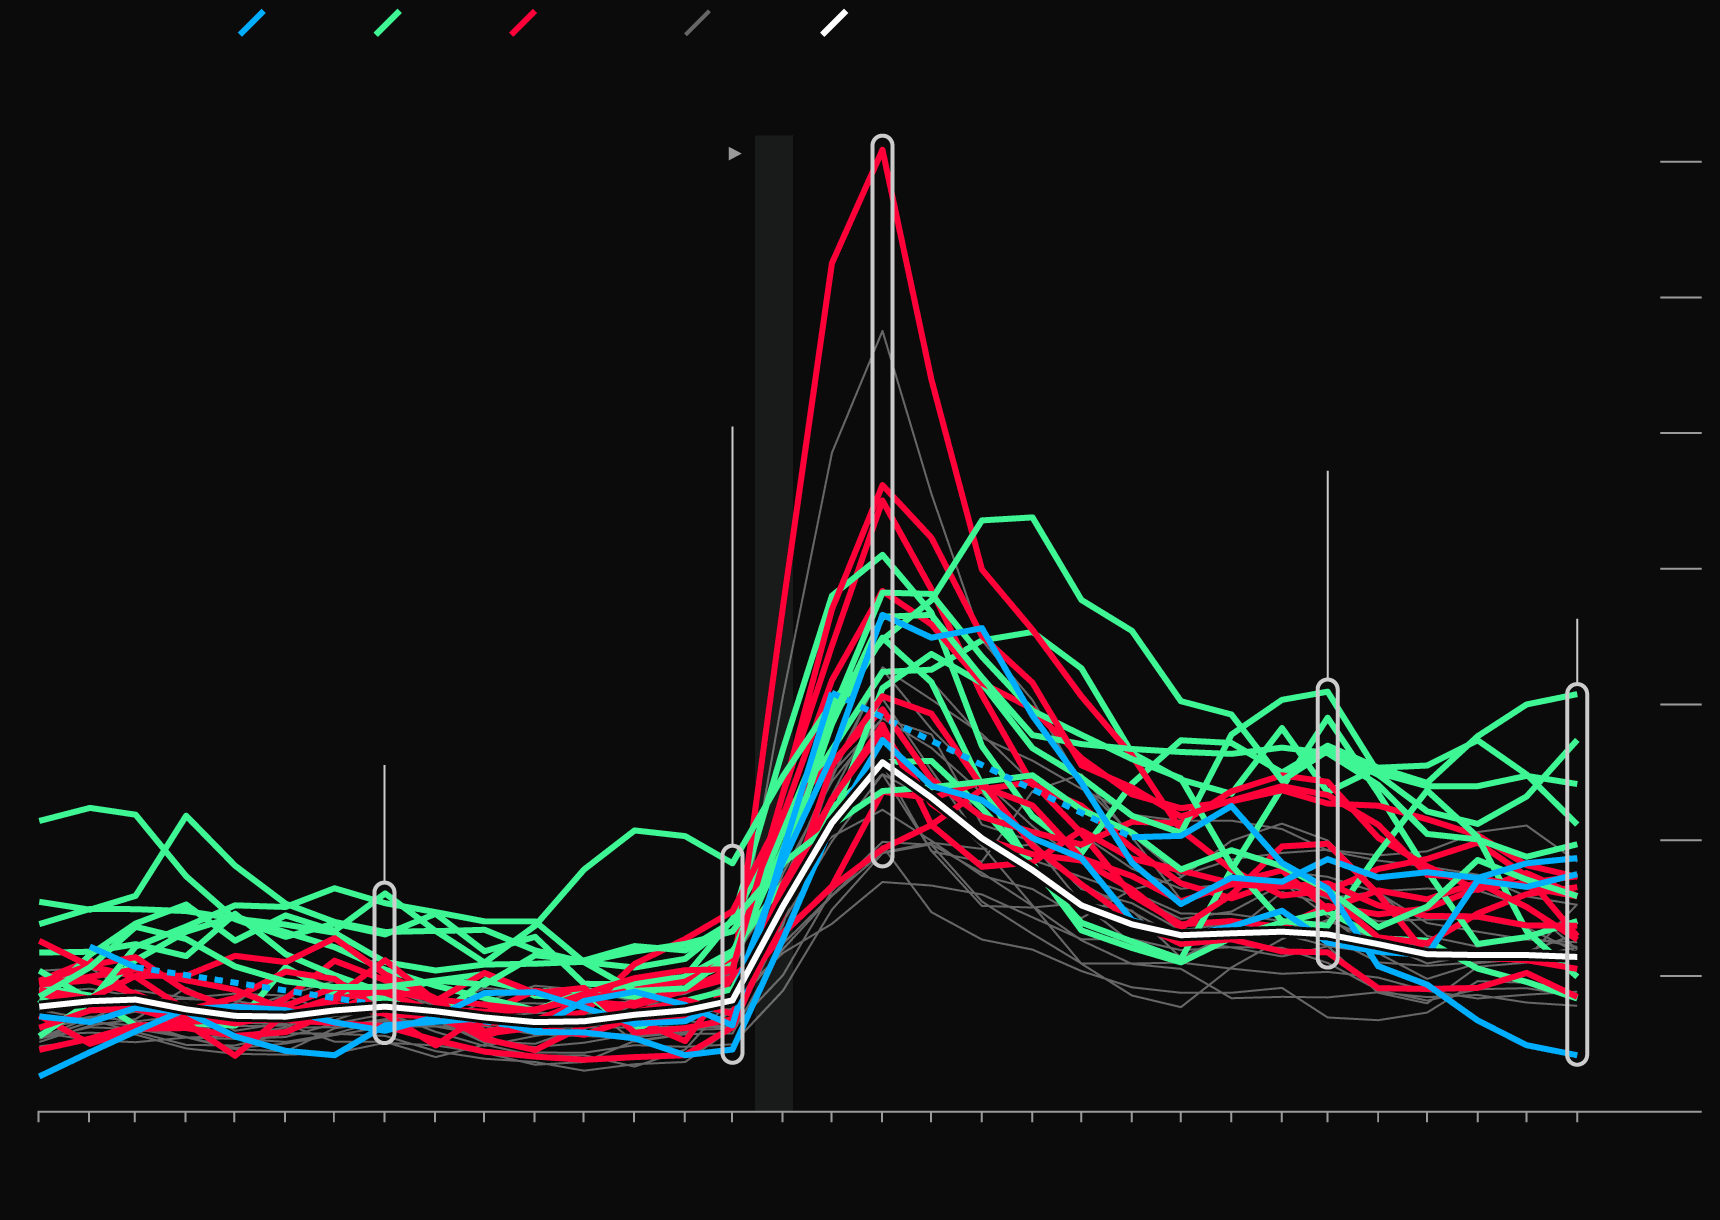
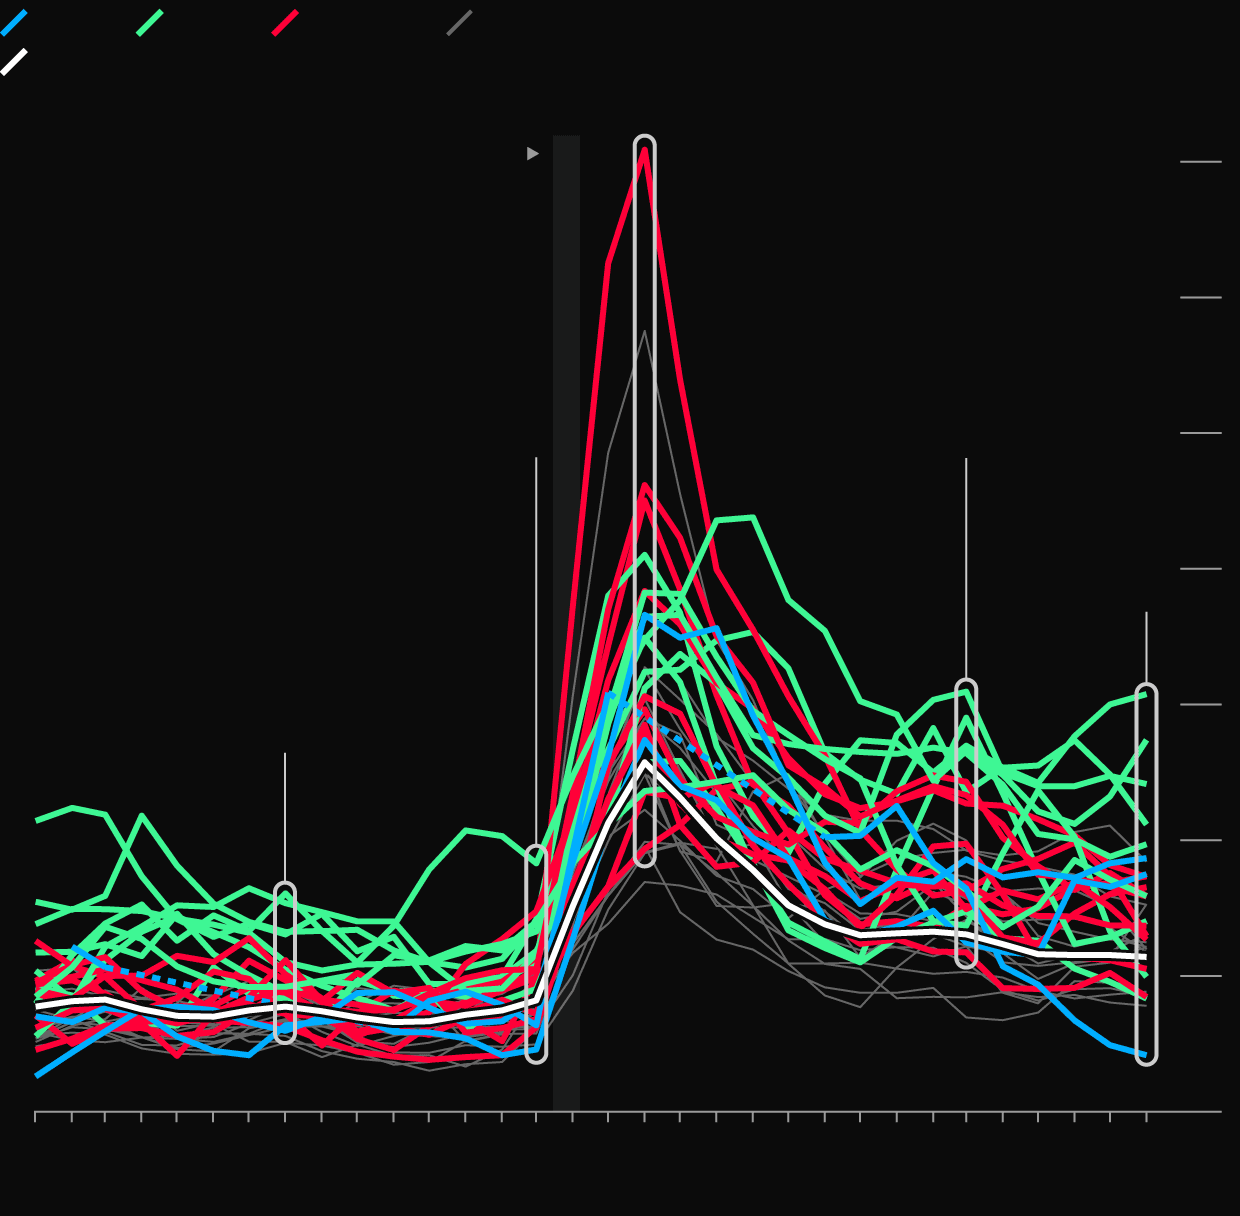
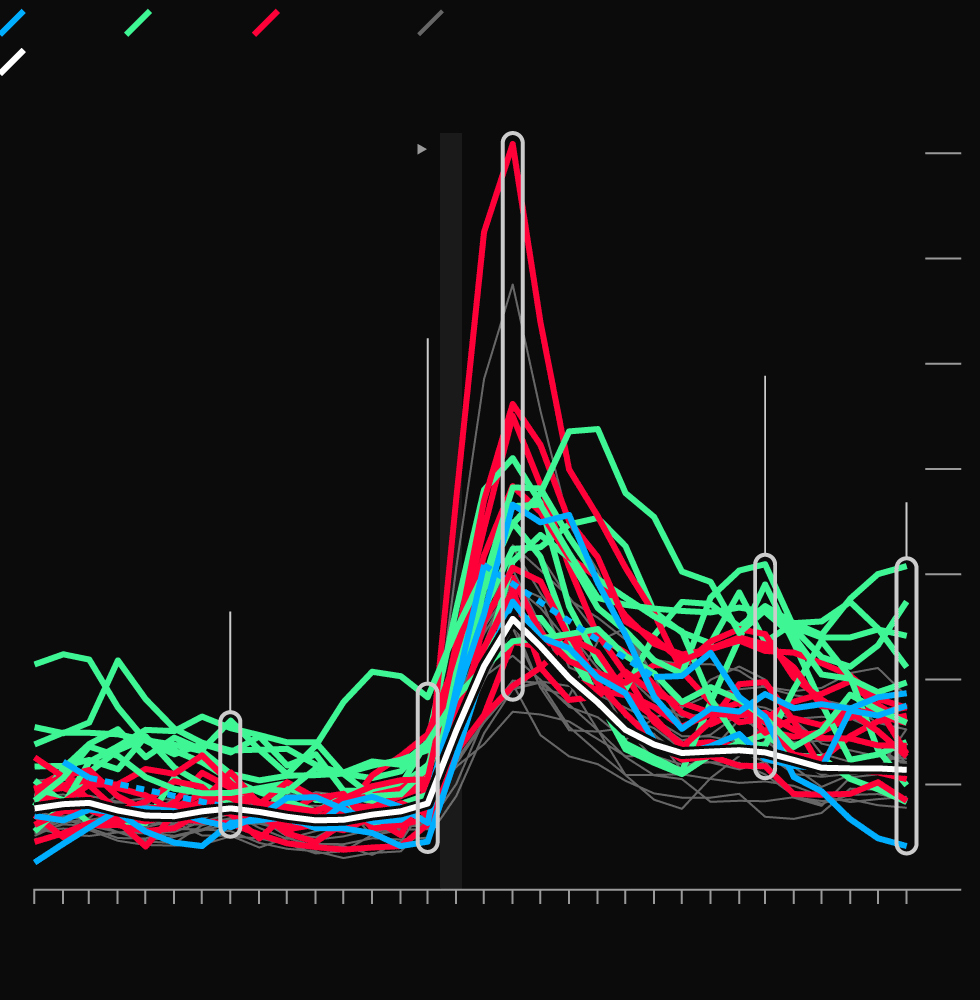
As vaccine eligibility expanded in March, optimism about the U.S. economy reigned. Five months later, local unemployment rates by race and ethnicity for 15 major U.S. metro areas show a slow recovery and still painful economic reality for minority groups.
The data paint a picture of an economy falling short of the Federal Reserve’s “broad and inclusive” maximum employment mandate even as Fed officials meet this week to assess progress and deliberate a pullback in support for the economy.
The pandemic “fell hardest on the populations that were already a little or a lot behind, those that were the least able to bear it,” said San Francisco Federal Reserve Bank President Mary Daly on Sept. 8.
Black and Hispanic communities are seeing a weaker recovery in general than White people, a Bloomberg News analysis of the data found. Additionally, the gap between the top and bottom minority unemployment rates in these same metro areas has widened since March, one year after the first Covid-19 lockdowns.
To be sure, federal programs and aid initiated early in the pandemic helped buoy businesses and kept millions of people out of poverty. Still, many of those stimulus measures have now come to an end.
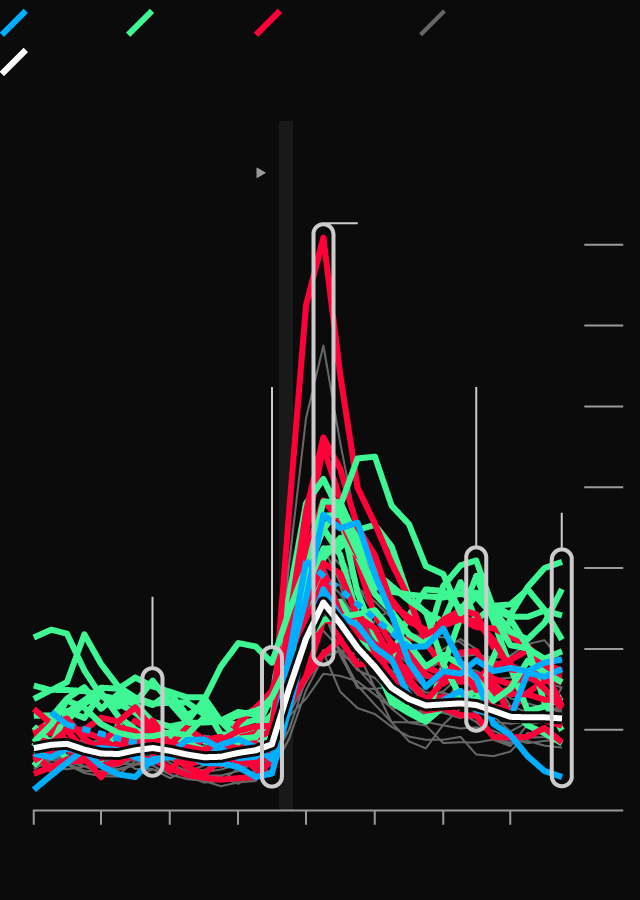
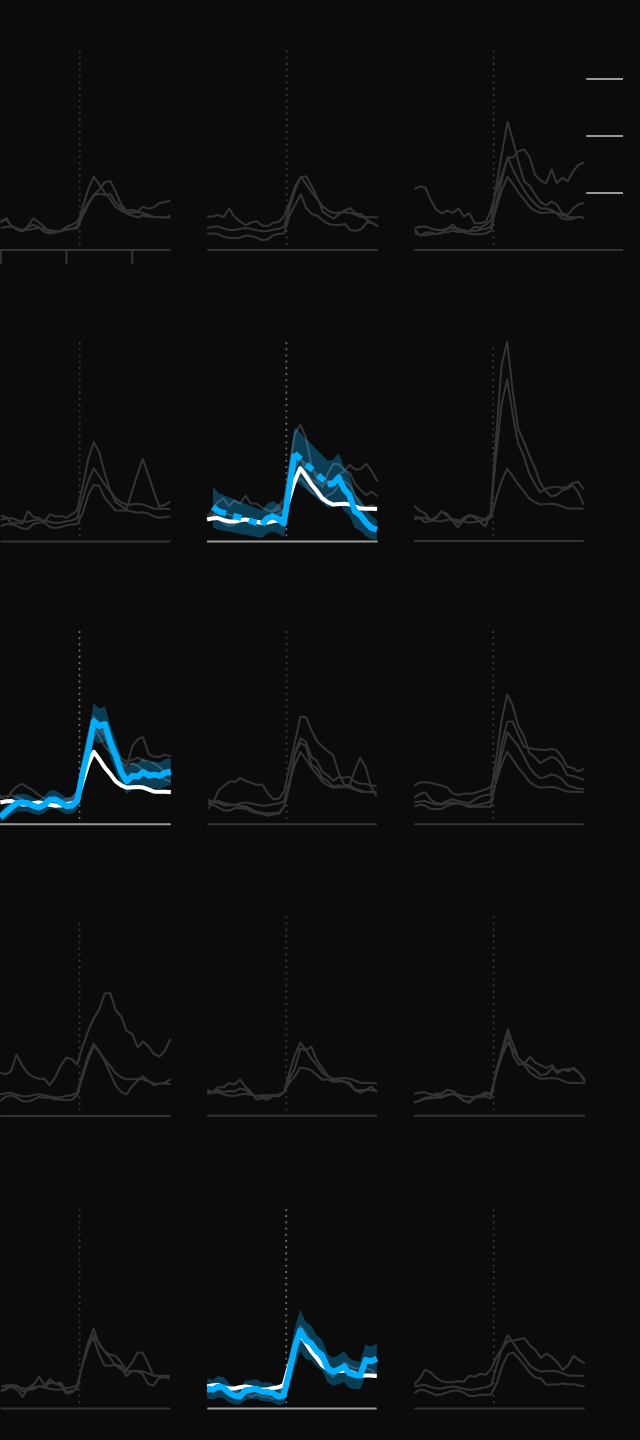
A Recovery Takes Shape
Asian
Black
Hispanic
White
Overall national unemployment
Unemployment rate, NSA
(3-month trailing average)
25.8 p.p.
Unemployment peak
35%
Stay-at-home orders first imposed
30
8.9 p.p.
Pandemic start
10.2 p.p.
Vaccine drive
ramps up
25
13.3 p.p.
Latest
20
5.1 p.p.
Range of minority rates
Pre-pandemic
15
10
5
0
Jan
2019
Apr
Jul
Oct
Jan
2020
Apr
Jul
Oct
Jan
2021
Apr
Jul
Asian
Black
Hispanic
White
Overall national unemployment
Unemployment rate, NSA
(3-month trailing average)
25.8 p.p.
Unemployment peak
35%
Stay-at-home orders first imposed
30
8.9 p.p.
Pandemic start
10.2 p.p.
Vaccines drive
ramps up
25
13.3 p.p.
Latest
20
5.1 p.p.
Range of minority rates
Pre-pandemic
15
10
5
0
Jan
2019
Apr
Jul
Oct
Jan
2020
Apr
Jul
Oct
Jan
2021
Apr
Jul
Asian
Black
Hispanic
White
Unemployment rate, NSA
(3-month trailing average)
Overall national unemployment
35%
25.8 p.p.
Unemployment peak
Stay-at-home
orders first
imposed
30
8.9 p.p.
Pandemic
start
10.2 p.p.
Vaccines drive
ramps up
25
13.3 p.p.
Latest
20
5.1 p.p.
Range of minority rates
Pre-pandemic
15
10
5
0
Jan
2019
Apr
Jul
Oct
Jan
2020
Apr
Jul
Oct
Jan
2021
Apr
Jul
Asian
Black
Hispanic
White
Unemployment rate, NSA
(3-month trailing average)
Overall national unemployment
25.8 p.p.
Unemployment peak
35%
Stay-at-home orders first imposed
30
8.9 p.p.
Pandemic start
10.2 p.p.
Vaccines drive
ramps up
25
13.3 p.p.
Latest
20
5.1 p.p.
Range of minority rates
Pre-pandemic
15
10
5
0
Jan
2019
Apr
Jul
Oct
Jan
2020
Apr
Jul
Oct
Jan
2021
Apr
Jul
Asian
Black
Hispanic
White
Overall national unemployment
Unemployment rate, NSA
(3-month trailing average)
Stay-at-home
orders first
imposed
25.8
35%
30
8.9
10.2
25
20
5.1 p.p.
Range of
minority rates
13.3
15
10
5
0
Jan
2019
May
Sep
Jan
2020
May
Sep
Jan
2021
May

Unemployment gaps that fell significantly
Los Angeles Black-White
5.85 p.p.
4.45 p.p.
March
2021
August
2021
New York Hispanic-White
3.01 p.p.
1.69 p.p.
Atlanta Black-White
3.90 p.p.
0.02 p.p.

Unemployment gaps that fell significantly
Los Angeles Black-White
5.85 p.p.
4.45 p.p.
March
2021
August
2021
New York Hispanic-White
3.01 p.p.
1.69 p.p.
Atlanta Black-White
3.90 p.p.
0.02 p.p.
Bloomberg calculated local unemployment rates, as well as margins of error, using the monthly Current Population Survey of about 60,000 households, which is sponsored jointly by the Bureau of Labor Statistics and the U.S. Census Bureau.
For the three months through August, about half of local minority groups tracked faced unemployment levels significantly higher than the same period two years ago, when taking margins of error into consideration. The gap between Black unemployment and White unemployment rates has widened considerably since March in Chicago.
In a few cases, the local gap between White and minority unemployment rates has shrunk since March when more adults became eligible to receive their first vaccine dose and economies began reopening.
Only five groups—Black people in Atlanta and Miami, Hispanic people in Phoenix and San Antonio, plus White Phoenix residents—have seen their unemployment rates fall to the levels seen in mid-2019 or below.
Albuquerque
Atlanta
Chicago
Dallas
Houston
30%
20
10
0
2021
2019
2020
Las Vegas
Los Angeles
Miami
New York
Philadelphia
Phoenix
Riverside, CA
San Antonio
San Francisco
Washington, D.C.
Albuquerque
Atlanta
Chicago
Dallas
Houston
30%
20
10
0
2021
2019
2020
Las Vegas
Los Angeles
Miami
New York
Philadelphia
Phoenix
Riverside, CA
San Antonio
San Francisco
Washington, D.C.
Albuquerque
Atlanta
Chicago
Dallas
Houston
30%
20
10
0
’21
’19
’20
Las Vegas
Los Angeles
Miami
New York
Philadelphia
Phoenix
Riverside, CA
San Antonio
San Francisco
Washington, D.C.
Albuquerque
Atlanta
Chicago
Dallas
30%
20
10
0
’21
’19
’20
Houston
Las Vegas
Los Angeles
Miami
New York
Philadelphia
Phoenix
Riverside, CA
San Antonio
San
Francisco
Washington,
D.C.
Albuquerque
Atlanta
Chicago
30%
20
10
0
’19
’20
’21
Dallas
Houston
Las Vegas
Los Angeles
Miami
New York
Philadelphia
Phoenix
Riverside, CA
San Antonio
San
Francisco
Washington,
D.C.
Albuquerque
Atlanta
Chicago
Dallas
Houston
30%
20
10
0
2021
2019
2020
Las Vegas
Los Angeles
Miami
New York
Philadelphia
Phoenix
Riverside, CA
San Antonio
San Francisco
Washington, D.C.
Albuquerque
Atlanta
Chicago
Dallas
Houston
30%
20
10
0
2021
2019
2020
Las Vegas
Los Angeles
Miami
New York
Philadelphia
Phoenix
Riverside, CA
San Antonio
San Francisco
Washington, D.C.
Atlanta
Chicago
Dallas
Houston
Albuquerque
30%
20
10
0
’21
’19
’20
Las Vegas
Los Angeles
Miami
New York
Philadelphia
Phoenix
Riverside, CA
San Antonio
San Francisco
Washington, D.C.
Albuquerque
Atlanta
Chicago
Dallas
30%
20
10
0
’21
’19
’20
Houston
Las Vegas
Los Angeles
Miami
New York
Philadelphia
Phoenix
Riverside, CA
San Antonio
San
Francisco
Washington,
D.C.
Albuquerque
Atlanta
Chicago
30%
20
10
0
’19
’20
’21
Dallas
Houston
Las Vegas
Los Angeles
Miami
New York
Philadelphia
Phoenix
Riverside, CA
San Antonio
San
Francisco
Washington,
D.C.
Albuquerque
Atlanta
Chicago
Dallas
Houston
30%
20
10
0
2021
2019
2020
Las Vegas
Los Angeles
Miami
New York
Philadelphia
Phoenix
Riverside, CA
San Antonio
San Francisco
Washington, D.C.
Albuquerque
Atlanta
Chicago
Dallas
Houston
30%
20
10
0
2021
2019
2020
Las Vegas
Los Angeles
Miami
New York
Philadelphia
Phoenix
Riverside, CA
San Antonio
San Francisco
Washington, D.C.
Atlanta
Chicago
Dallas
Houston
Albuquerque
30%
20
10
0
’21
’19
’20
Las Vegas
Los Angeles
Miami
New York
Philadelphia
Phoenix
Riverside, CA
San Antonio
San Francisco
Washington, D.C.
Albuquerque
Atlanta
Chicago
Dallas
30%
20
10
0
’21
’19
’20
Houston
Las Vegas
Los Angeles
Miami
New York
Philadelphia
Phoenix
Riverside, CA
San Antonio
San
Francisco
Washington,
D.C.
Albuquerque
Atlanta
Chicago
30%
20
10
0
’19
’20
’21
Dallas
Houston
Las Vegas
Los Angeles
Miami
New York
Philadelphia
Phoenix
Riverside, CA
San Antonio
San
Francisco
Washington,
D.C.
Albuquerque
Atlanta
Chicago
Dallas
Houston
30%
20
10
0
2021
2019
2020
Las Vegas
Los Angeles
Miami
New York
Philadelphia
Phoenix
Riverside, CA
San Antonio
San Francisco
Washington, D.C.
Albuquerque
Atlanta
Chicago
Dallas
Houston
30%
20
10
0
2021
2019
2020
Las Vegas
Los Angeles
Miami
New York
Philadelphia
Phoenix
Riverside, CA
San Antonio
San Francisco
Washington, D.C.
Atlanta
Chicago
Dallas
Houston
Albuquerque
30%
20
10
0
’21
’19
’20
Las Vegas
Los Angeles
Miami
New York
Philadelphia
Phoenix
Riverside, CA
San Antonio
San Francisco
Washington, D.C.
Albuquerque
Atlanta
Chicago
Dallas
30%
20
10
0
’21
’19
’20
Houston
Las Vegas
Los Angeles
Miami
New York
Philadelphia
Phoenix
Riverside, CA
San Antonio
San
Francisco
Washington,
D.C.
Albuquerque
Atlanta
Chicago
30%
20
10
0
’19
’20
’21
Dallas
Houston
Las Vegas
Los Angeles
Miami
New York
Philadelphia
Phoenix
Riverside, CA
San Antonio
San
Francisco
Washington,
D.C.
Albuquerque
Atlanta
Chicago
Dallas
Houston
30%
20
10
0
2021
2019
2020
Las Vegas
Los Angeles
Miami
New York
Philadelphia
Phoenix
Riverside, CA
San Antonio
San Francisco
Washington, D.C.
Albuquerque
Atlanta
Chicago
Dallas
Houston
30%
20
10
0
2021
2019
2020
Las Vegas
Los Angeles
Miami
New York
Philadelphia
Phoenix
Riverside, CA
San Antonio
San Francisco
Washington, D.C.

Atlanta
Chicago
Dallas
Houston
Albuquerque
30%
20
10
0
’21
’19
’20
Las Vegas
Los Angeles
Miami
New York
Philadelphia
Phoenix
Riverside, CA
San Antonio
San Francisco
Washington, D.C.
Albuquerque
Atlanta
Chicago
Dallas
30%
20
10
0
’21
’19
’20
Houston
Las Vegas
Los Angeles
Miami
New York
Philadelphia
Phoenix
Riverside, CA
San Antonio
San
Francisco
Washington,
D.C.
Albuquerque
Atlanta
Chicago
30%
20
10
0
’19
’20
’21
Dallas
Houston
Las Vegas
Los Angeles
Miami
New York
Philadelphia
Phoenix
Riverside, CA
San Antonio
San
Francisco
Washington,
D.C.
Albuquerque
Atlanta
Chicago
Dallas
Houston
30%
20
10
0
2021
2019
2020
Las Vegas
Los Angeles
Miami
New York
Philadelphia
Phoenix
Riverside, CA
San Antonio
San Francisco
Washington, D.C.
Albuquerque
Atlanta
Chicago
Dallas
Houston
30%
20
10
0
2021
2019
2020
Las Vegas
Los Angeles
Miami
New York
Philadelphia
Phoenix
Riverside, CA
San Antonio
San Francisco
Washington, D.C.
Atlanta
Chicago
Dallas
Houston
Albuquerque
30%
20
10
0
’21
’19
’20
Las Vegas
Los Angeles
Miami
New York
Philadelphia
Phoenix
Riverside, CA
San Antonio
San Francisco
Washington, D.C.
Albuquerque
Atlanta
Chicago
Dallas
30%
20
10
0
’21
’19
’20
Houston
Las Vegas
Los Angeles
Miami
New York
Philadelphia
Phoenix
Riverside, CA
San Antonio
San
Francisco
Washington,
D.C.
Albuquerque
Atlanta
Chicago
30%
20
10
0
’19
’20
’21
Dallas
Houston
Las Vegas
Los Angeles
Miami
New York
Philadelphia
Phoenix
Riverside, CA
San Antonio
San
Francisco
Washington,
D.C.
Albuquerque
Atlanta
Chicago
Dallas
Houston
30%
20
10
0
2021
2019
2020
Las Vegas
Los Angeles
Miami
New York
Philadelphia
Phoenix
Riverside, CA
San Antonio
San Francisco
Washington, D.C.
Albuquerque
Atlanta
Chicago
Dallas
Houston
30%
20
10
0
2021
2019
2020
Las Vegas
Los Angeles
Miami
New York
Philadelphia
Phoenix
Riverside, CA
San Antonio
San Francisco
Washington, D.C.
Atlanta
Chicago
Dallas
Houston
Albuquerque
30%
20
10
0
’21
’19
’20
Las Vegas
Los Angeles
Miami
New York
Philadelphia
Phoenix
Riverside, CA
San Antonio
San Francisco
Washington, D.C.
Albuquerque
Atlanta
Chicago
Dallas
30%
20
10
0
’21
’19
’20
Houston
Las Vegas
Los Angeles
Miami
New York
Philadelphia
Phoenix
Riverside, CA
San Antonio
San
Francisco
Washington,
D.C.
Albuquerque
Atlanta
Chicago
30%
20
10
0
’19
’20
’21
Dallas
Houston
Las Vegas
Los Angeles
Miami
New York
Philadelphia
Phoenix
Riverside, CA
San Antonio
San
Francisco
Washington,
D.C.
Albuquerque
Atlanta
Chicago
Dallas
Houston
30%
20
10
0
2021
2019
2020
Las Vegas
Los Angeles
Miami
New York
Philadelphia
Phoenix
Riverside, CA
San Antonio
San Francisco
Washington, D.C.
Albuquerque
Atlanta
Chicago
Dallas
Houston
30%
20
10
0
2021
2019
2020
Las Vegas
Los Angeles
Miami
New York
Philadelphia
Phoenix
Riverside, CA
San Antonio
San Francisco
Washington, D.C.
Atlanta
Chicago
Dallas
Houston
Albuquerque
30%
20
10
0
’21
’19
’20
Las Vegas
Los Angeles
Miami
New York
Philadelphia
Phoenix
Riverside, CA
San Antonio
San Francisco
Washington, D.C.
Albuquerque
Atlanta
Chicago
Dallas
30%
20
10
0
’21
’19
’20
Houston
Las Vegas
Los Angeles
Miami
New York
Philadelphia
Phoenix
Riverside, CA
San Antonio
San
Francisco
Washington,
D.C.
Albuquerque
Atlanta
Chicago
30%
20
10
0
’19
’20
’21
Dallas
Houston
Las Vegas
Los Angeles
Miami
New York
Philadelphia
Phoenix
Riverside, CA
San Antonio
San
Francisco
Washington,
D.C.
Albuquerque
Atlanta
Chicago
Dallas
Houston
30%
20
10
0
2021
2019
2020
Las Vegas
Los Angeles
Miami
New York
Philadelphia
Phoenix
Riverside, CA
San Antonio
San Francisco
Washington, D.C.
Albuquerque
Atlanta
Chicago
Dallas
Houston
30%
20
10
0
2021
2019
2020
Las Vegas
Los Angeles
Miami
New York
Philadelphia
Phoenix
Riverside, CA
San Antonio
San Francisco
Washington, D.C.
Atlanta
Chicago
Dallas
Houston
Albuquerque
30%
20
10
0
’21
’19
’20
Las Vegas
Los Angeles
Miami
New York
Philadelphia
Phoenix
Riverside, CA
San Antonio
San Francisco
Washington, D.C.
Albuquerque
Atlanta
Chicago
Dallas
30%
20
10
0
’21
’19
’20
Houston
Las Vegas
Los Angeles
Miami
New York
Philadelphia
Phoenix
Riverside, CA
San Antonio
San
Francisco
Washington,
D.C.
Albuquerque
Atlanta
Chicago
30%
20
10
0
’19
’20
’21
Dallas
Houston
Las Vegas
Los Angeles
Miami
New York
Philadelphia
Phoenix
Riverside, CA
San Antonio
San
Francisco
Washington,
D.C.
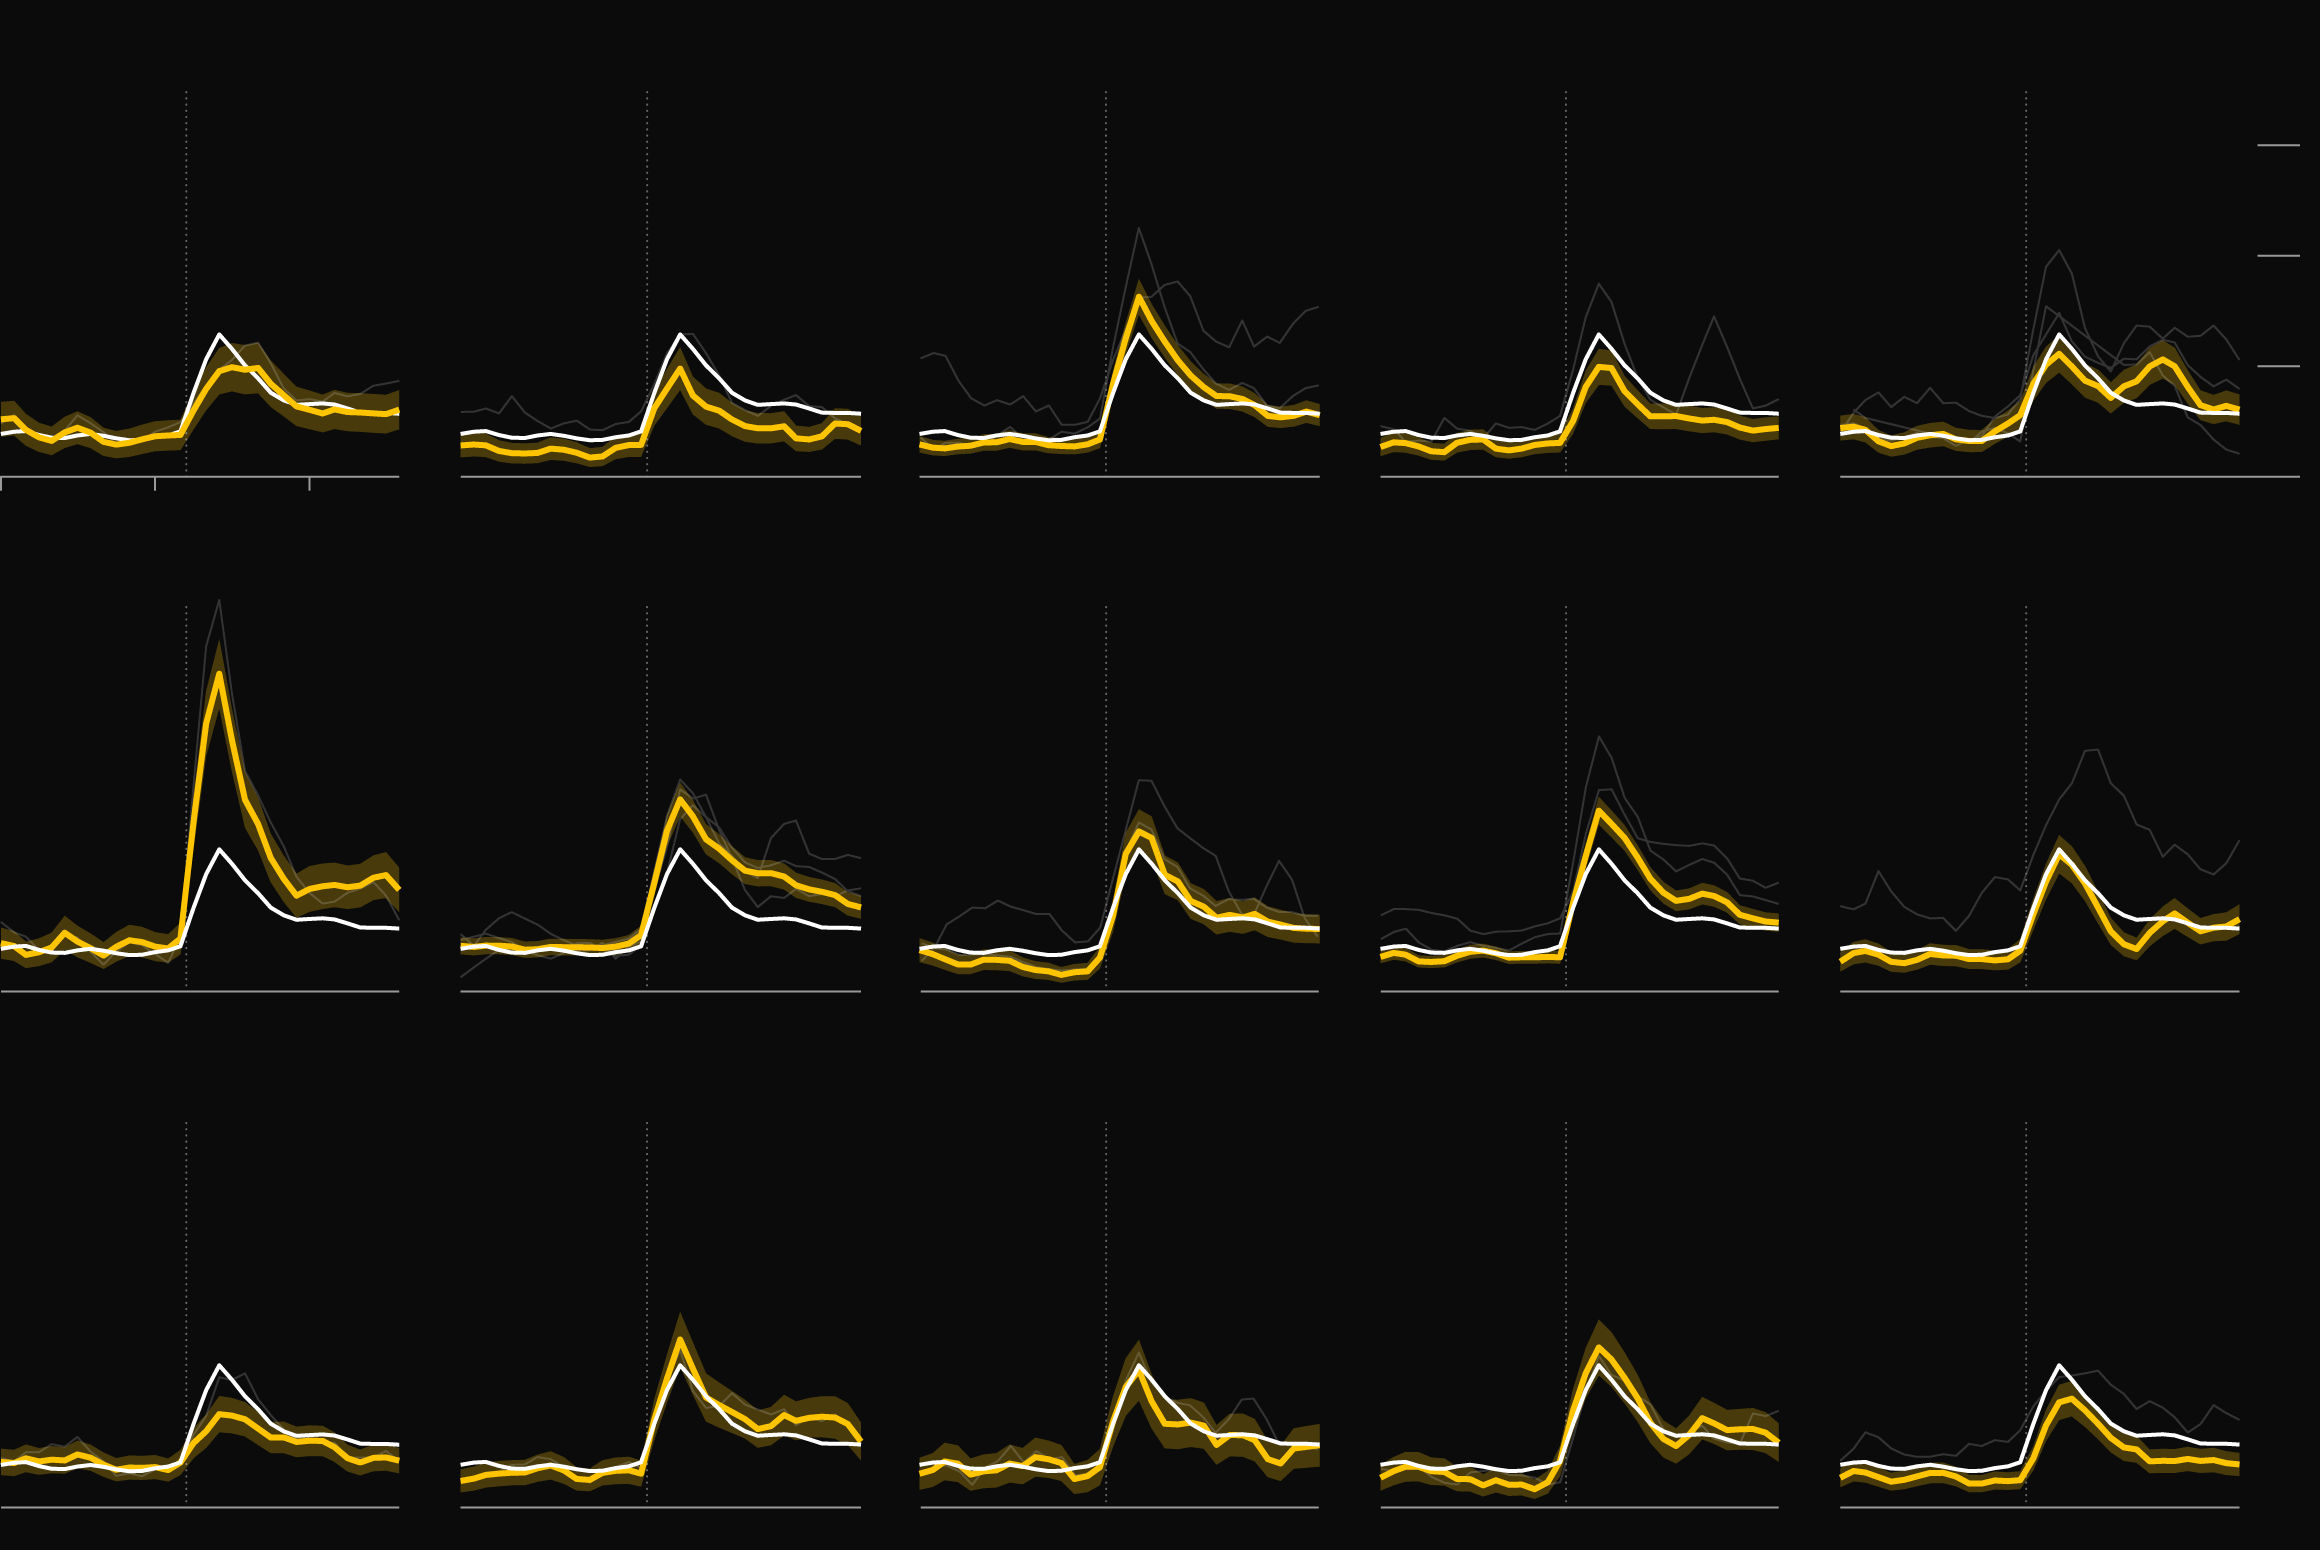
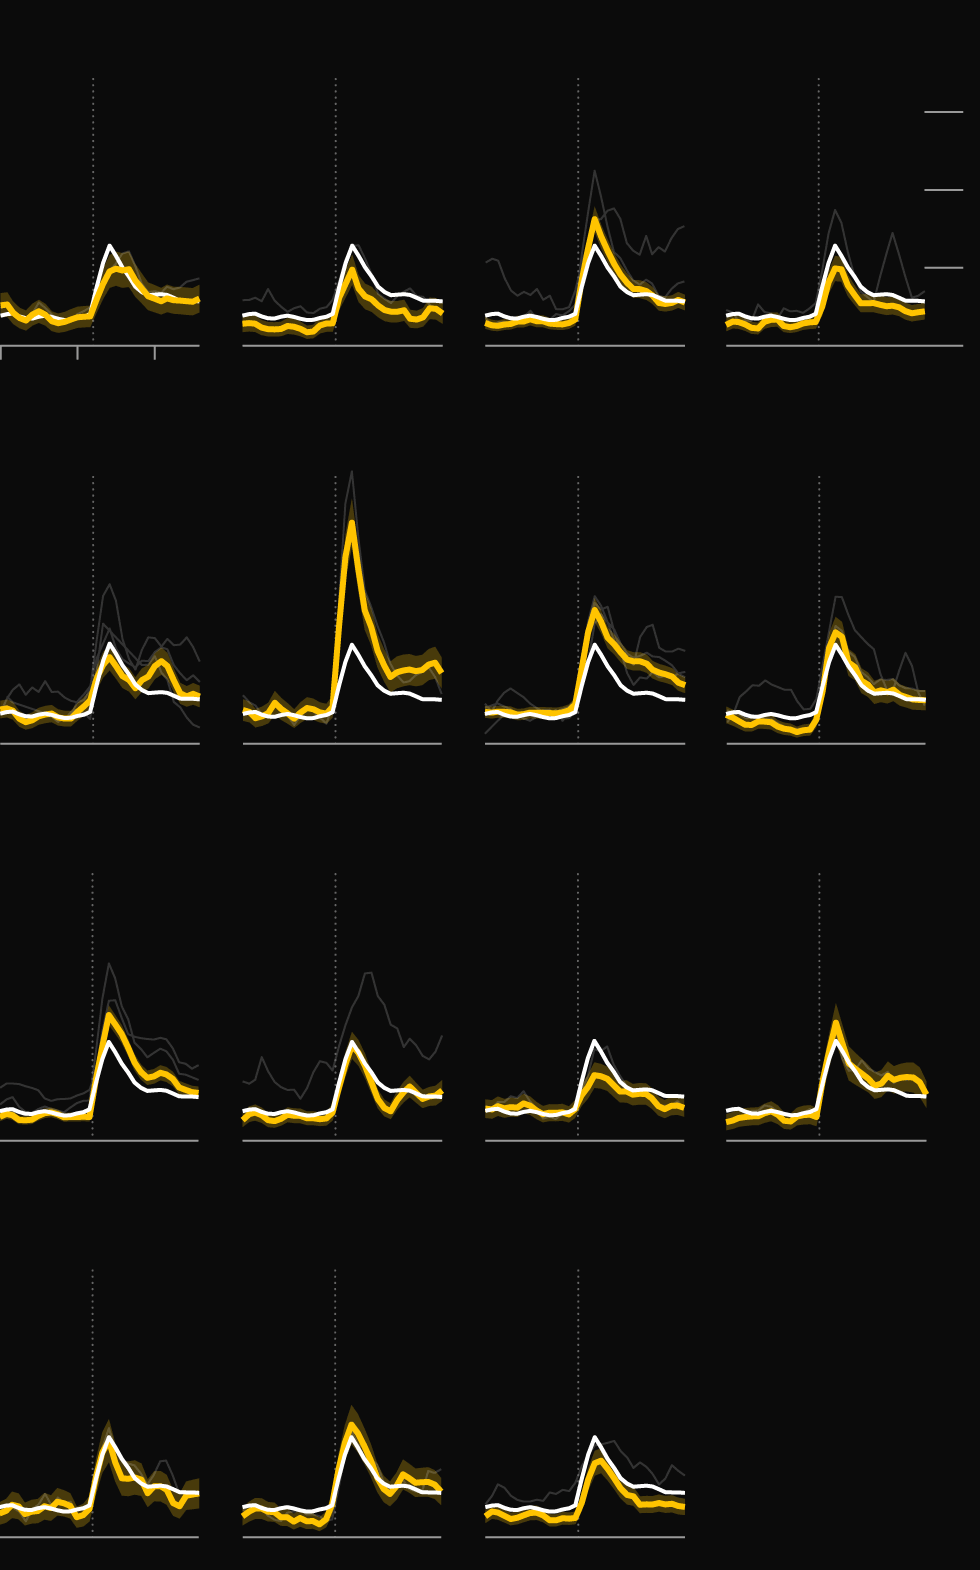
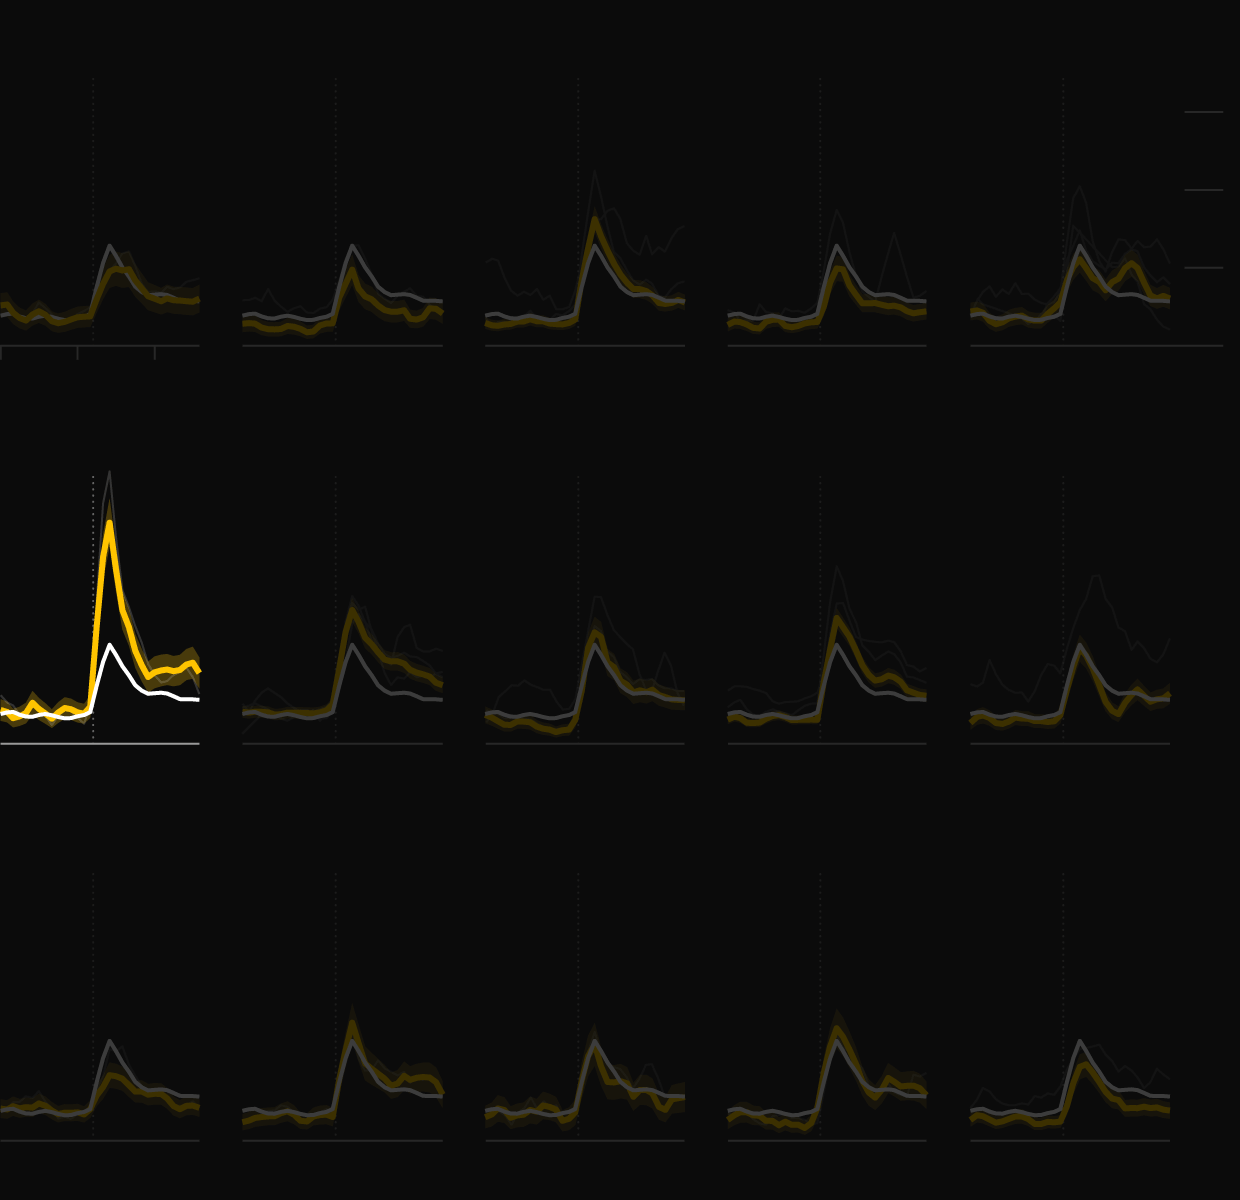
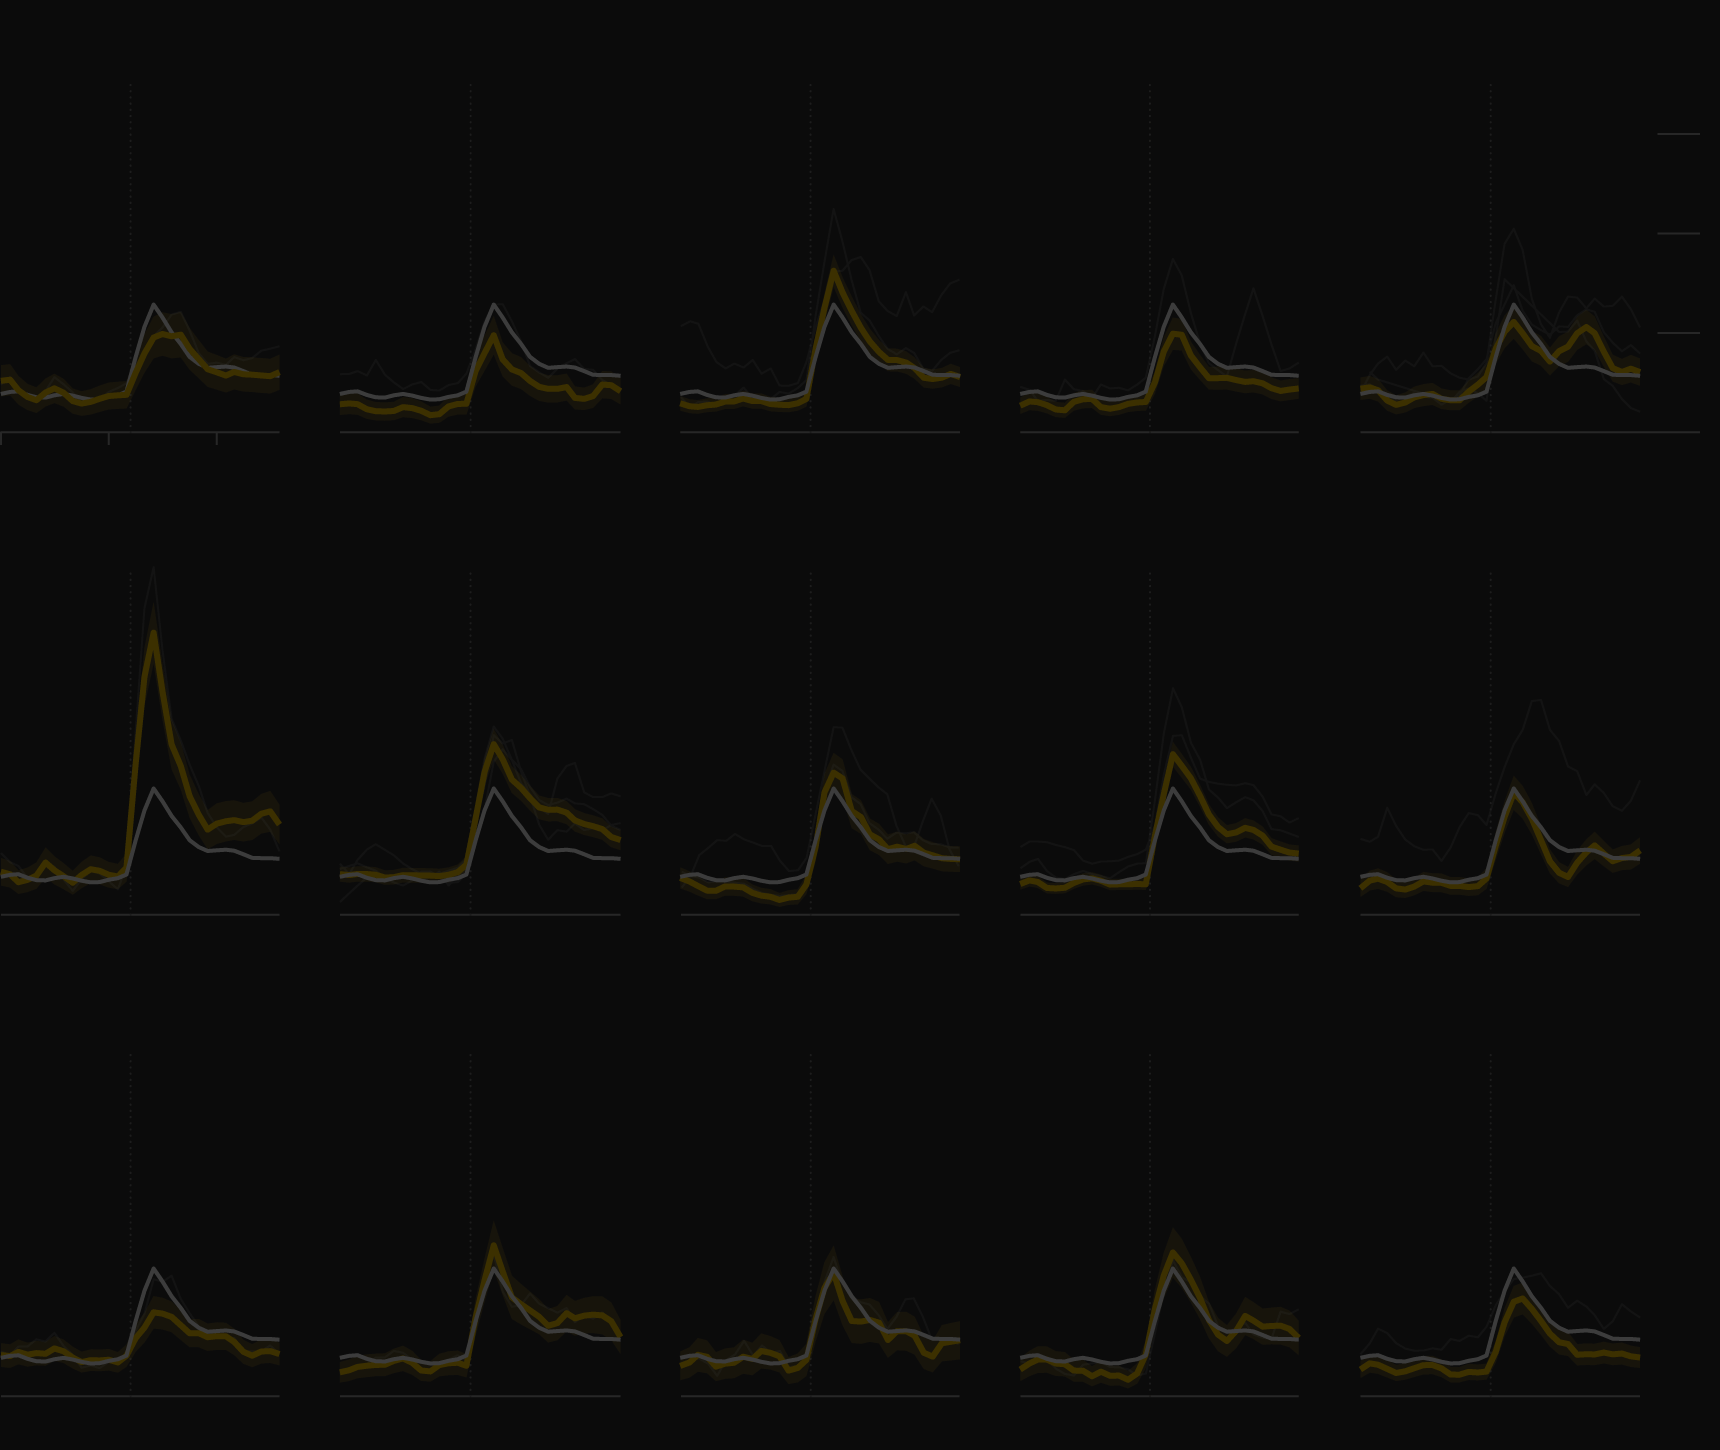
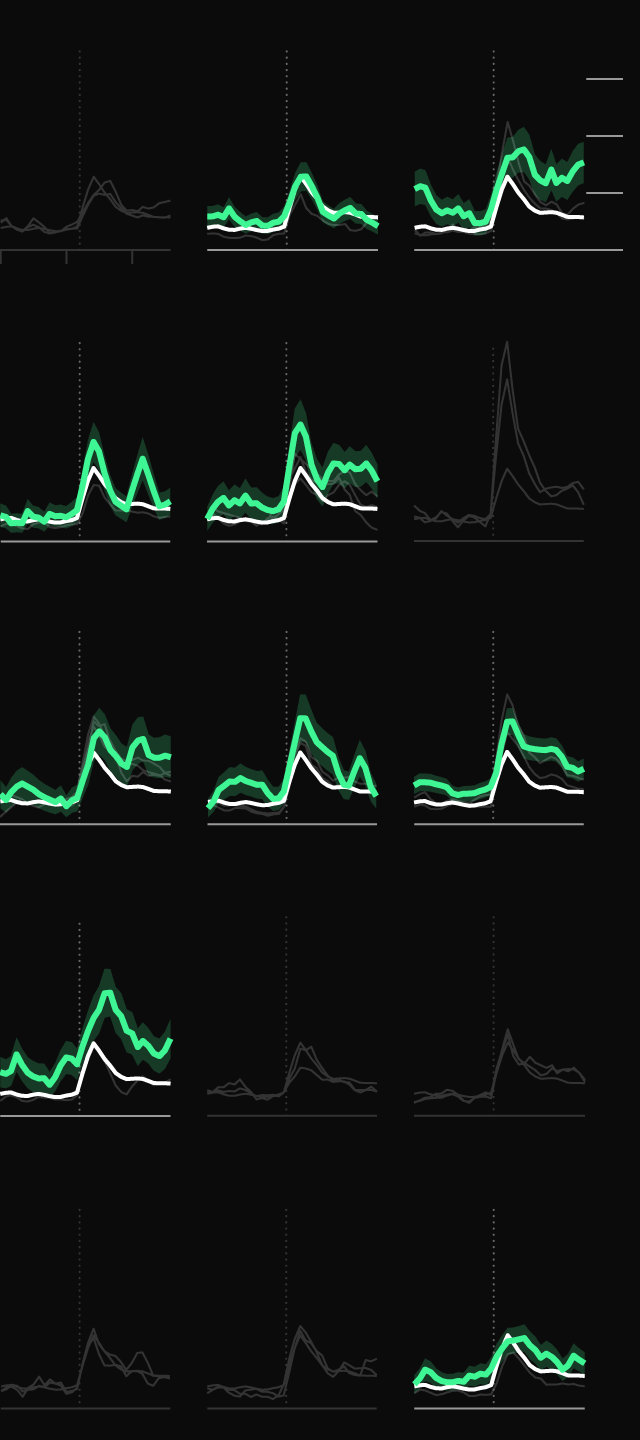
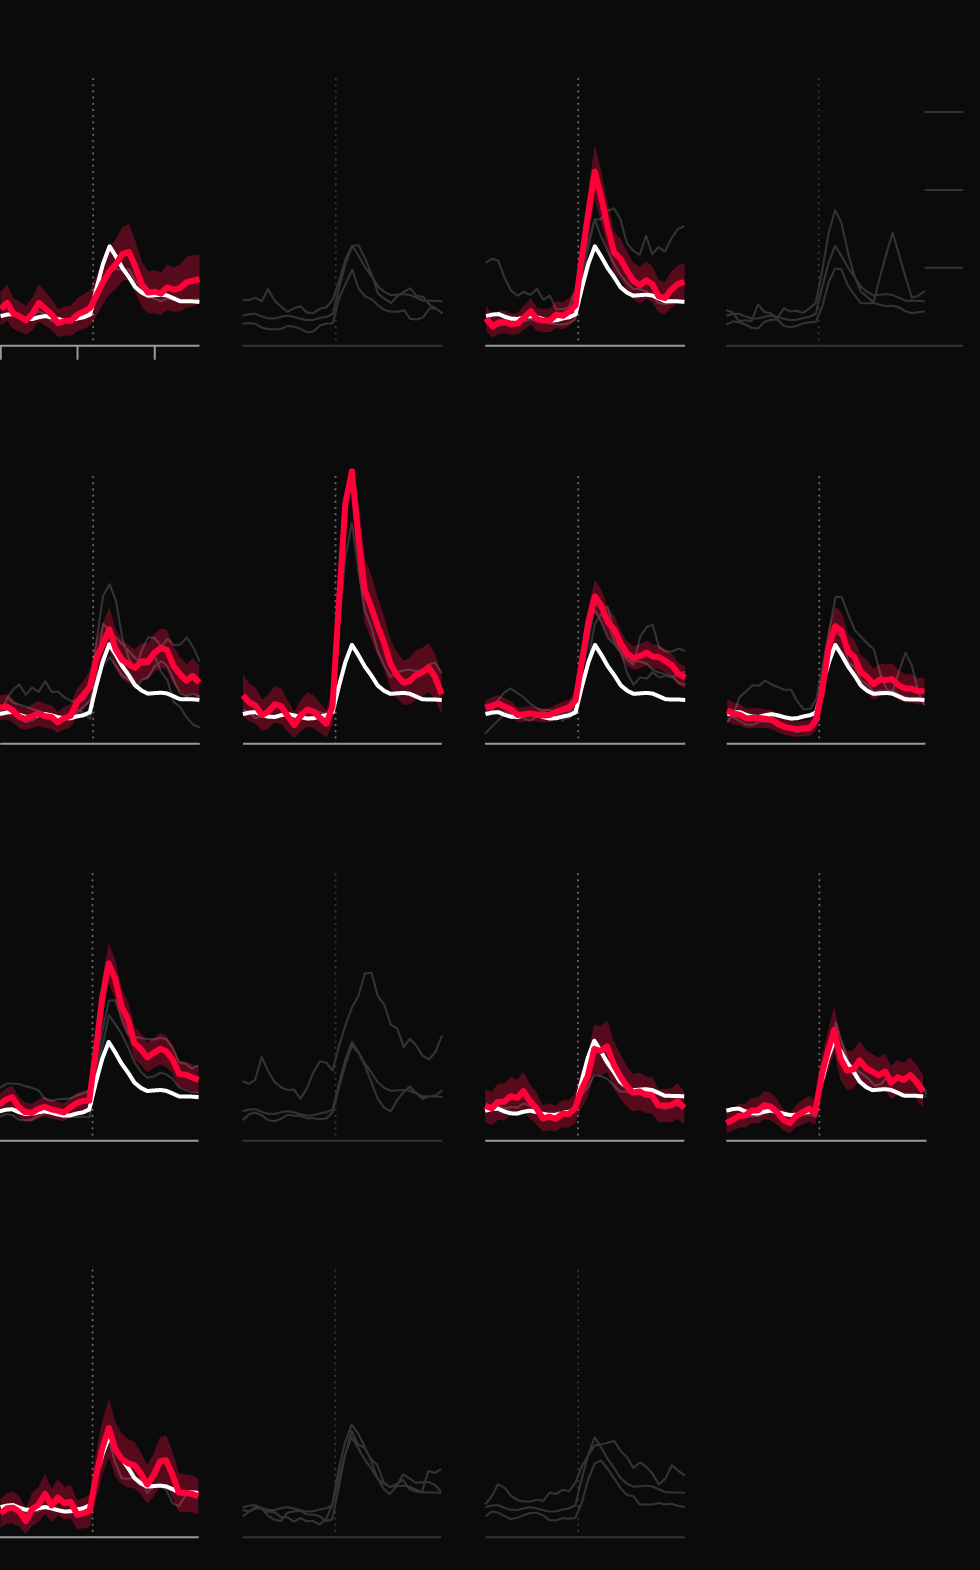
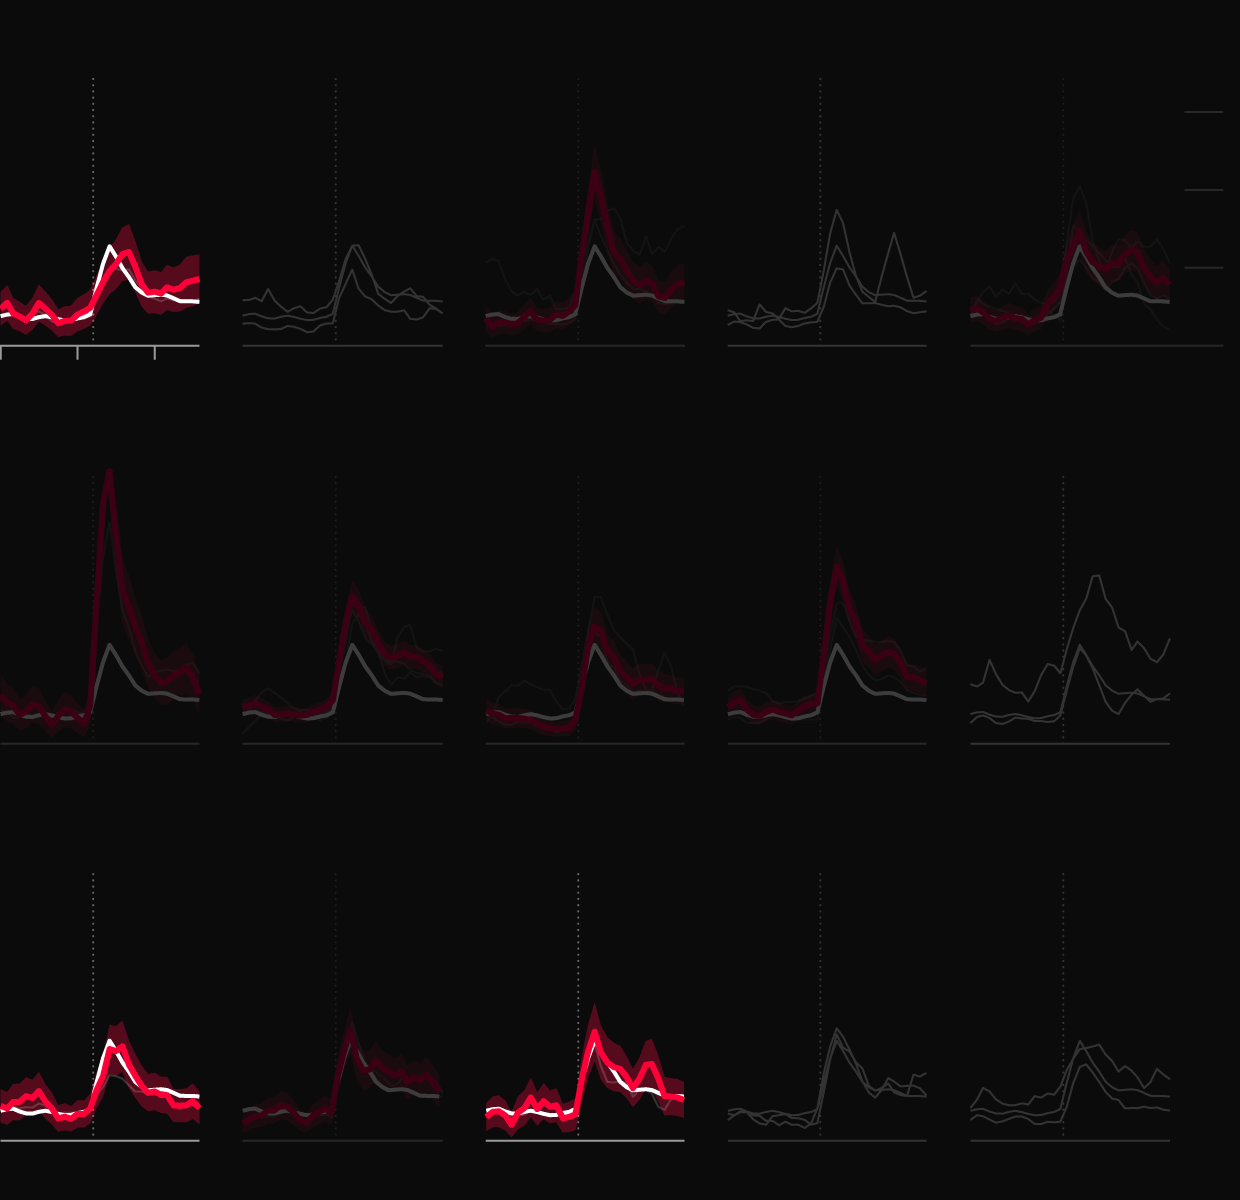
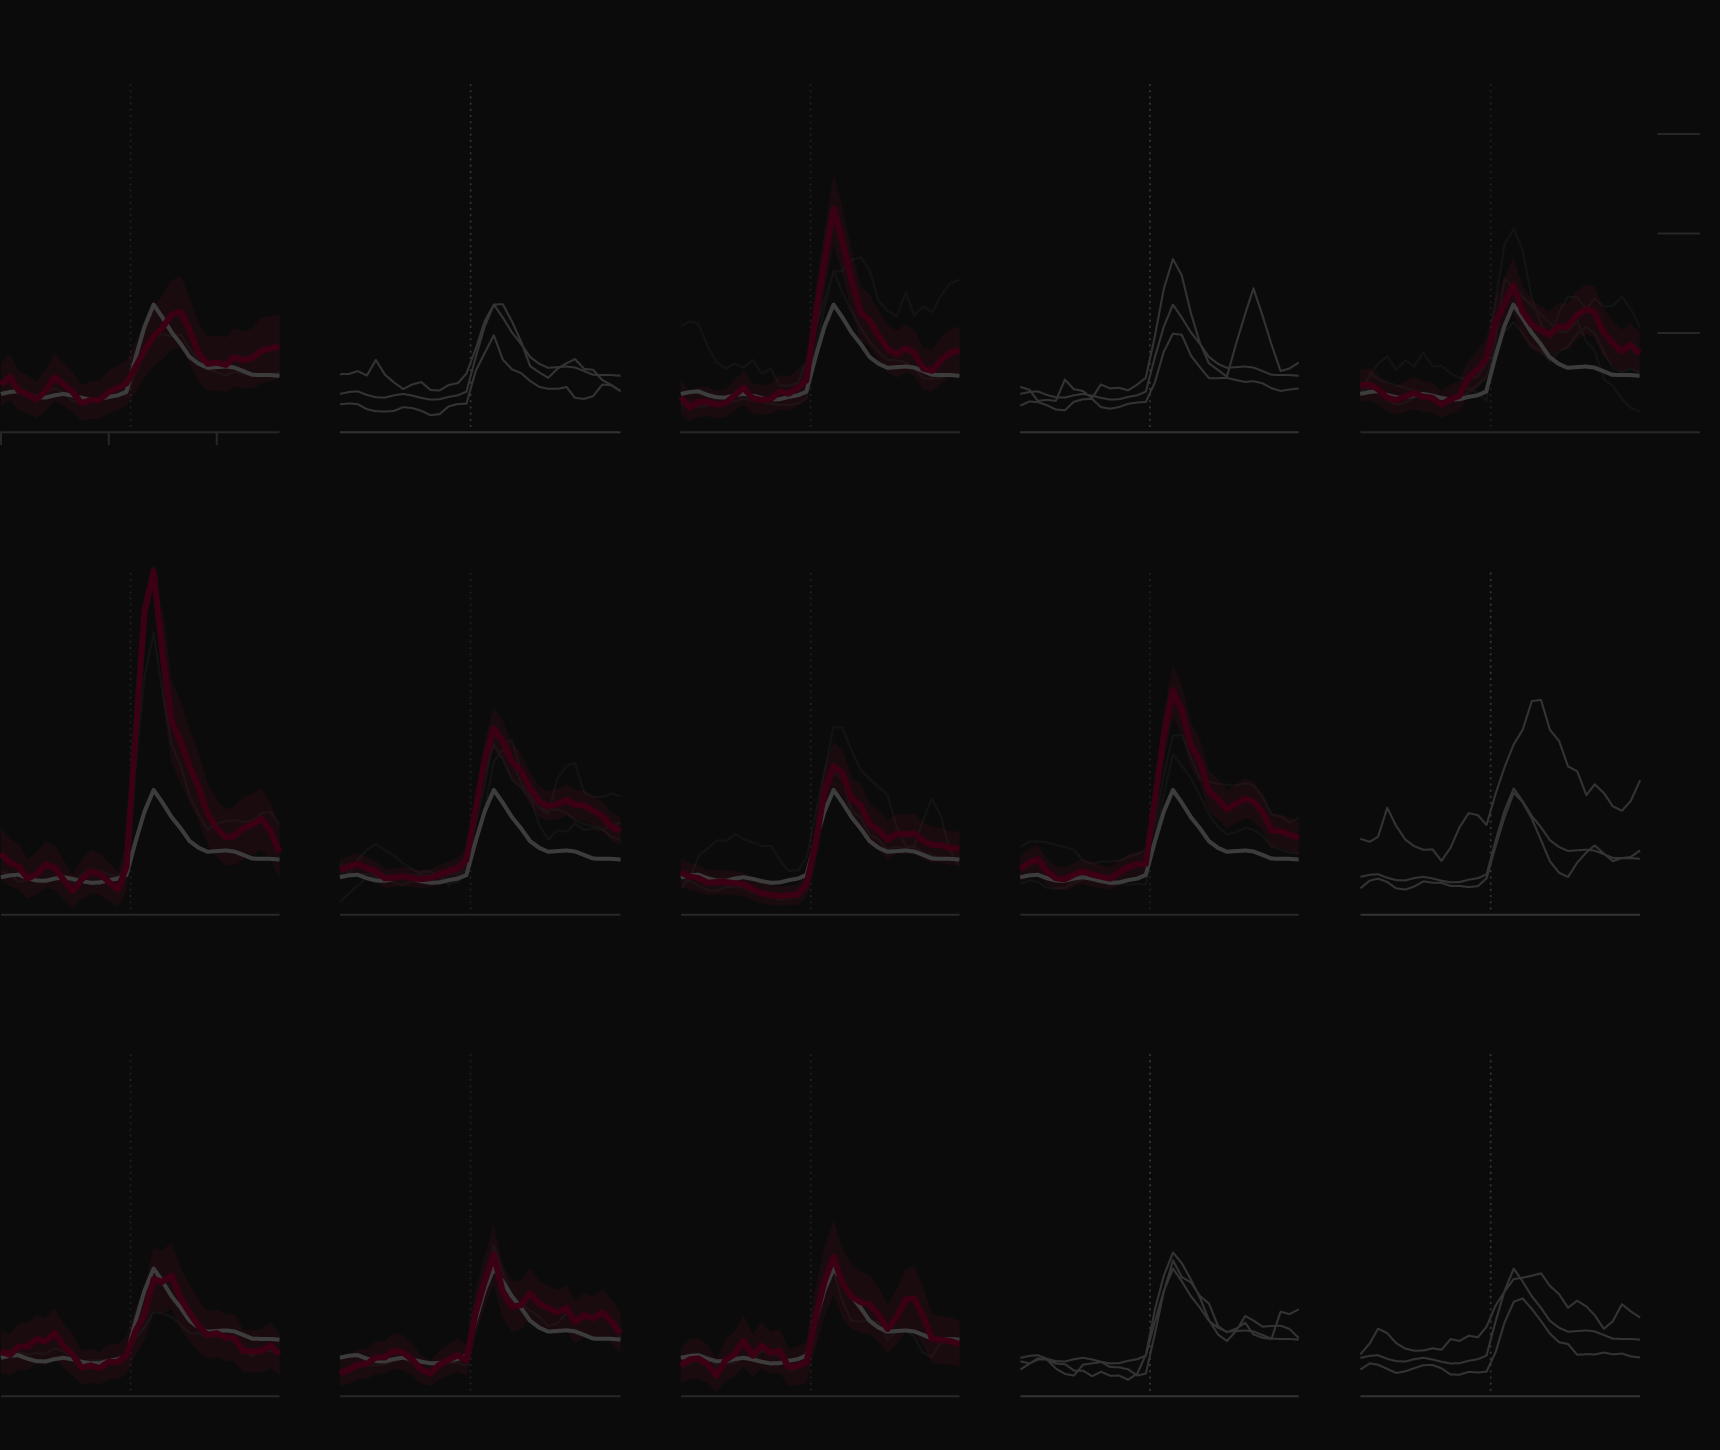
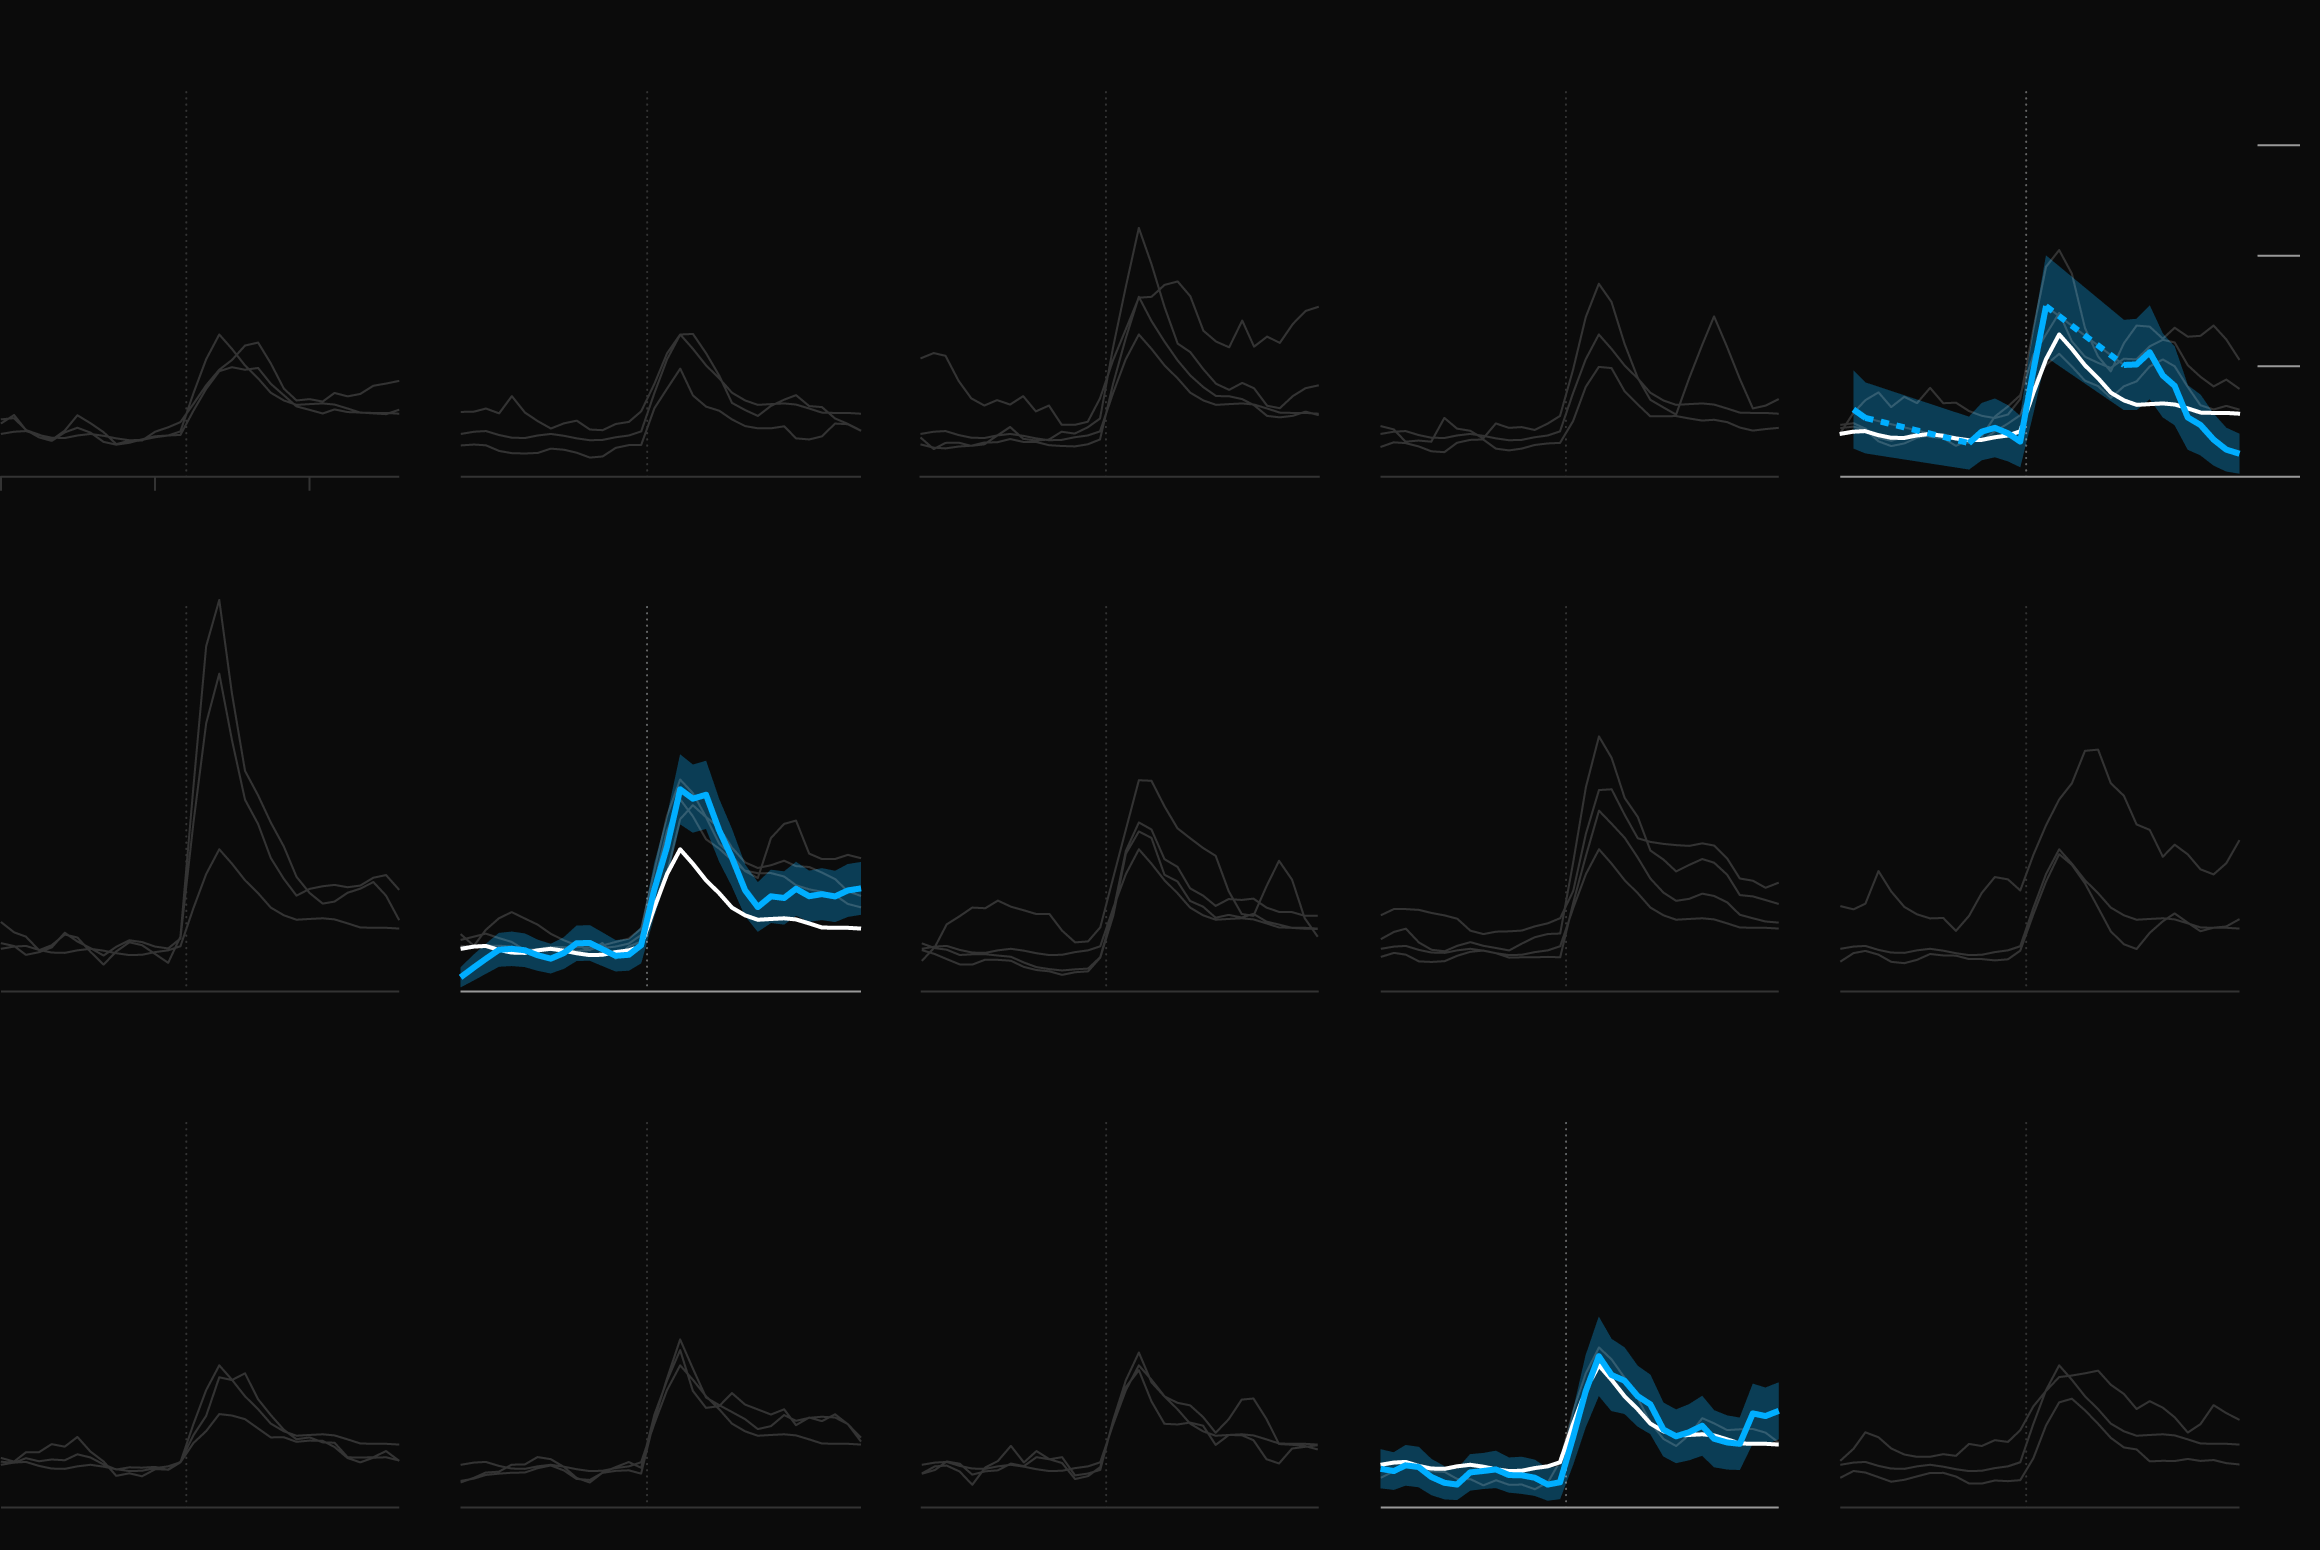
White Rates Among the Lowest
The unemployment rates for White people in the 15 metro areas being tracked by Bloomberg News are mainly clustered around the overall U.S. rate, except for Las Vegas, where it’s double the national average.
Note: The shaded ranges show the margins of error.
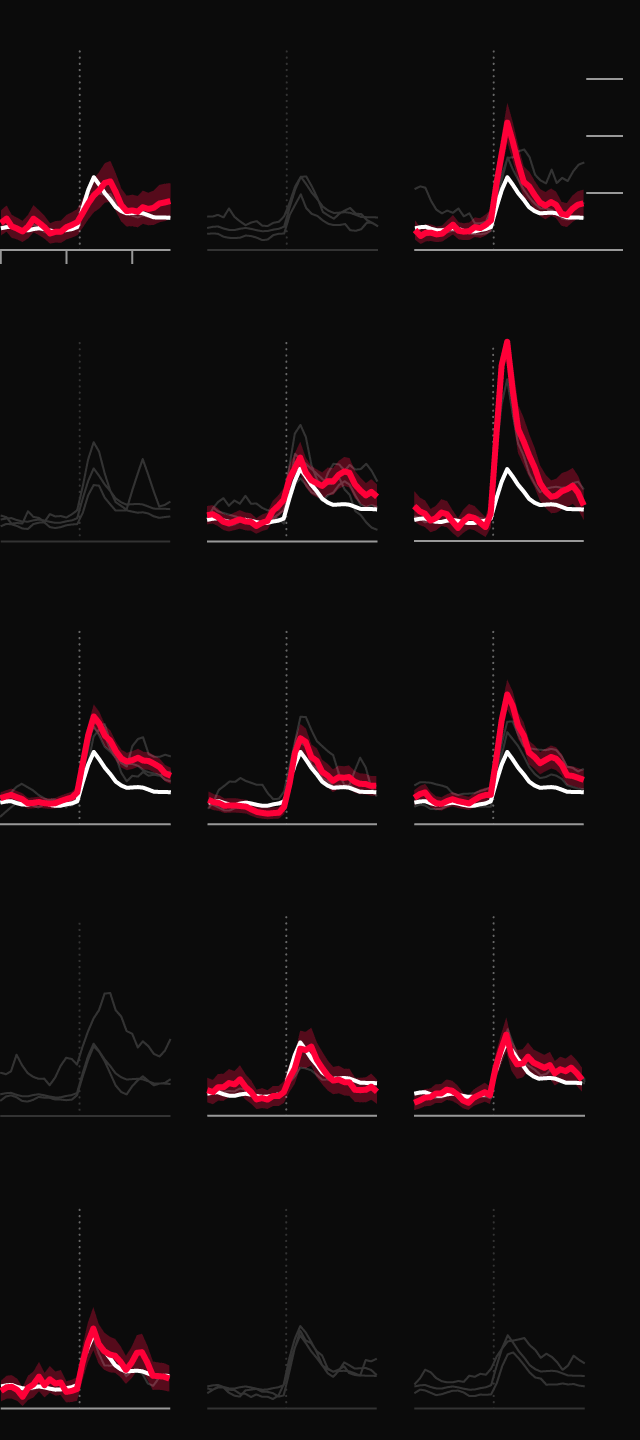
Sin City Needs a Boost
While casinos have opened and visitors have followed, the tourism-dependent city is still missing one big piece of its economy. “It’s not 100% because we don't have the conventions yet,” said Geoconda Argüello-Kline, secretary-treasurer for the Culinary Workers Union Local 226, which represents thousands of casino workers. About 35% of union members are not back to work, she said.
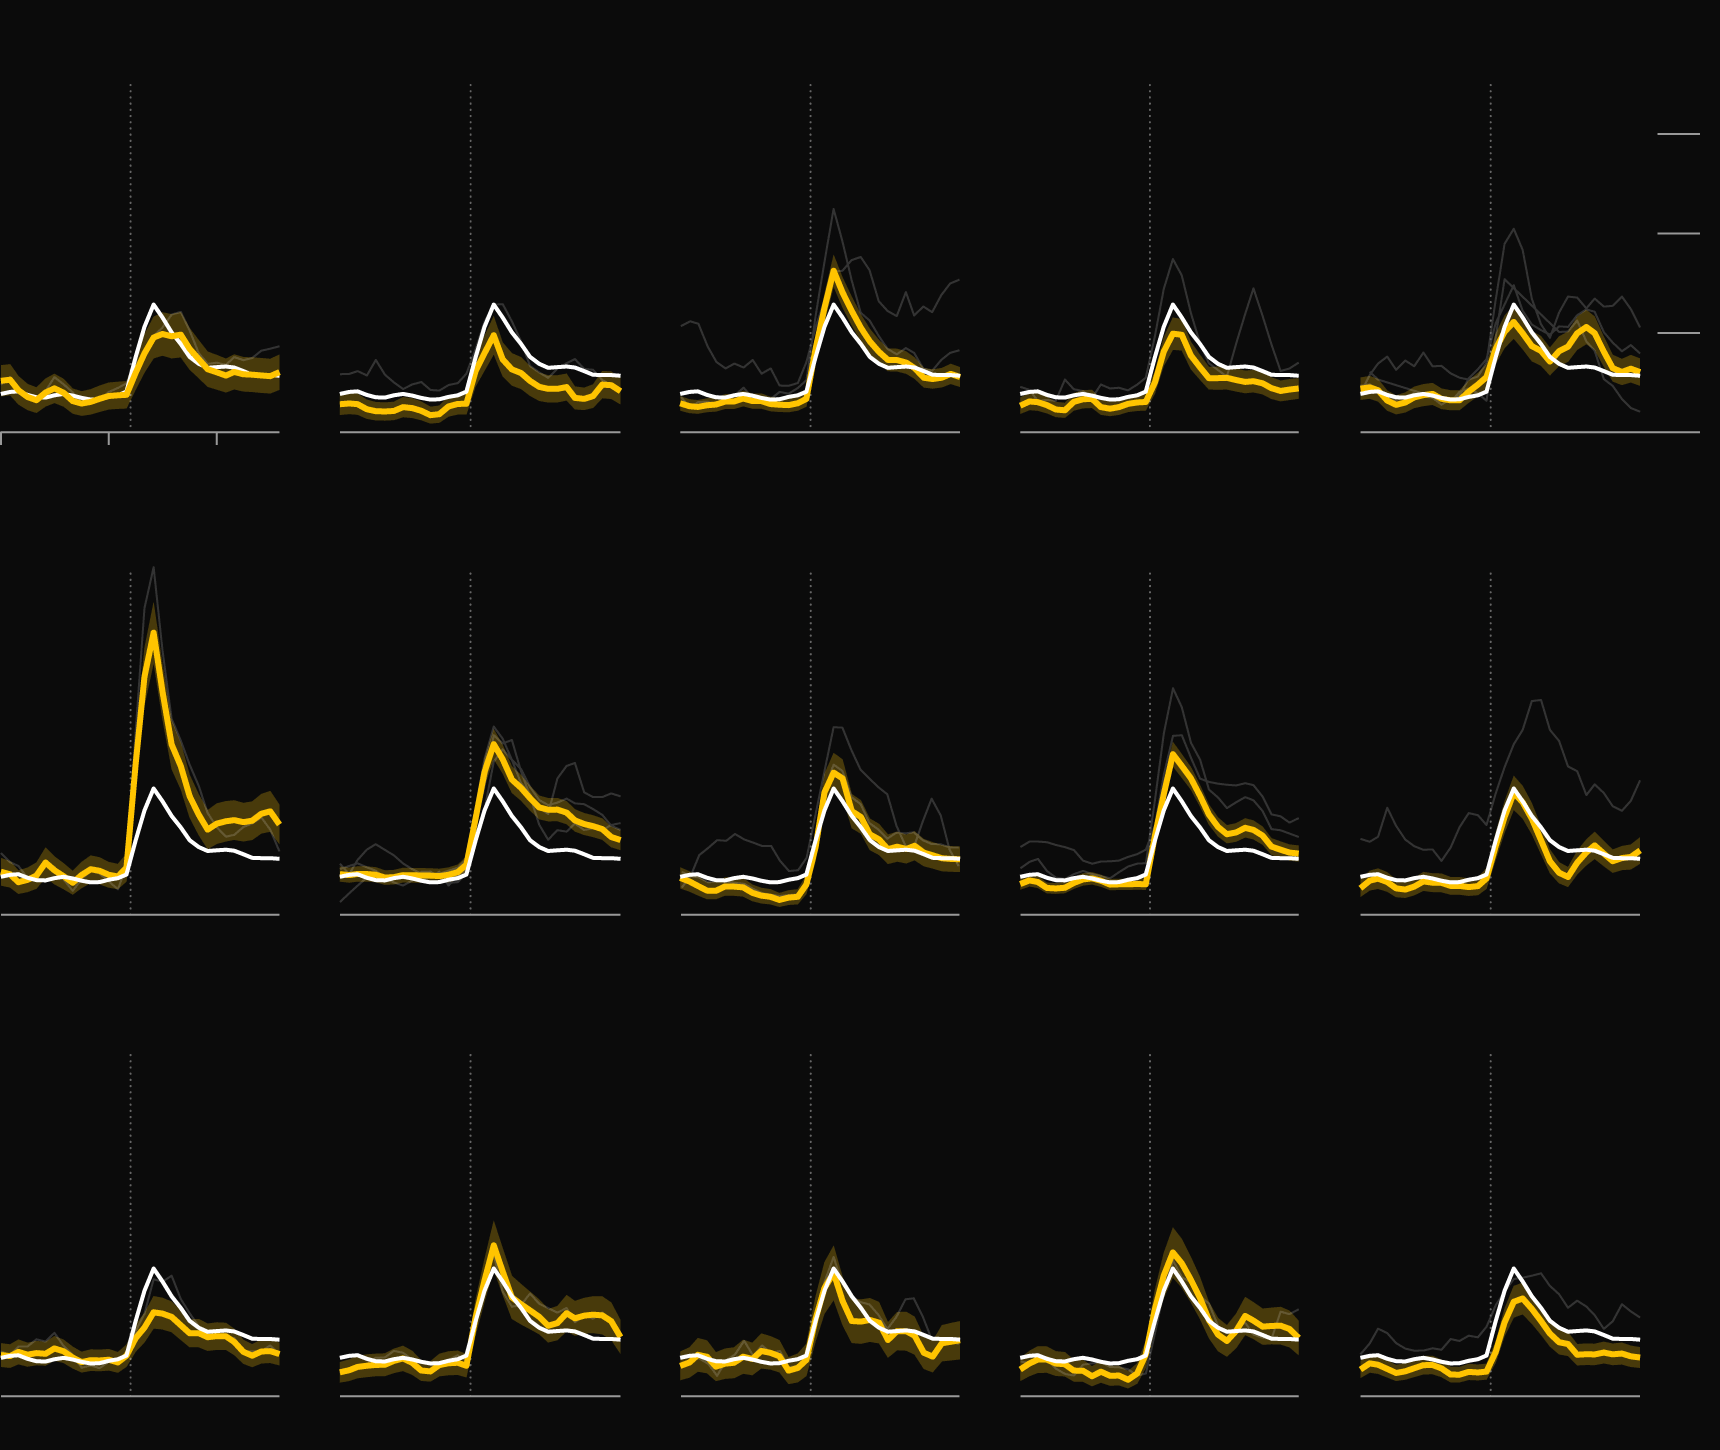
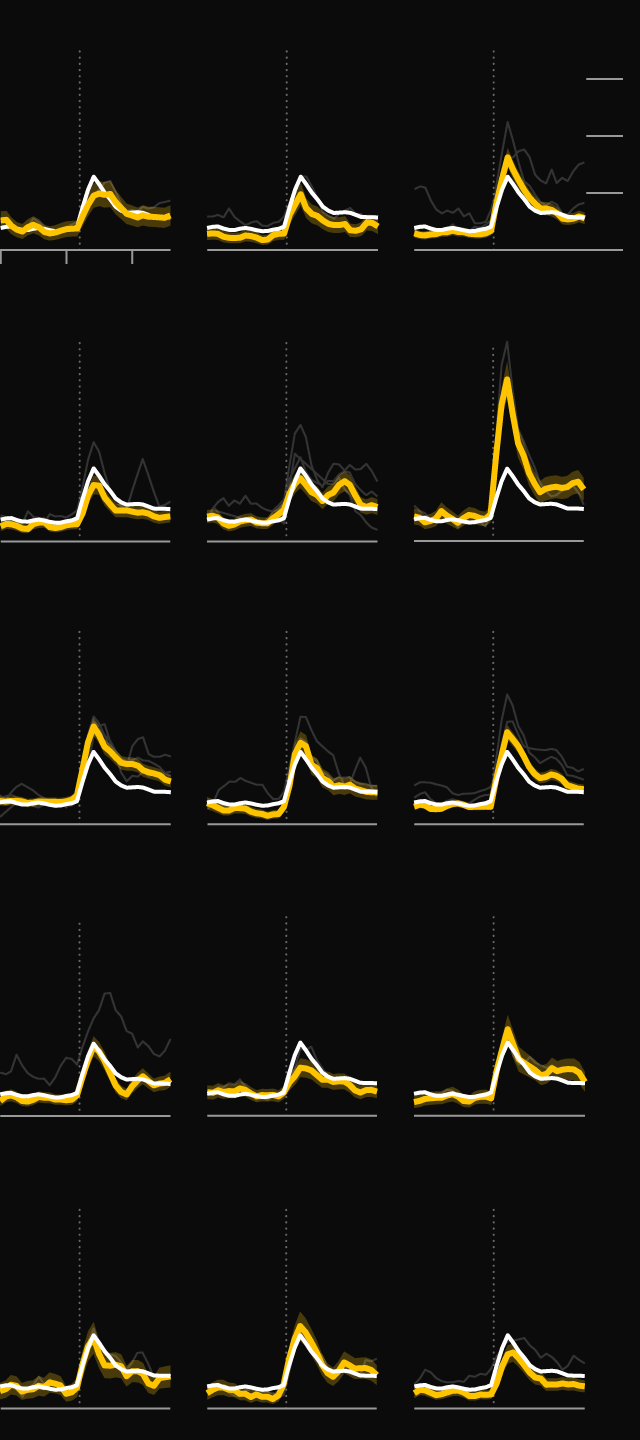
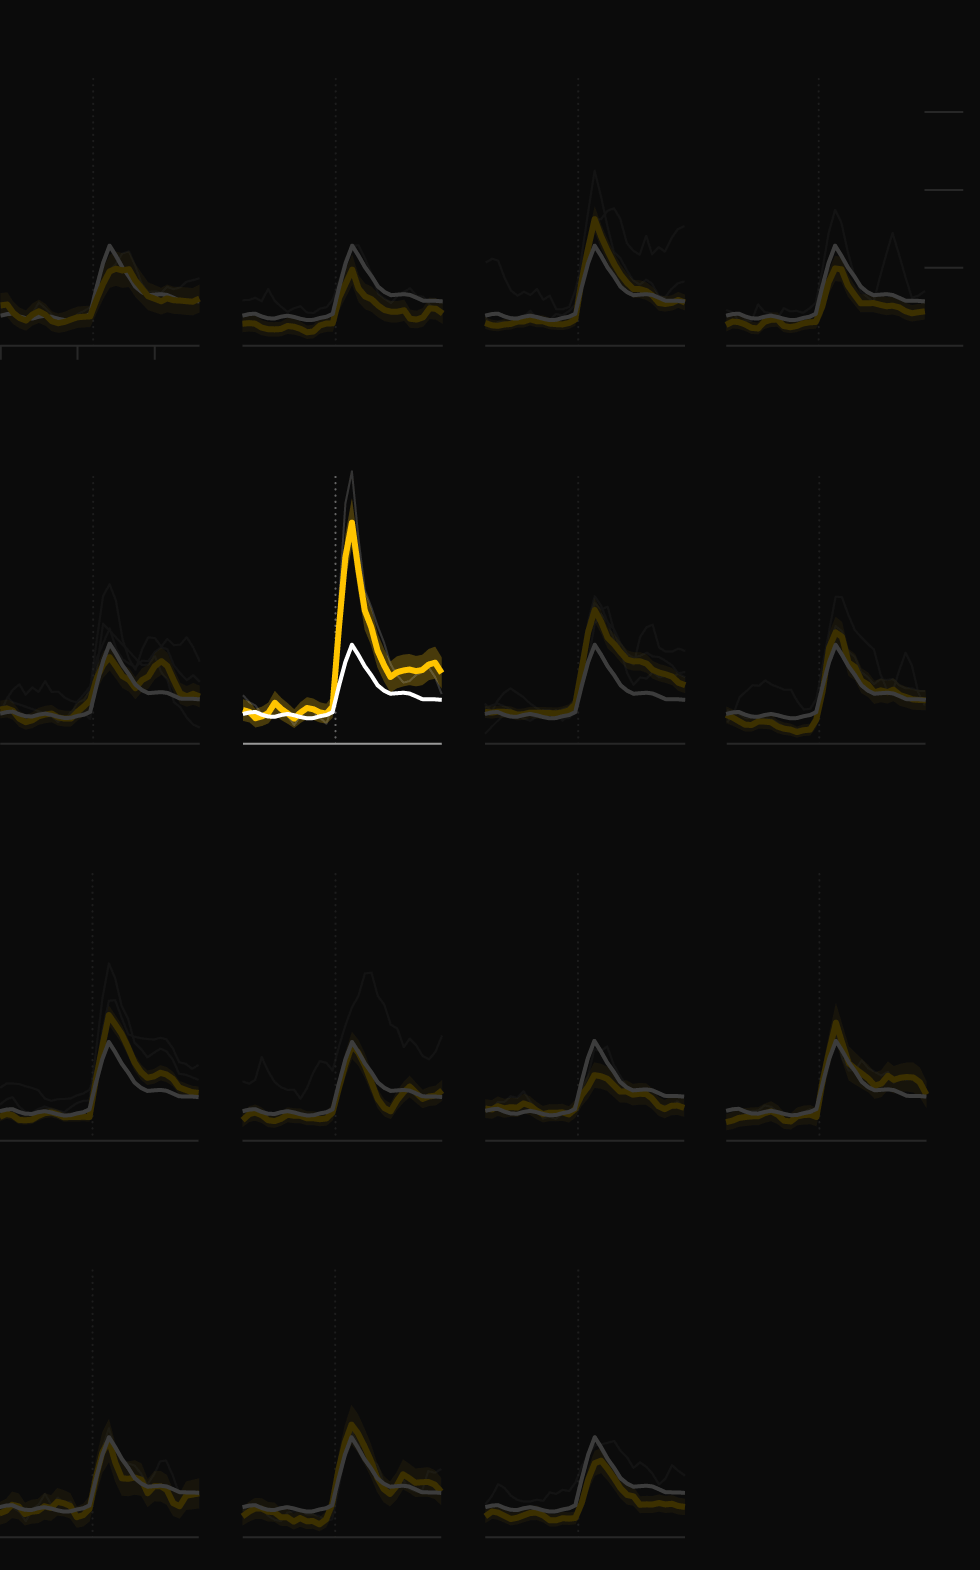
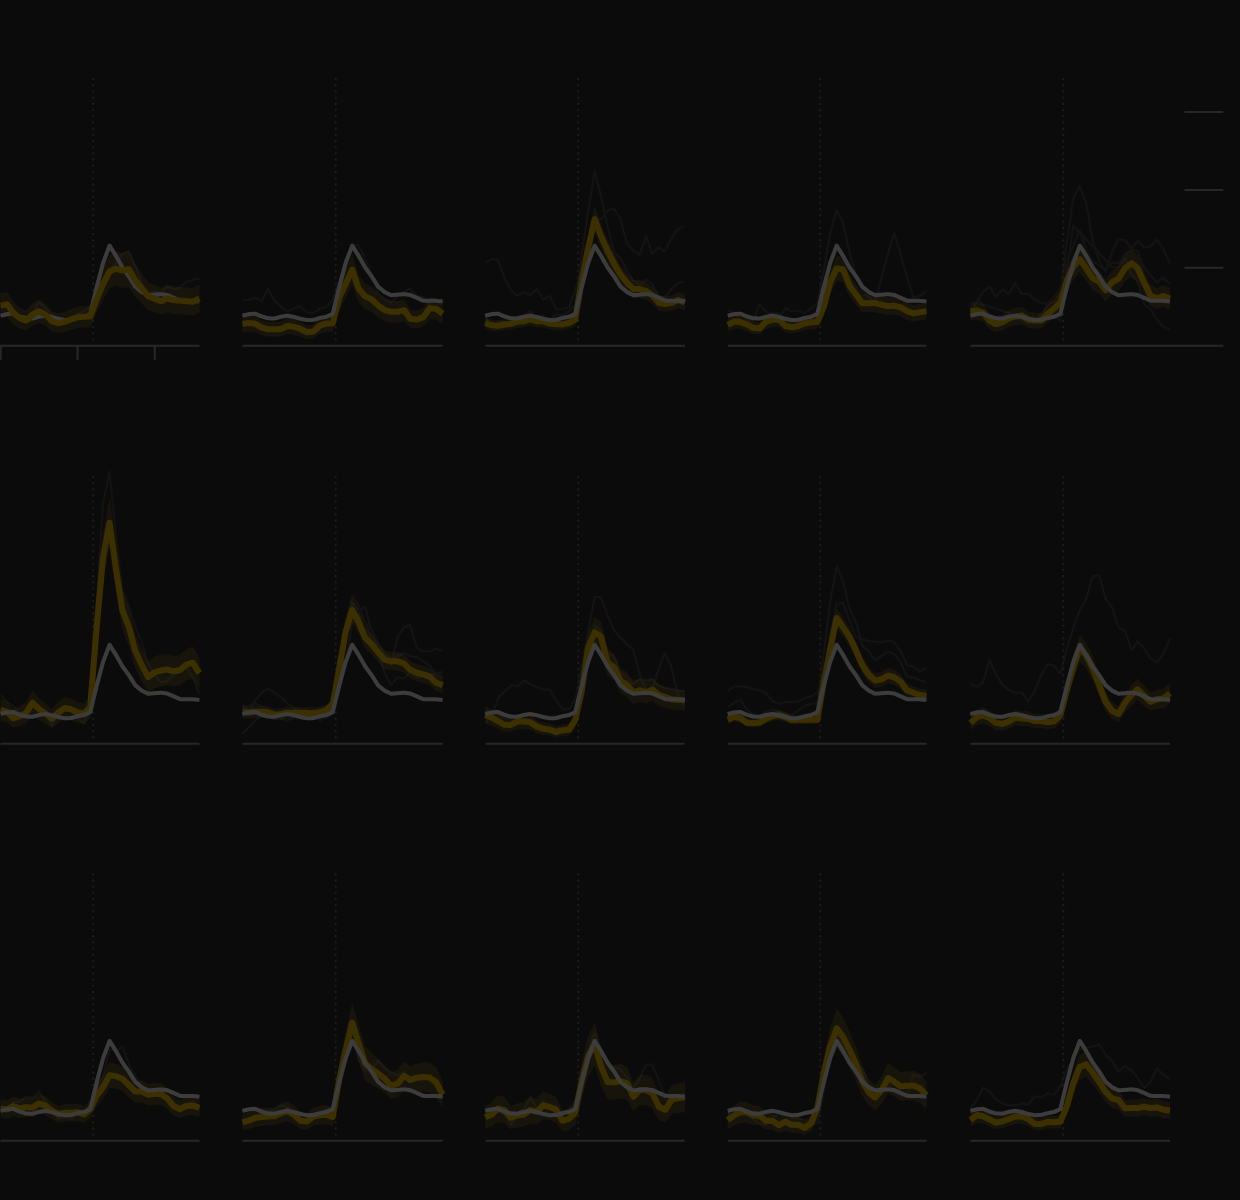
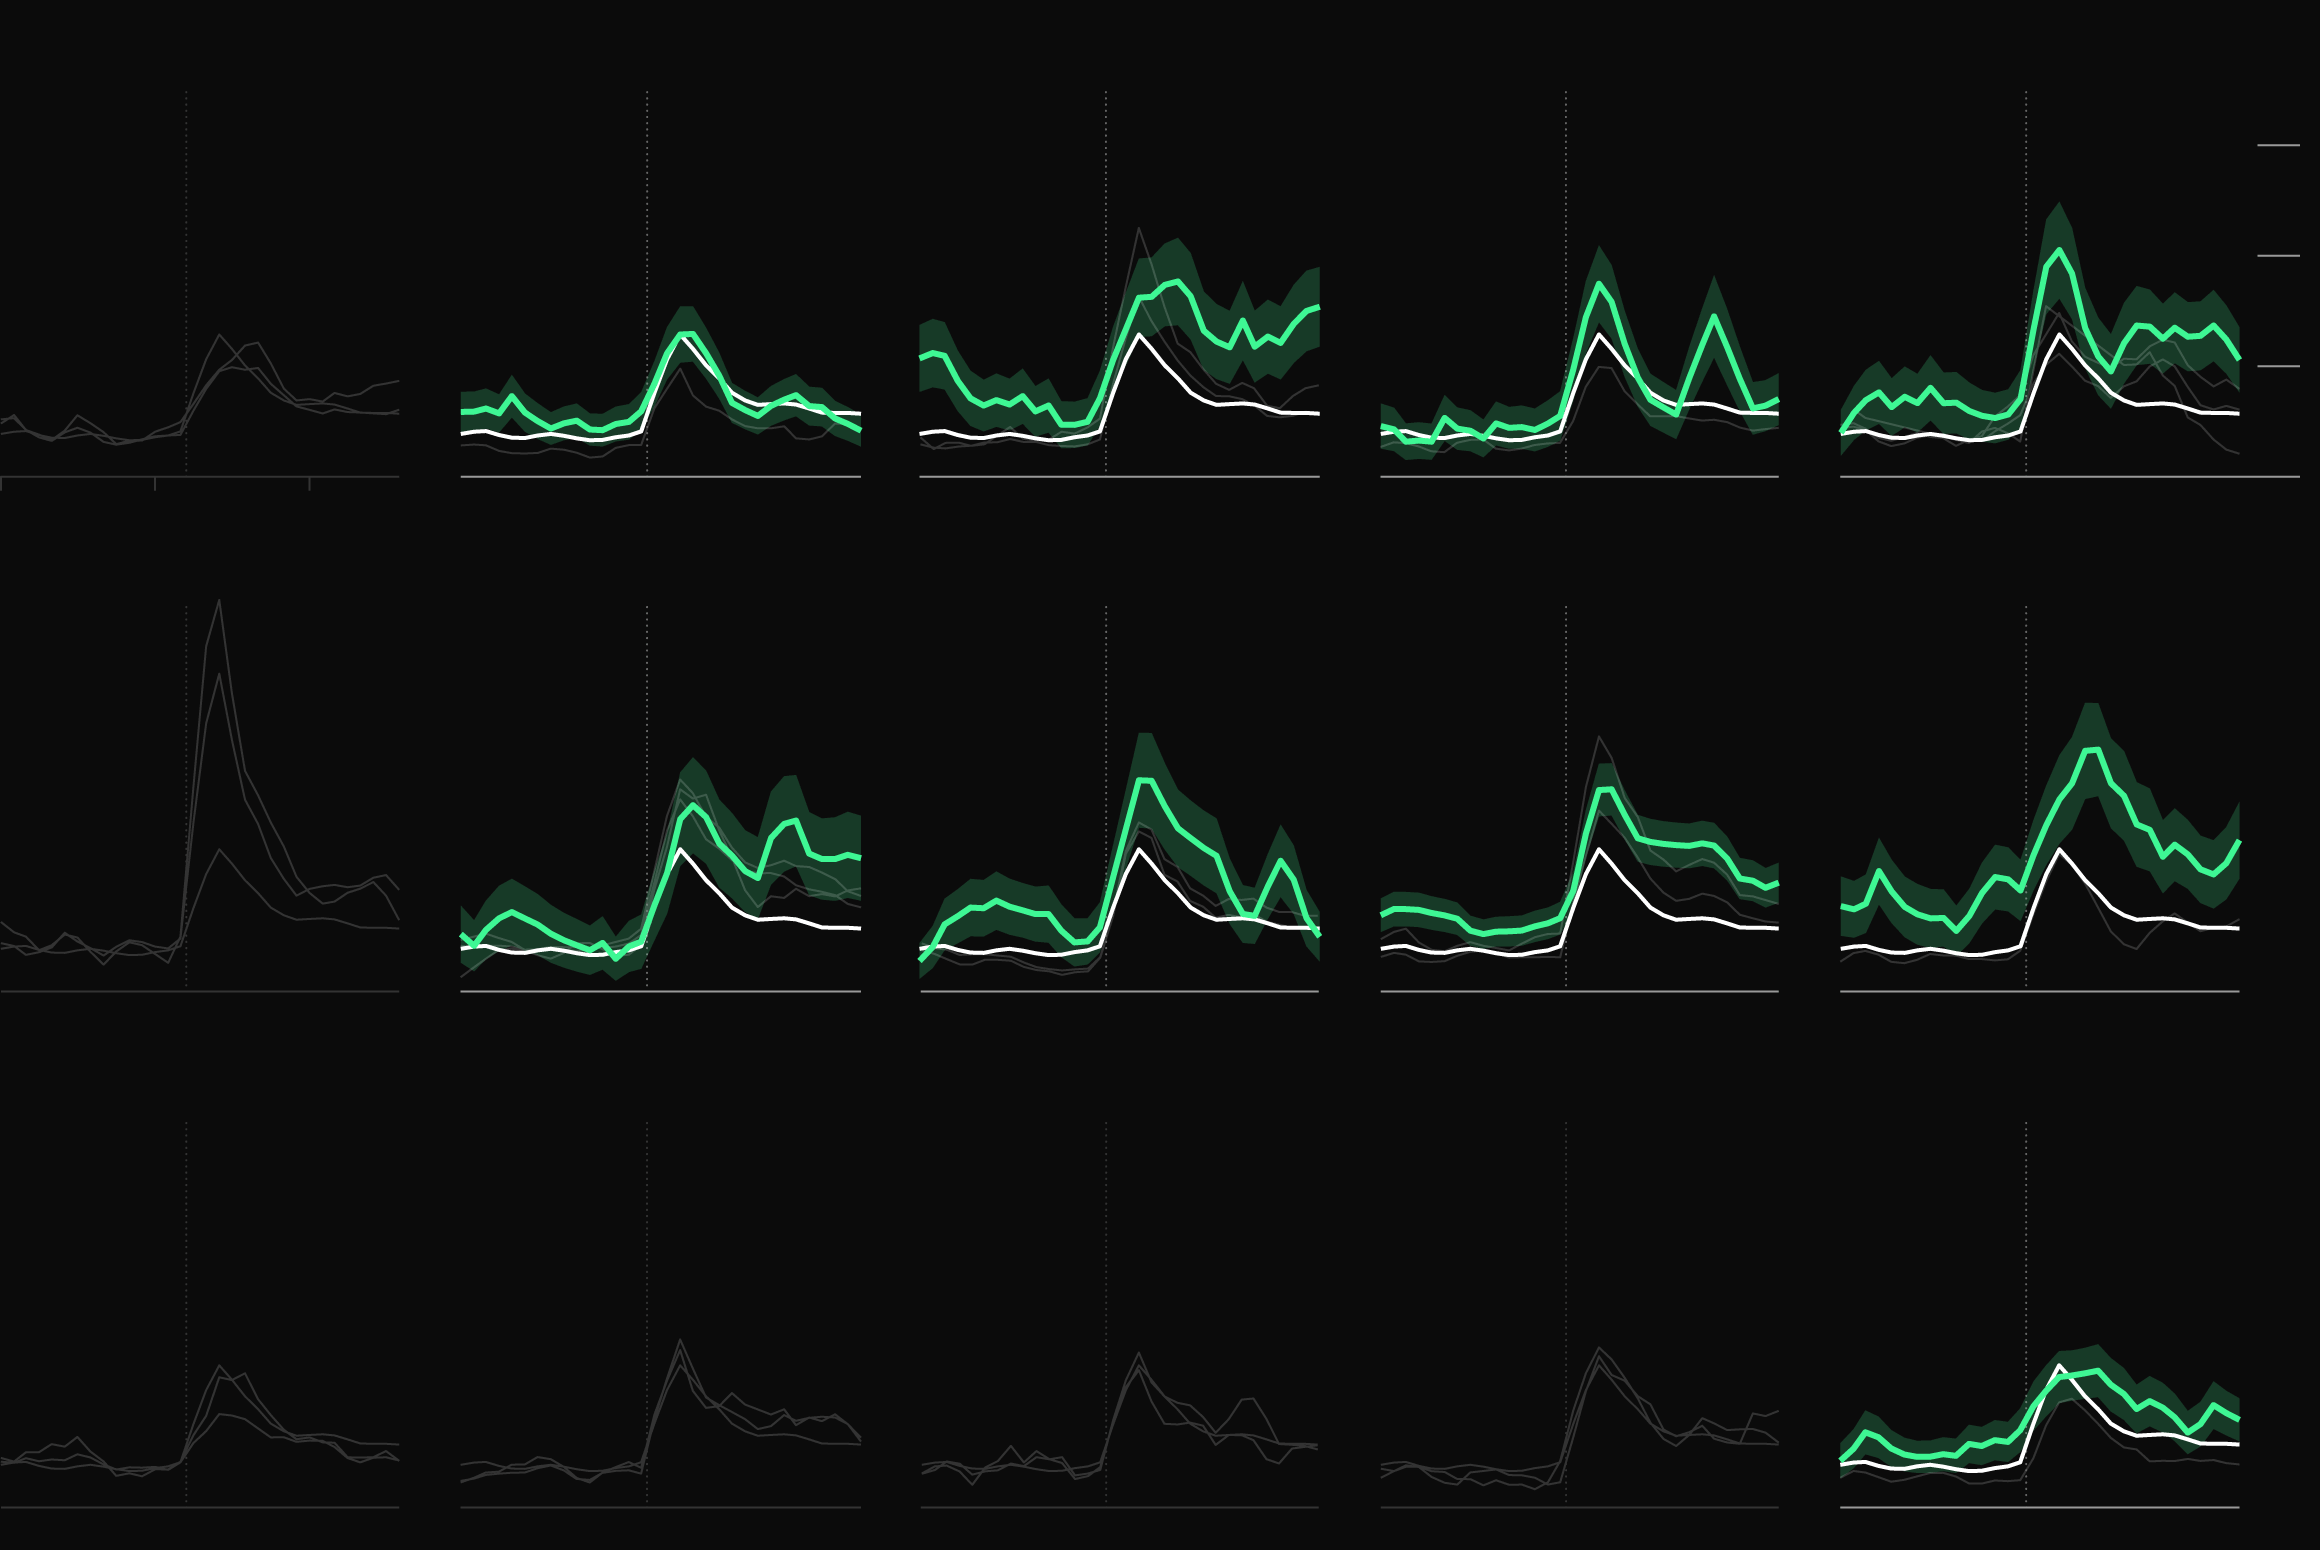
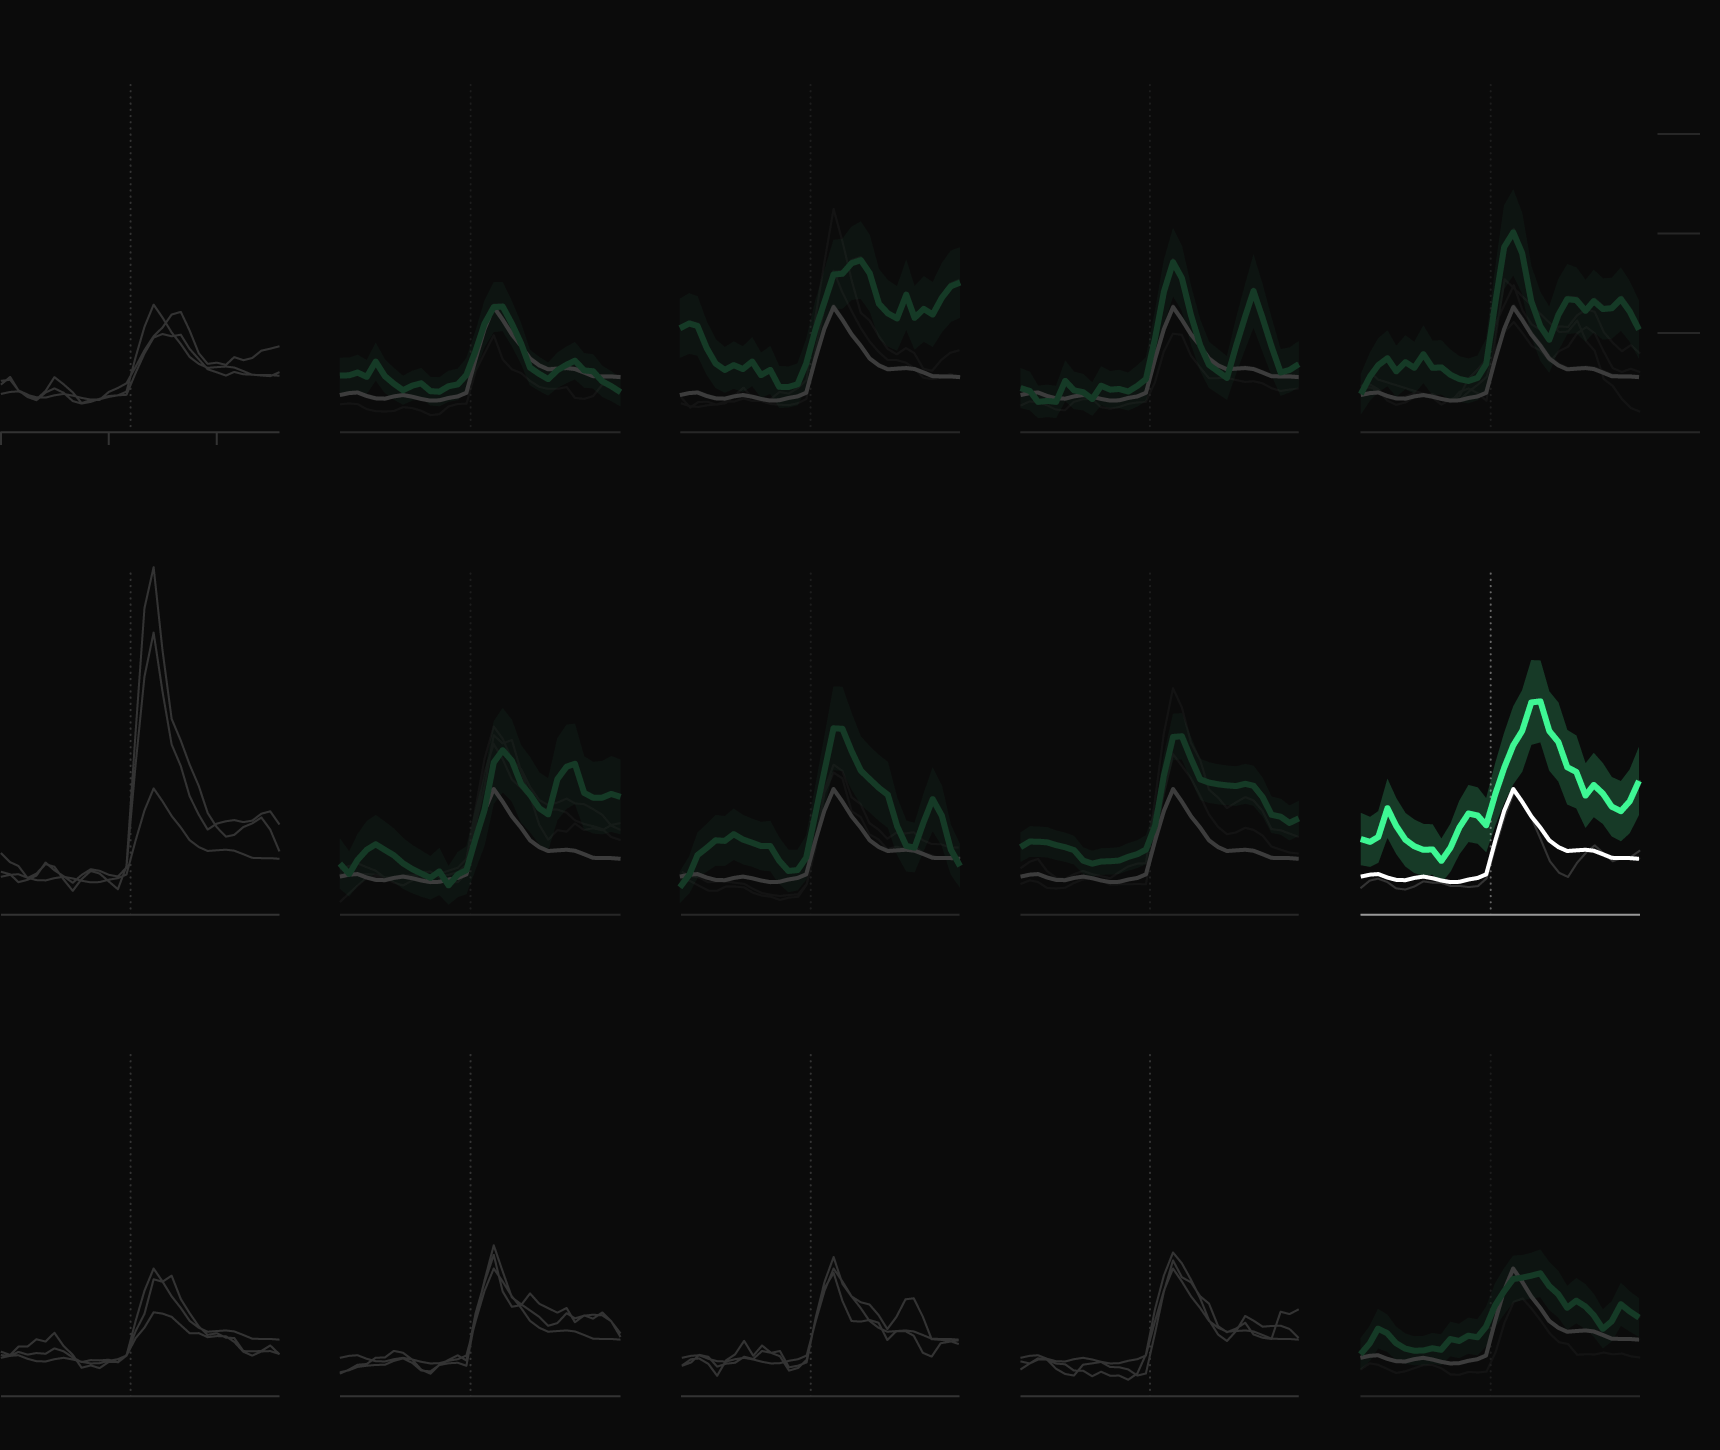
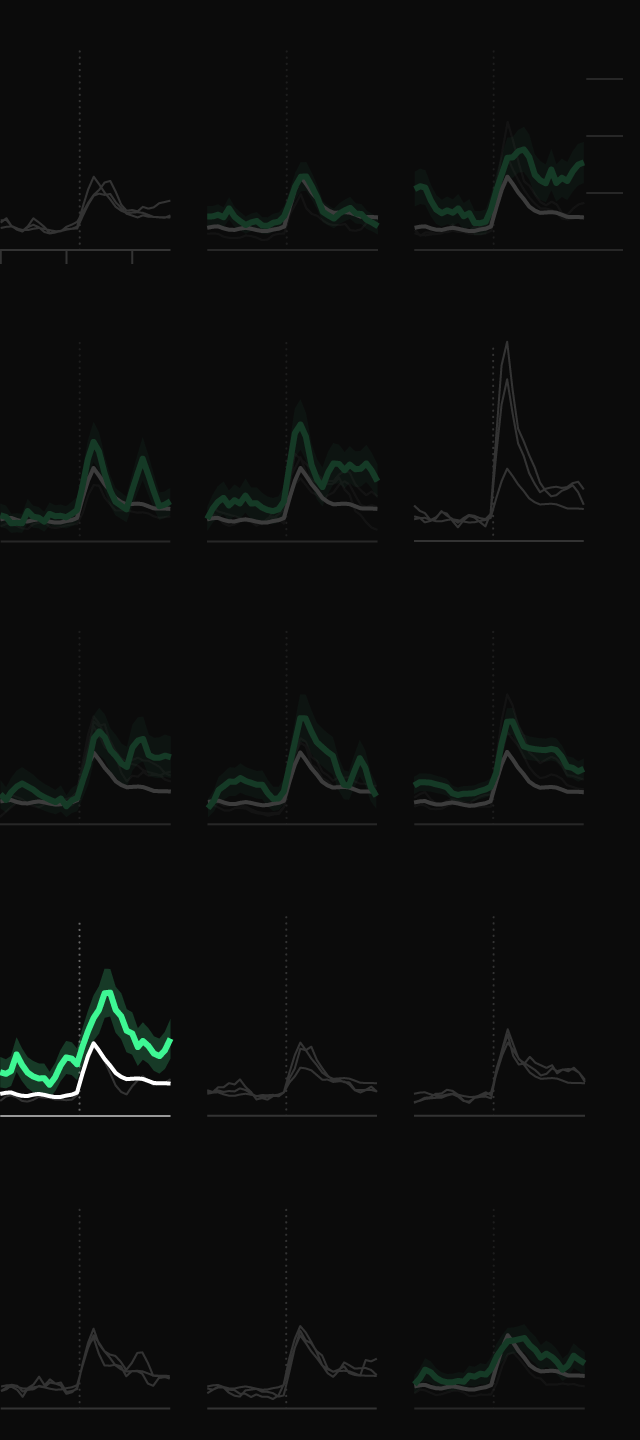
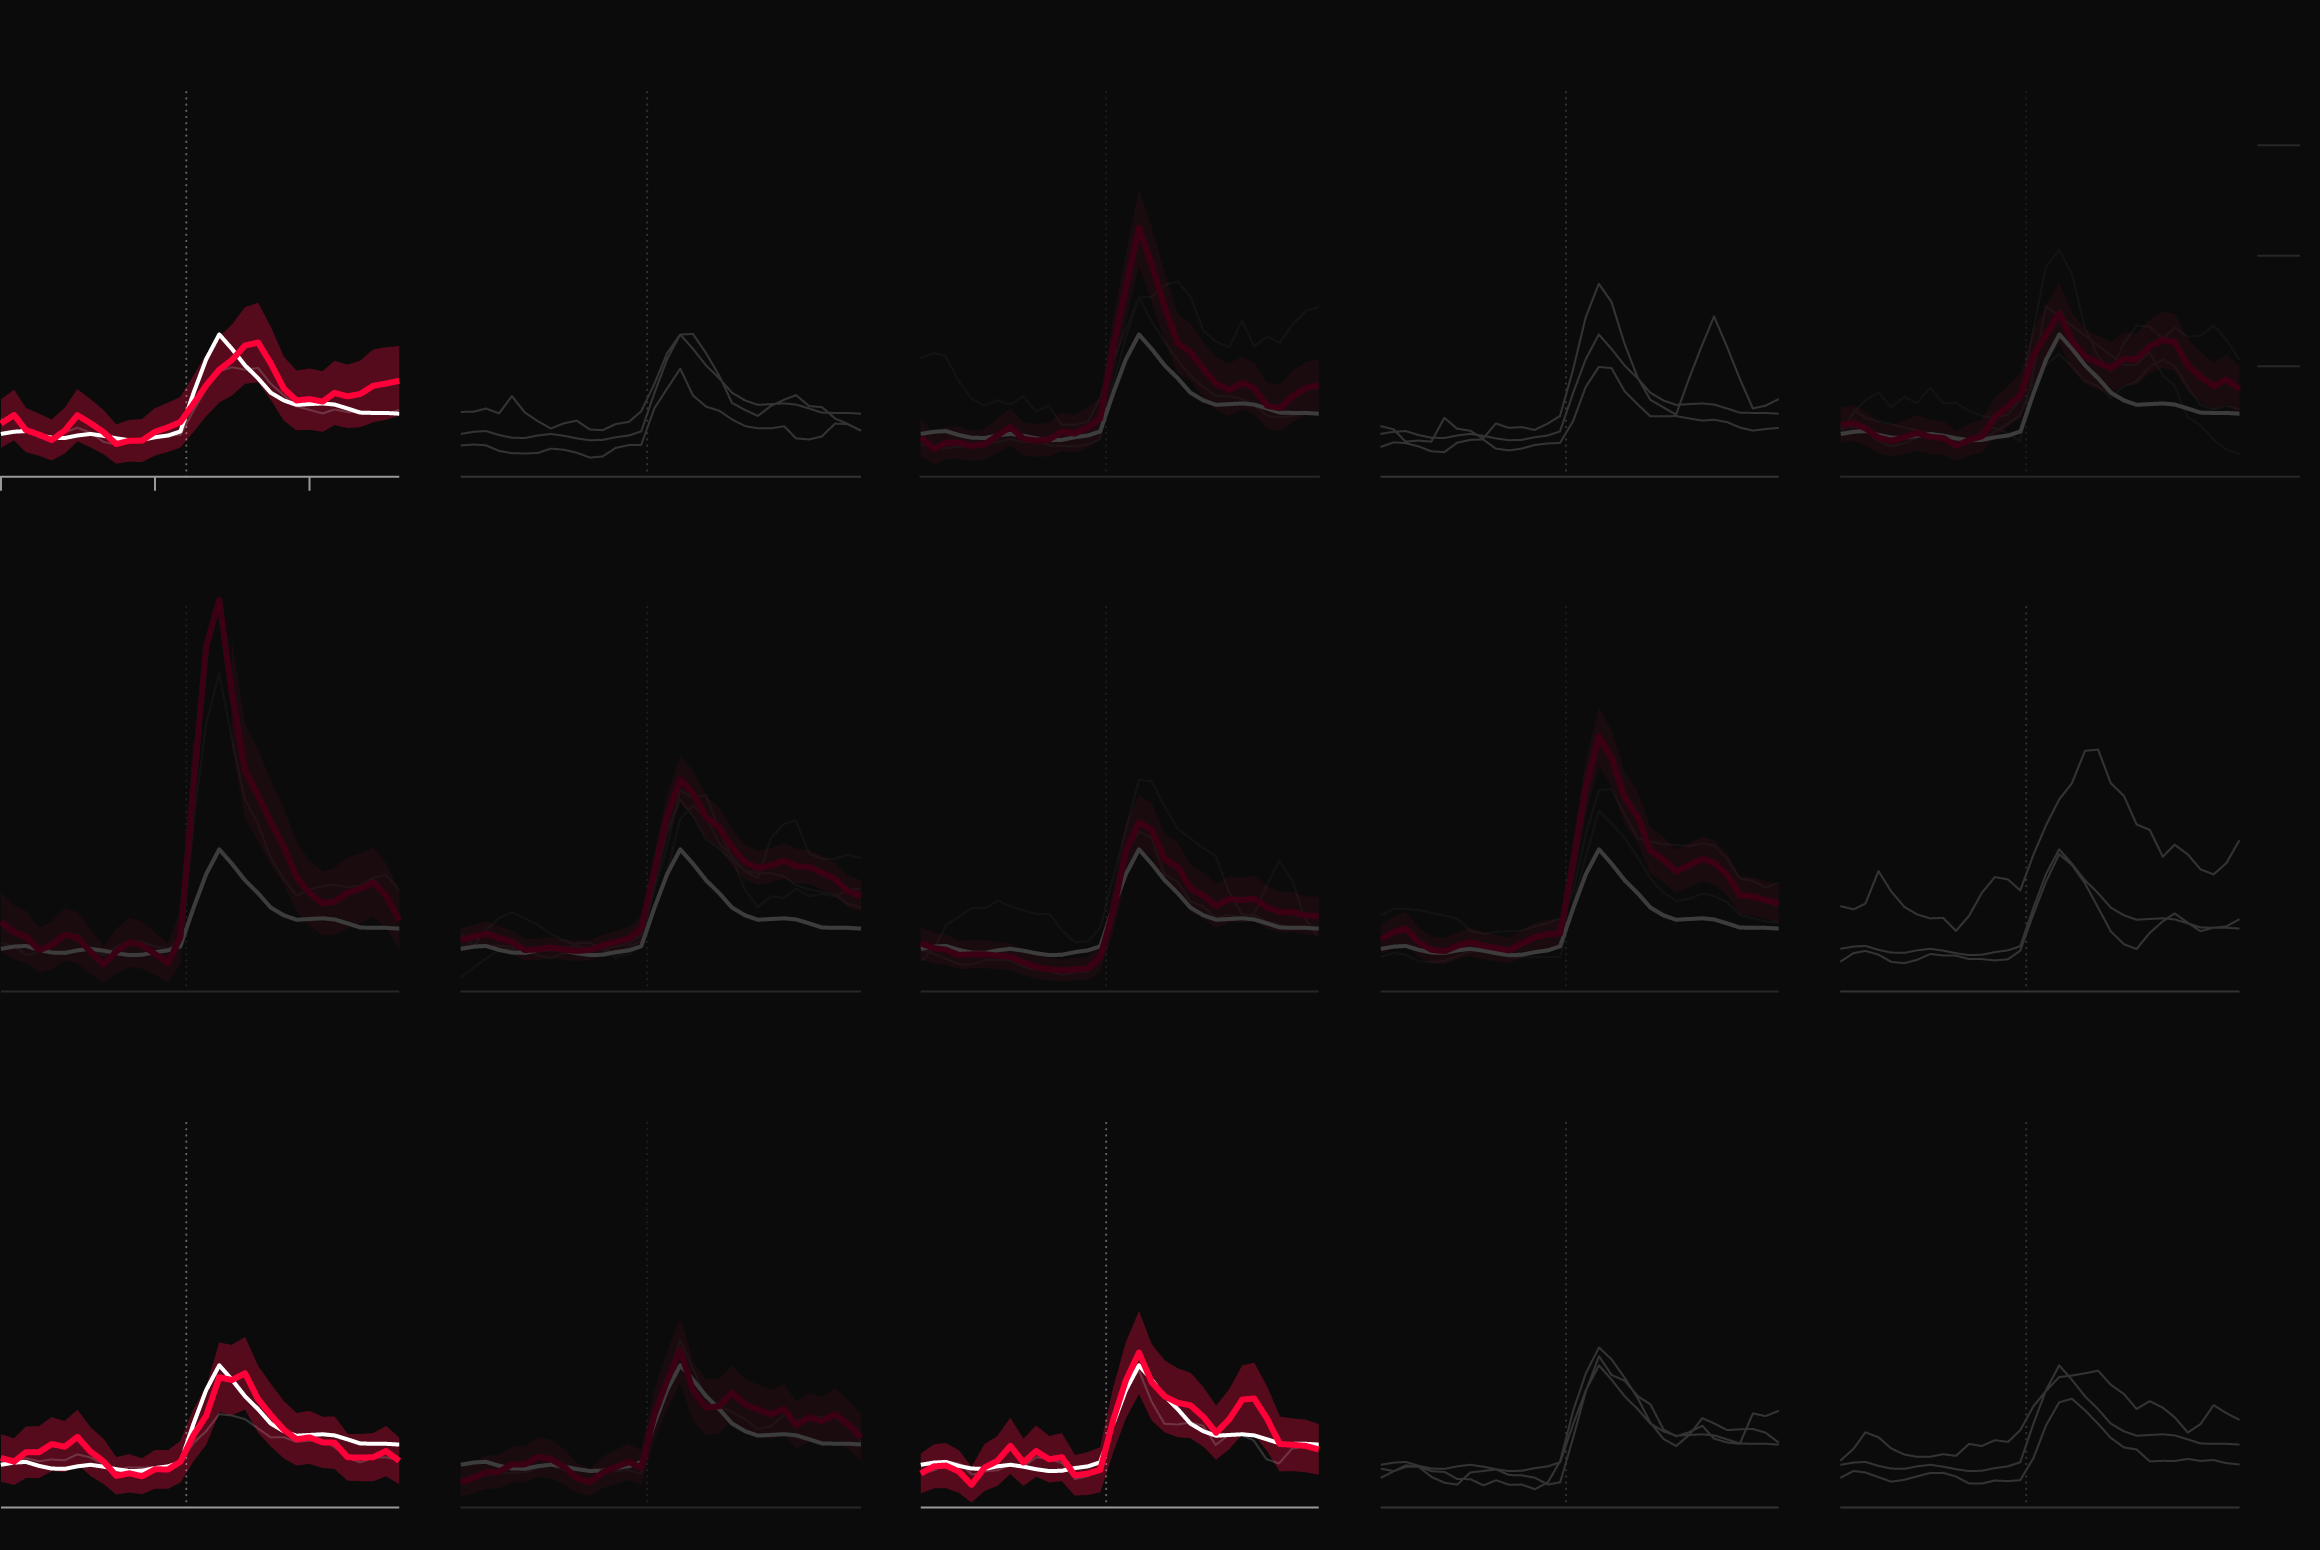
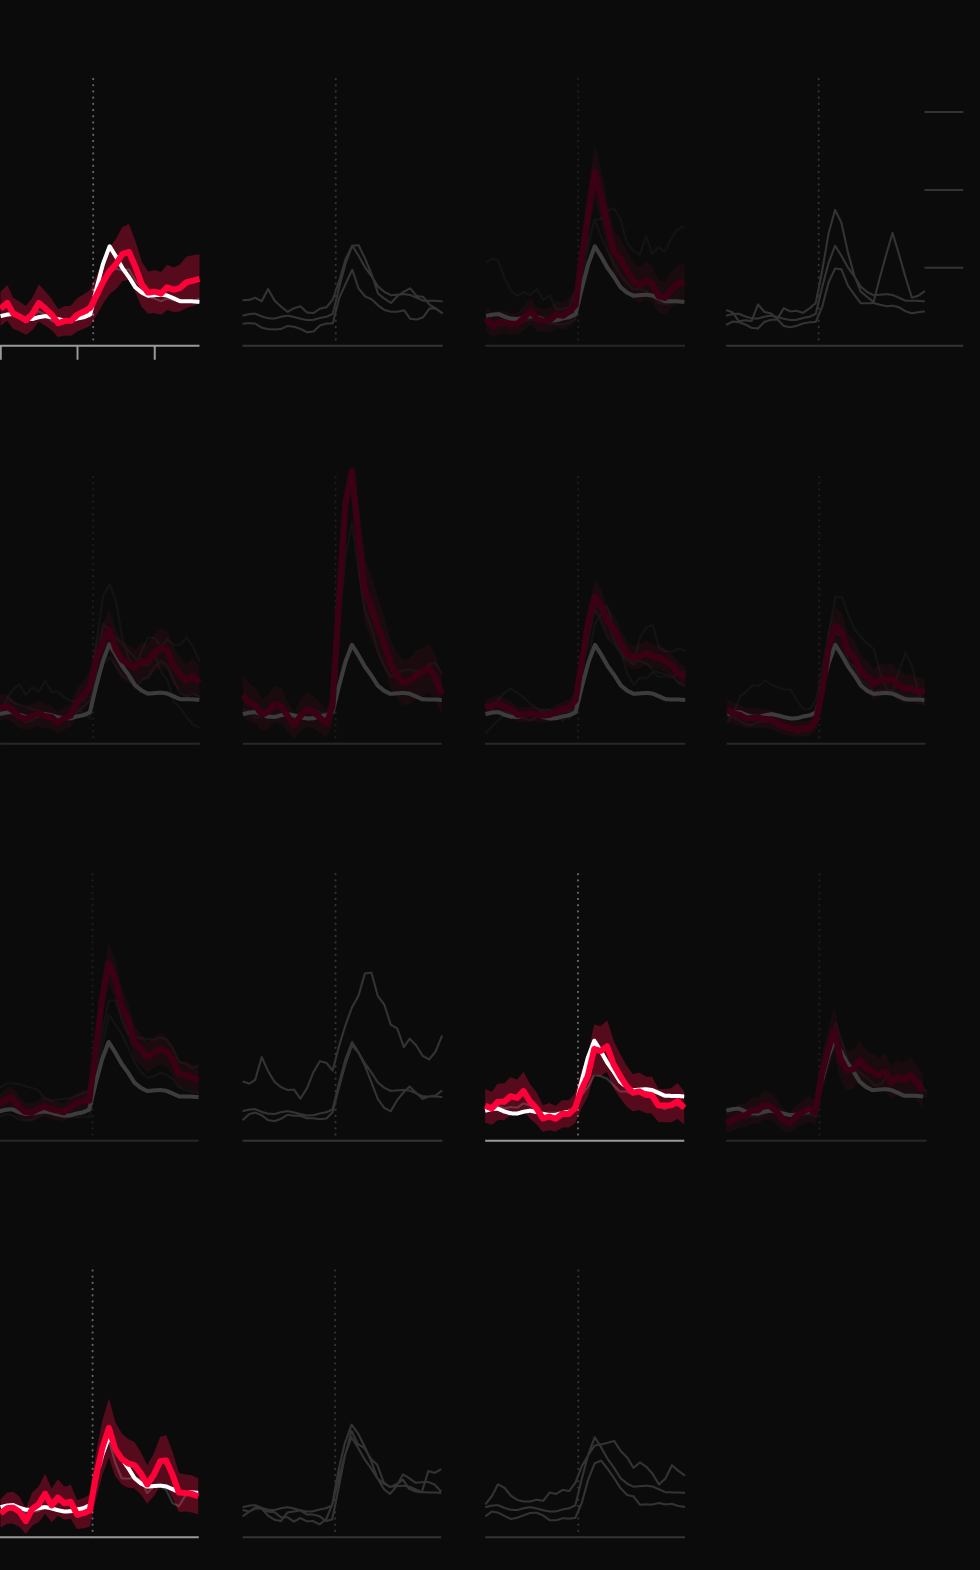
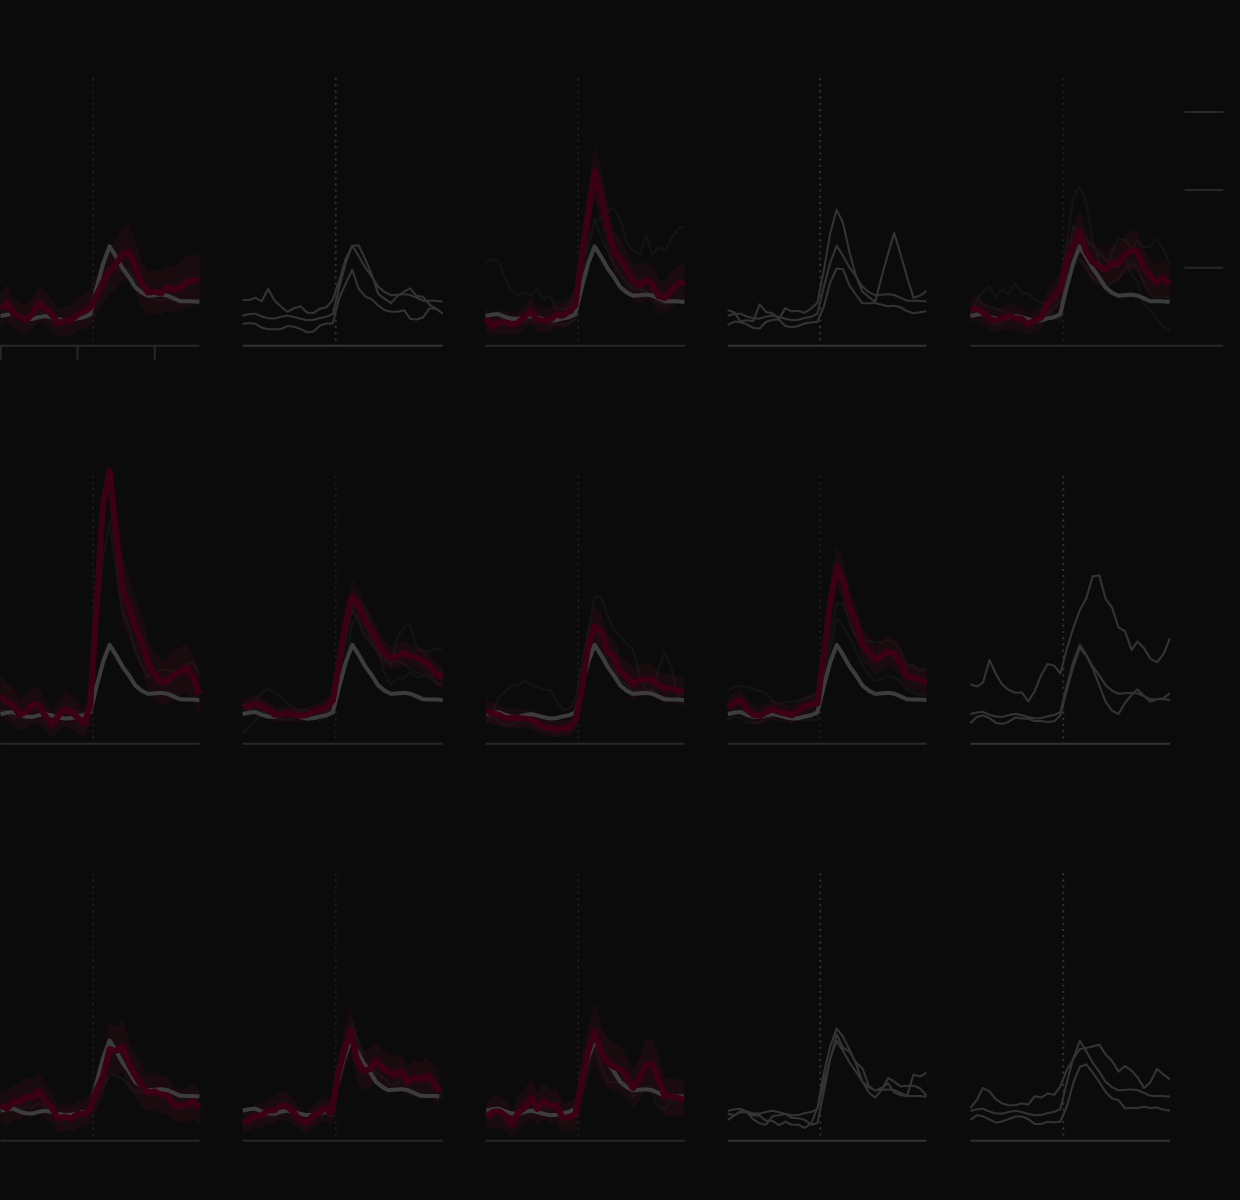
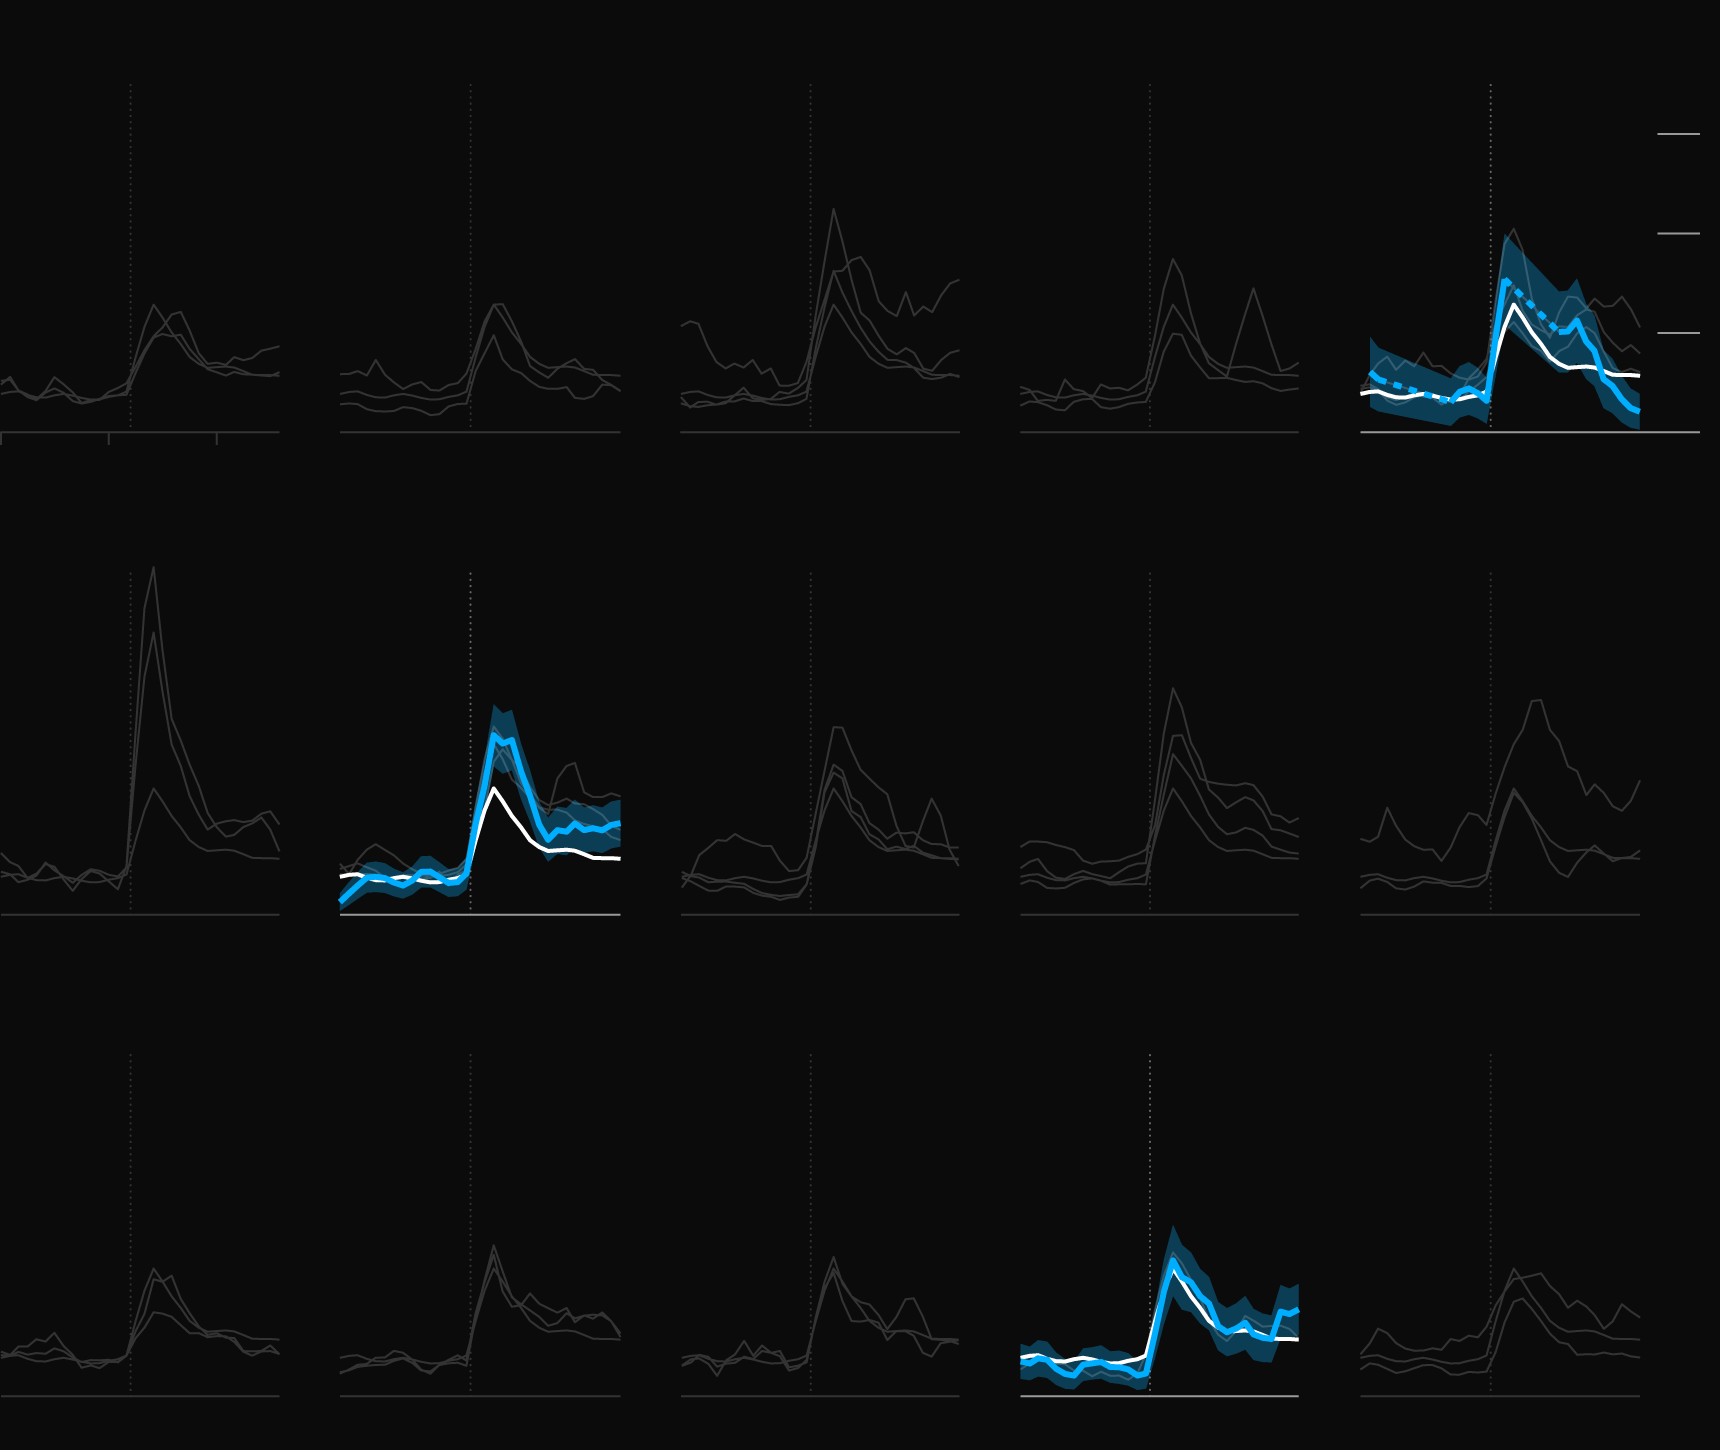
Double-Digit Black Joblessness
The recovery has lagged most among Black communities. The Black unemployment rate in Chicago hit 15% in the three months through August, the highest of any group being tracked, even though the city was flooded with Paycheck Protection Program loans.
Note: The temporary spike in Dallas appears to be due to fluctuations in the underlying survey sample size.
Philadelphia’s Existing Inequities
In Philadelphia, unemployment has disproportionately affected Black residents during the pandemic, according to Jamie Jelly Murtha, director of research and data at Philadelphia Works, Inc., the city’s workforce development board. Neighborhoods with less labor-force participation, lower education levels, more poverty and higher concentrations of non-White residents filed initial unemployment claims during the Covid-19 crisis at significantly higher rates, according to the organization.
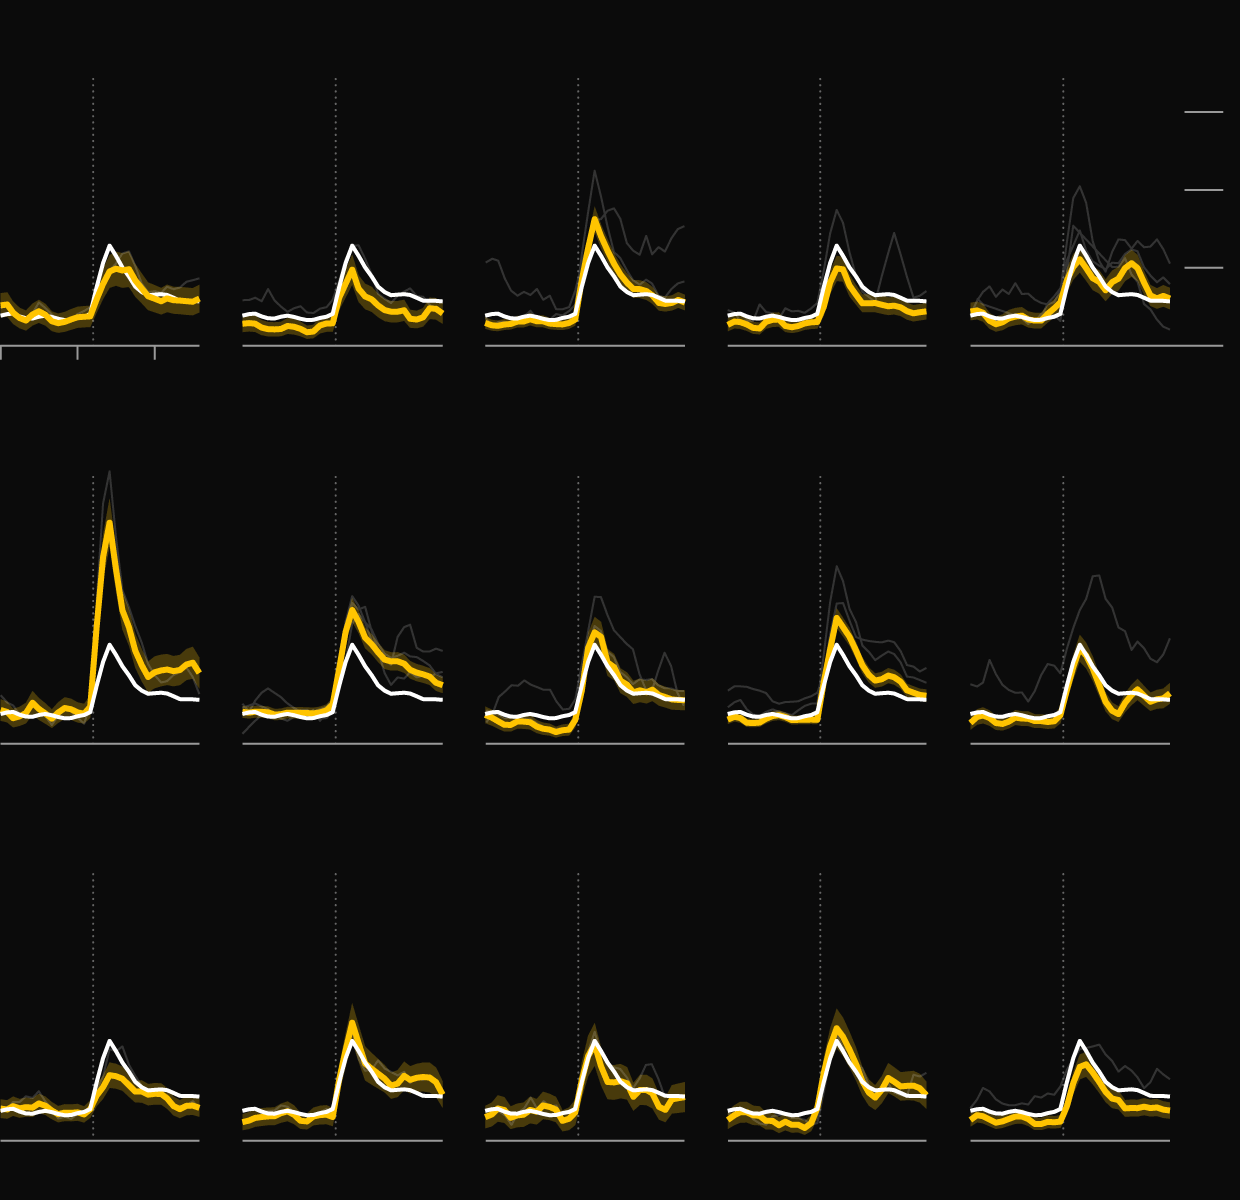
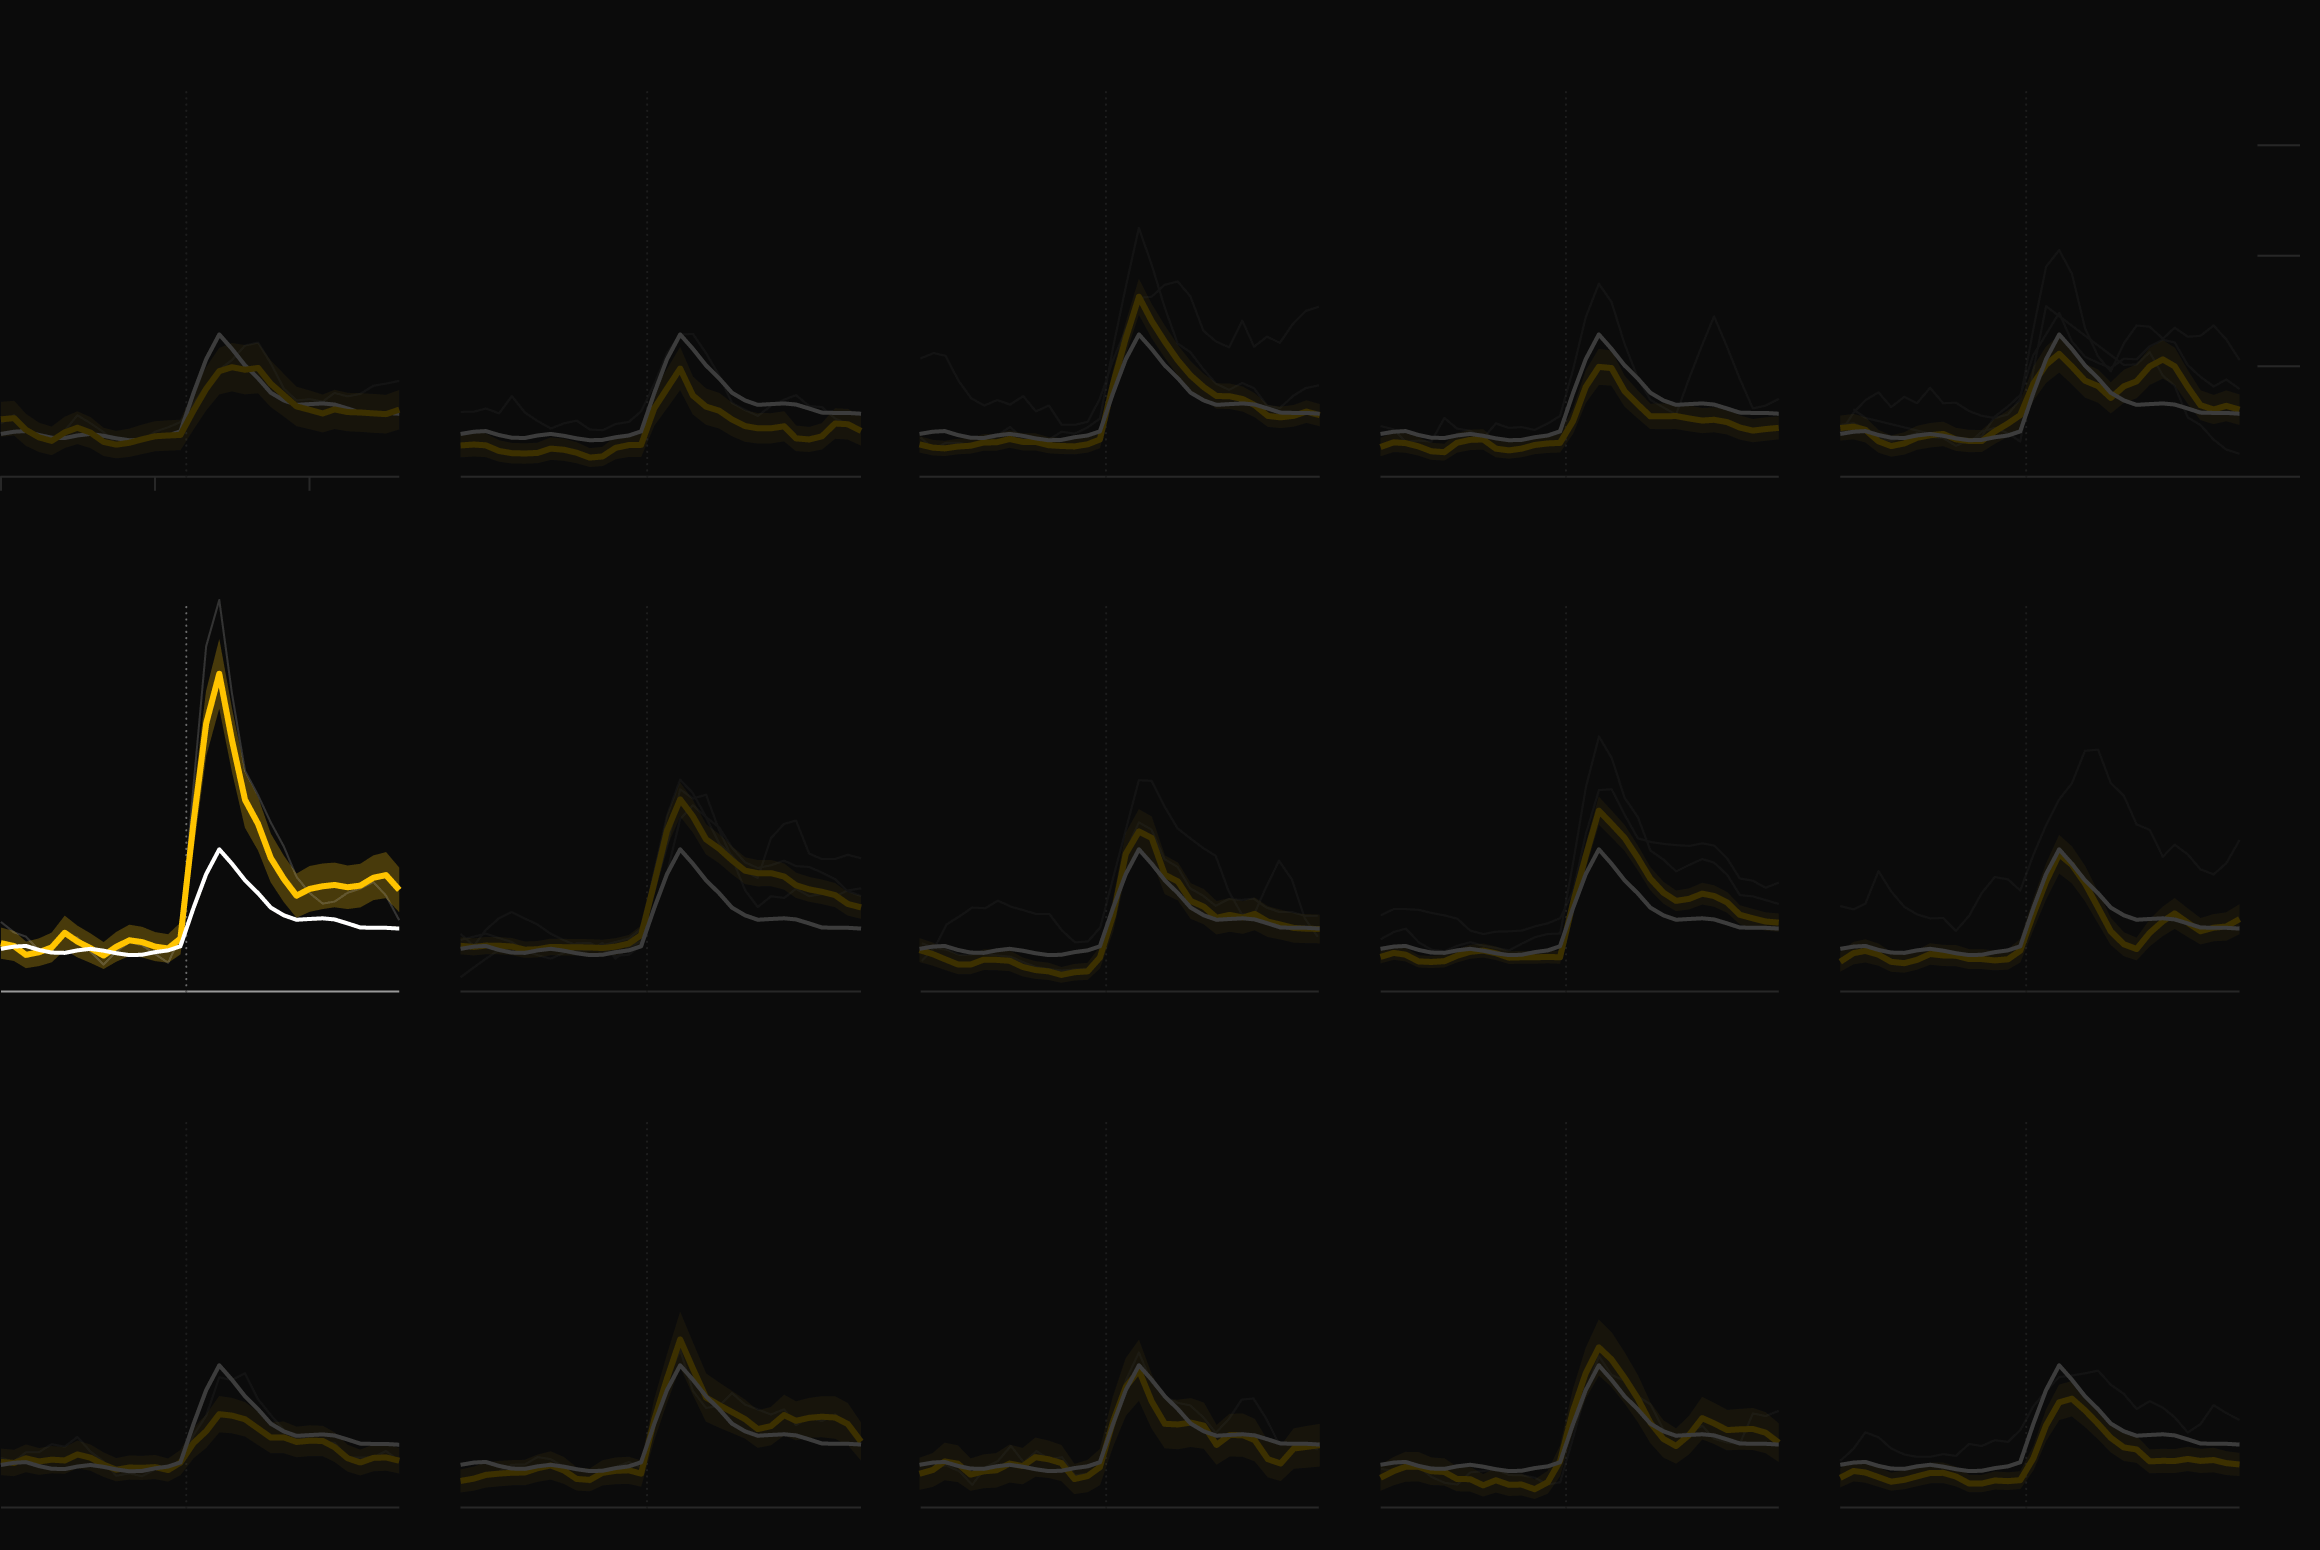
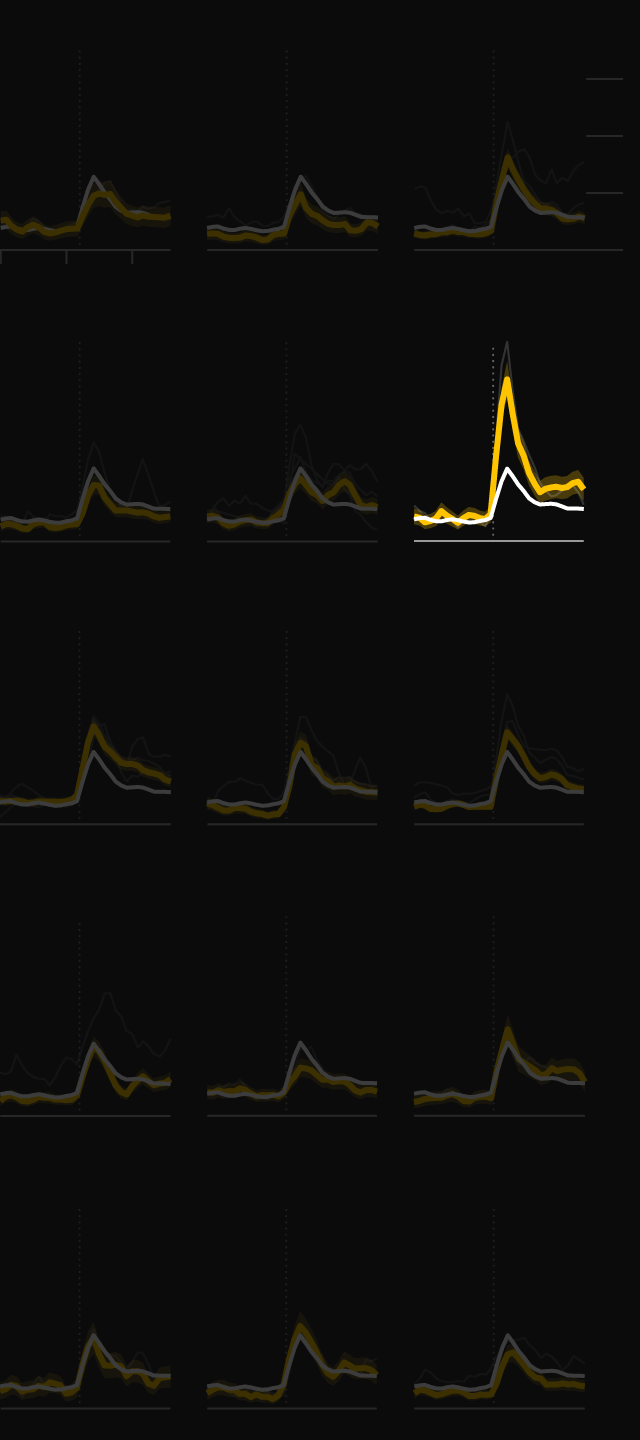
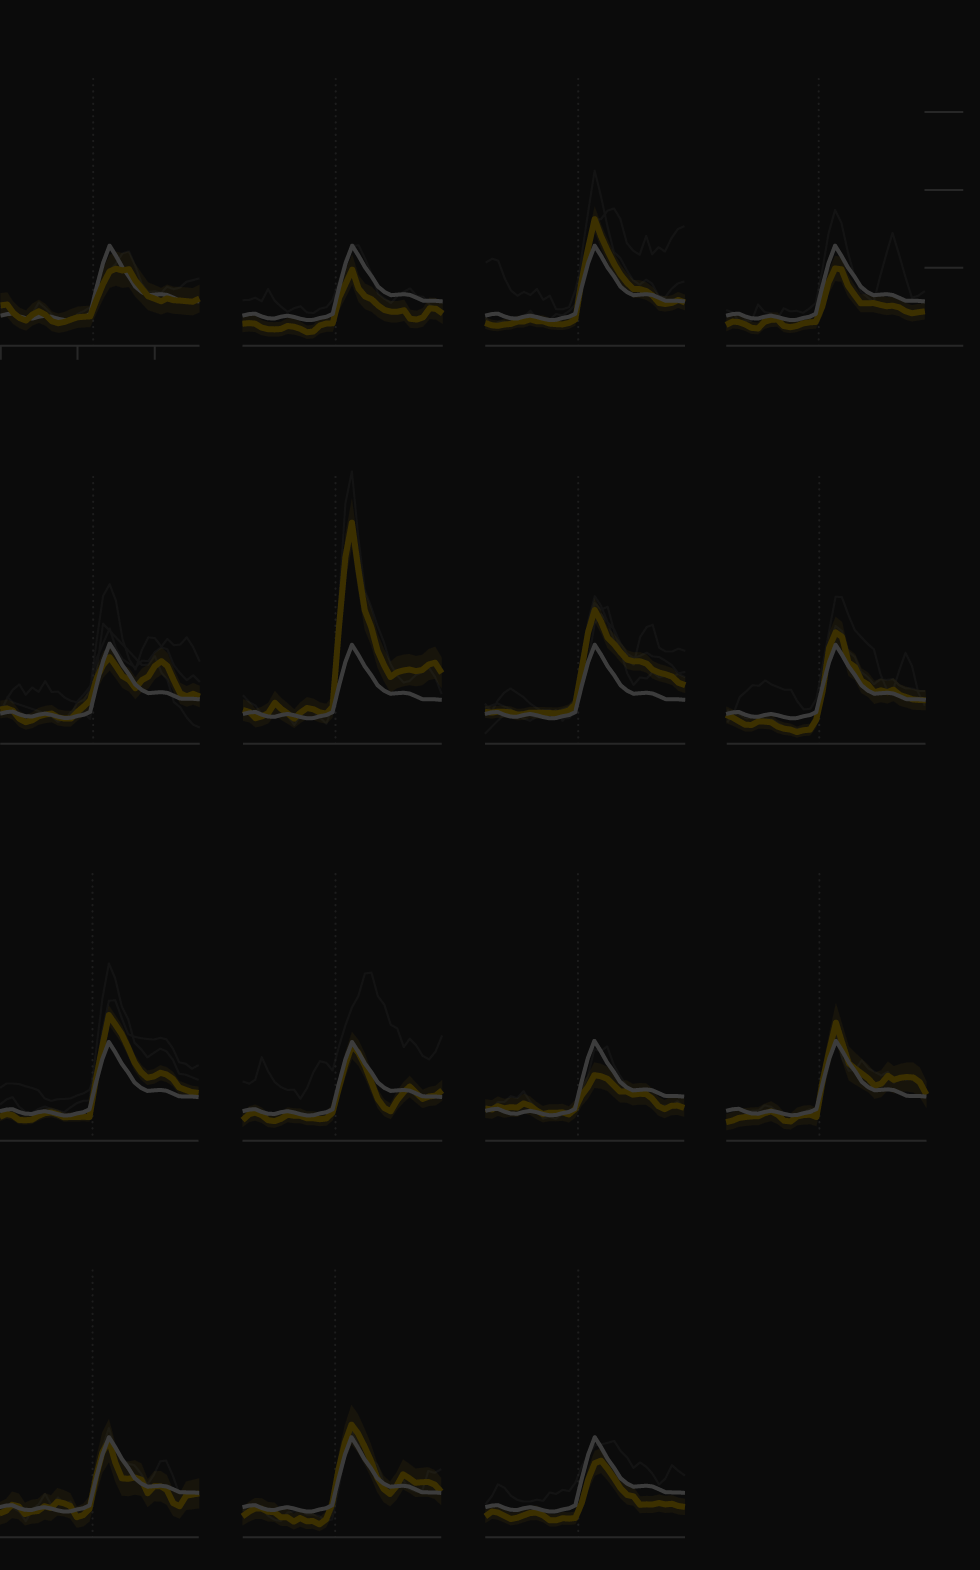
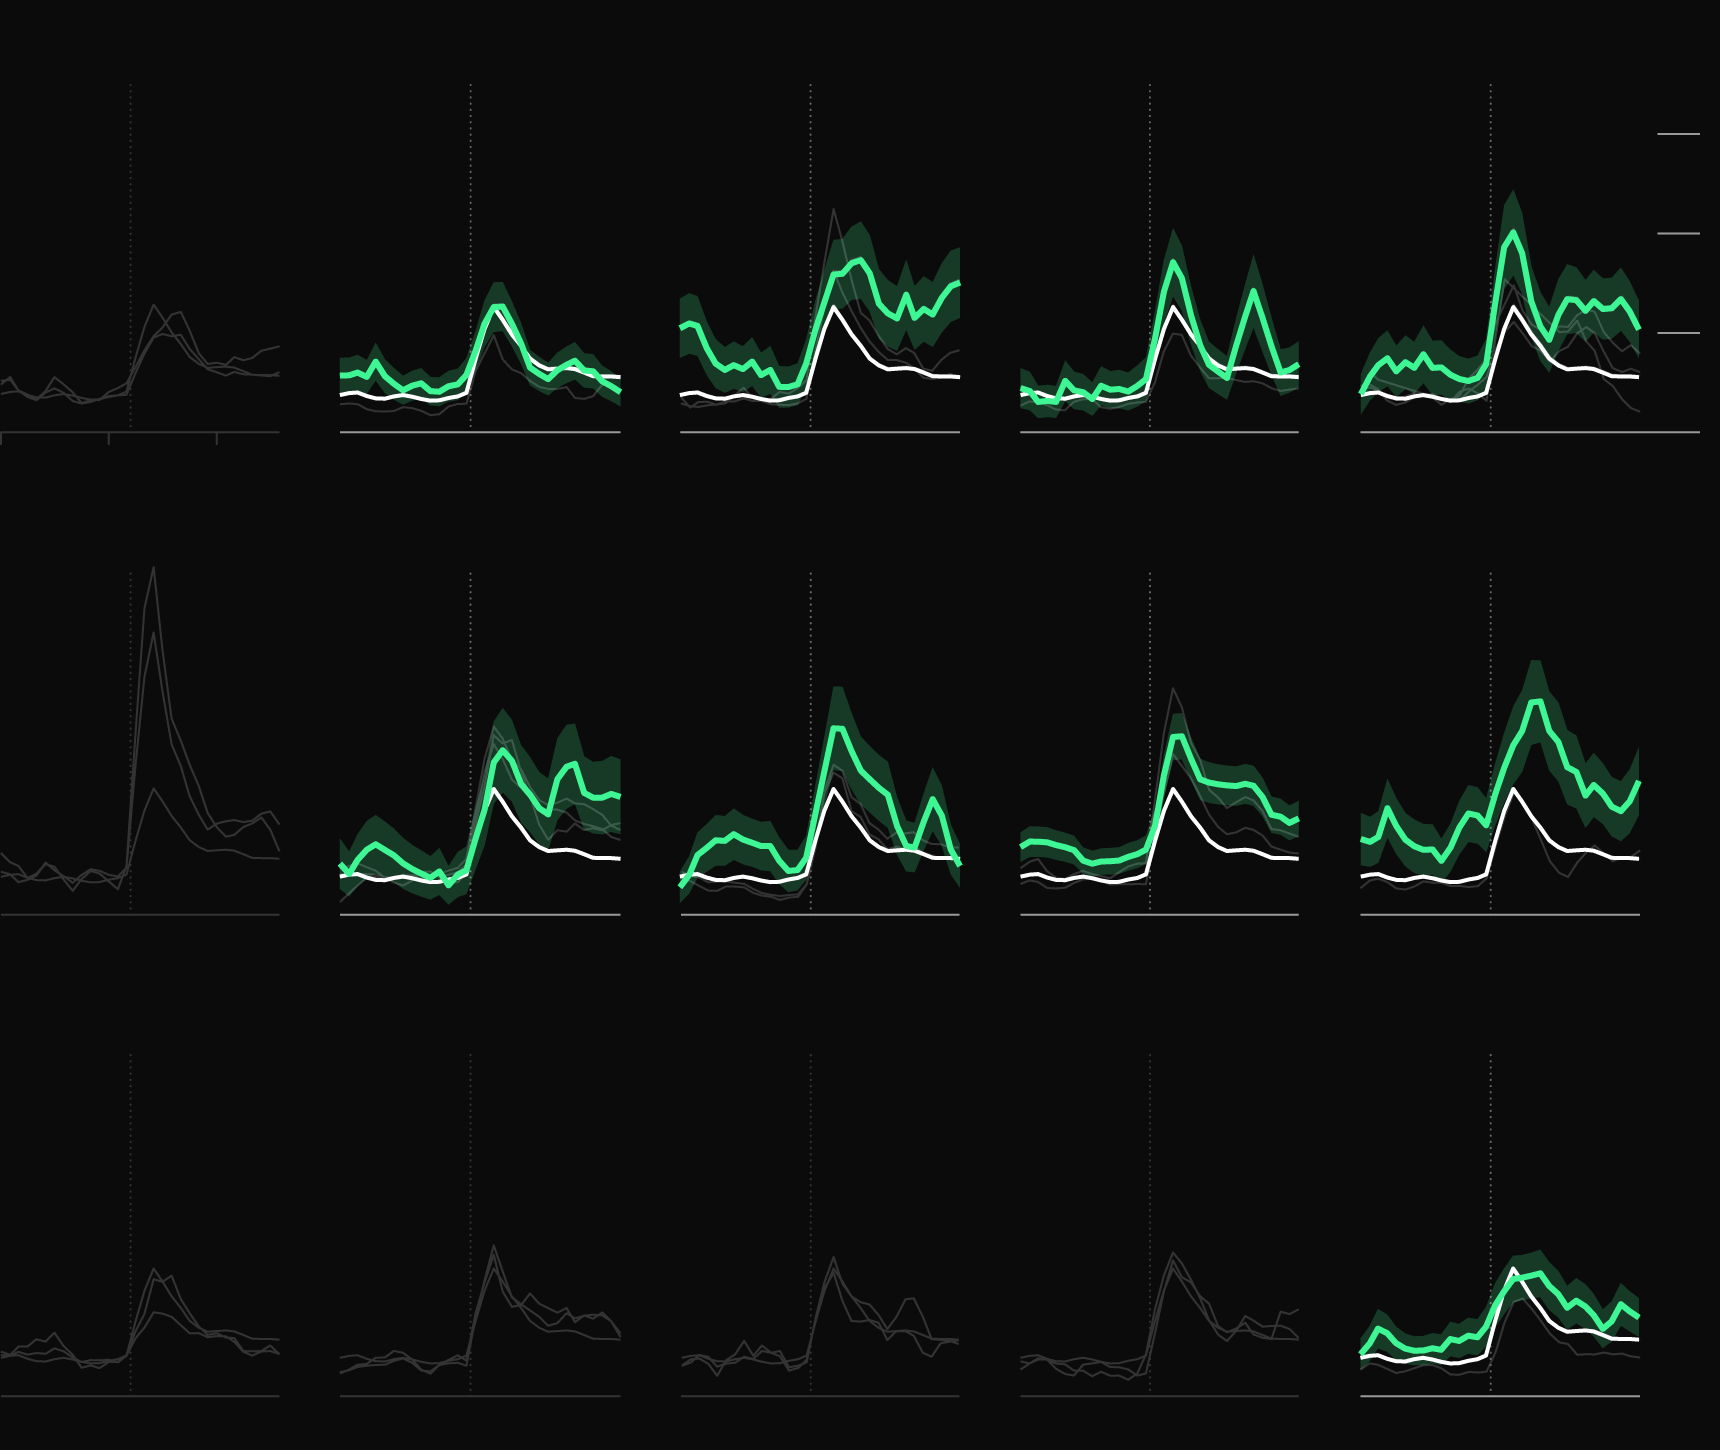
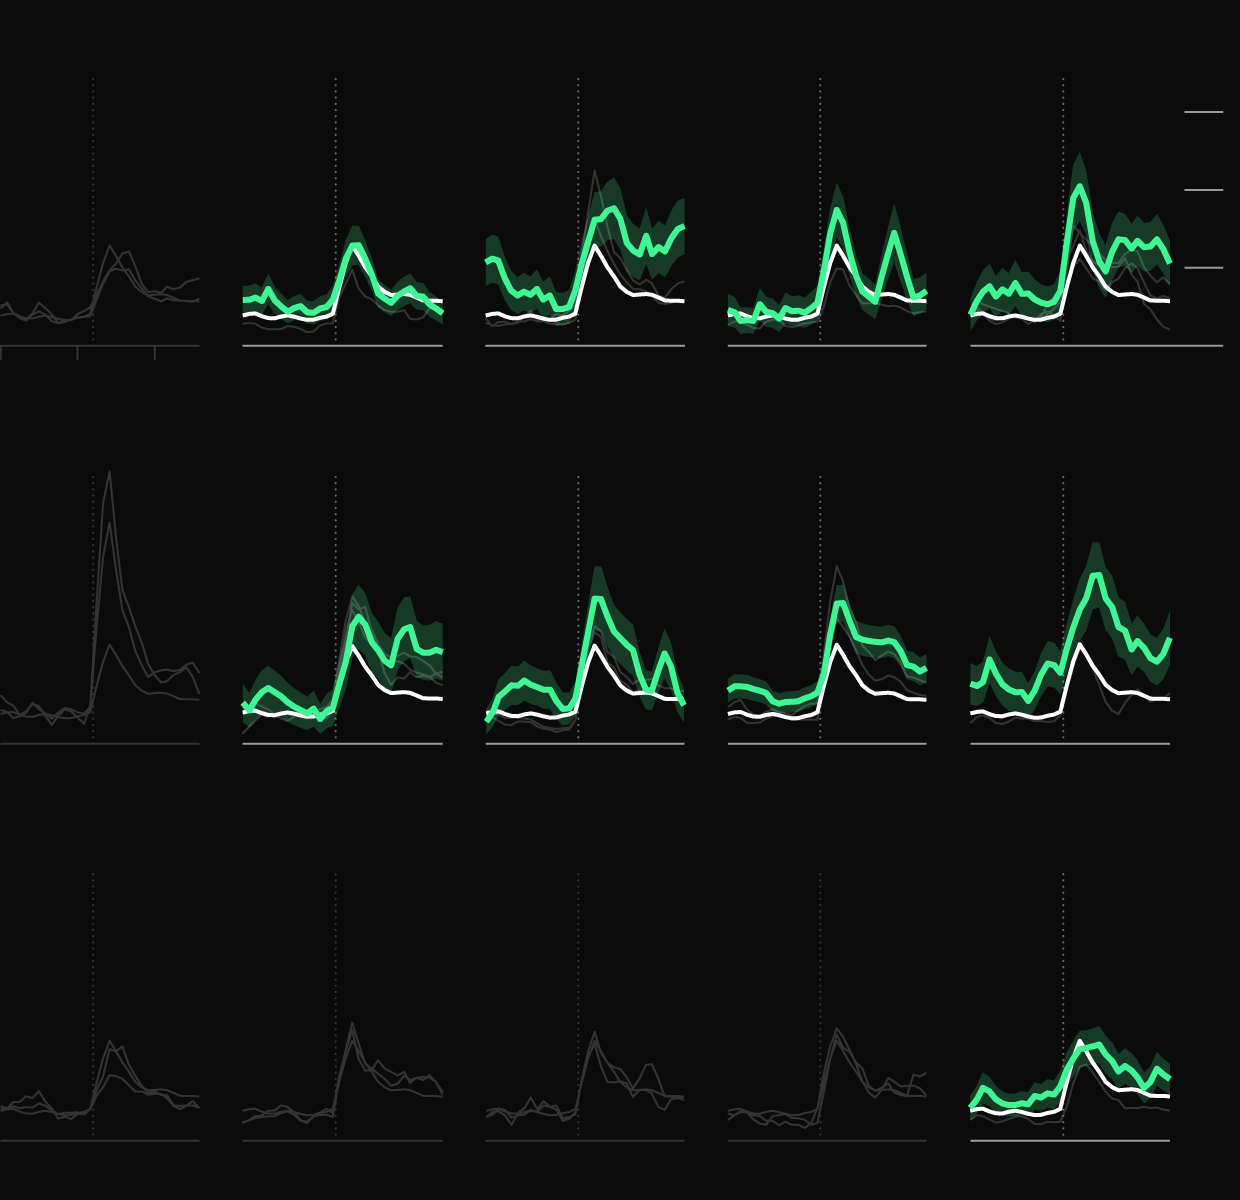
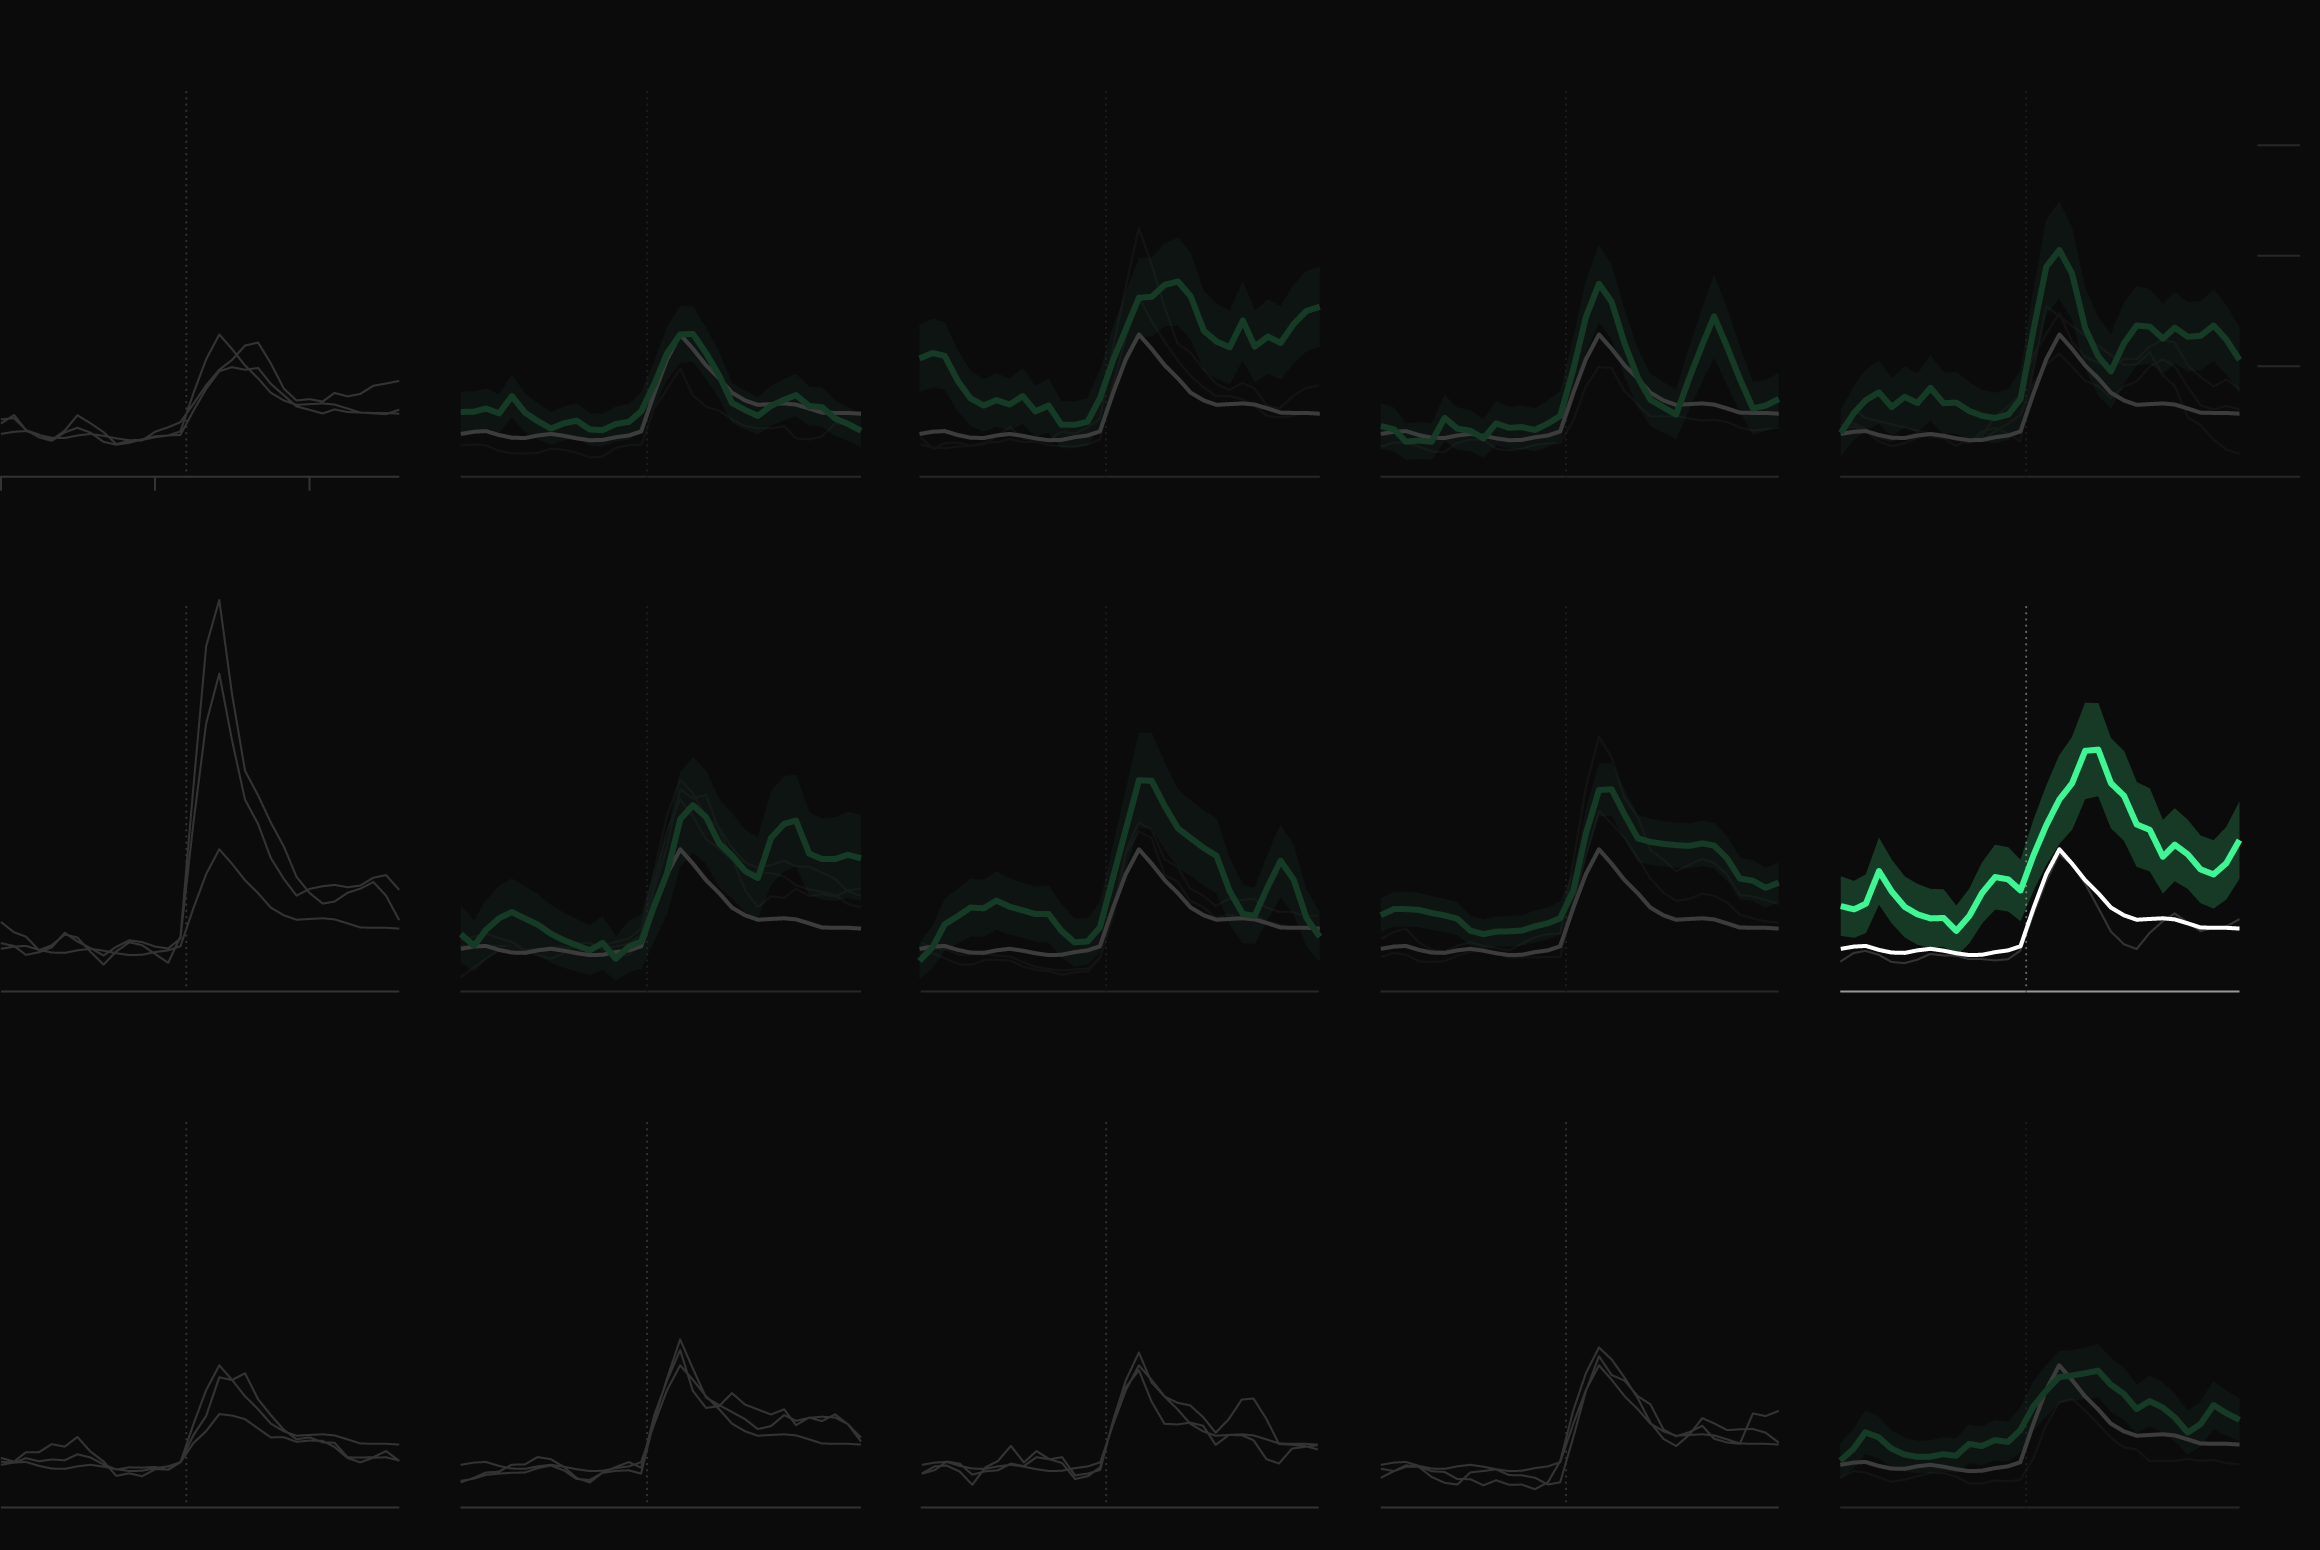
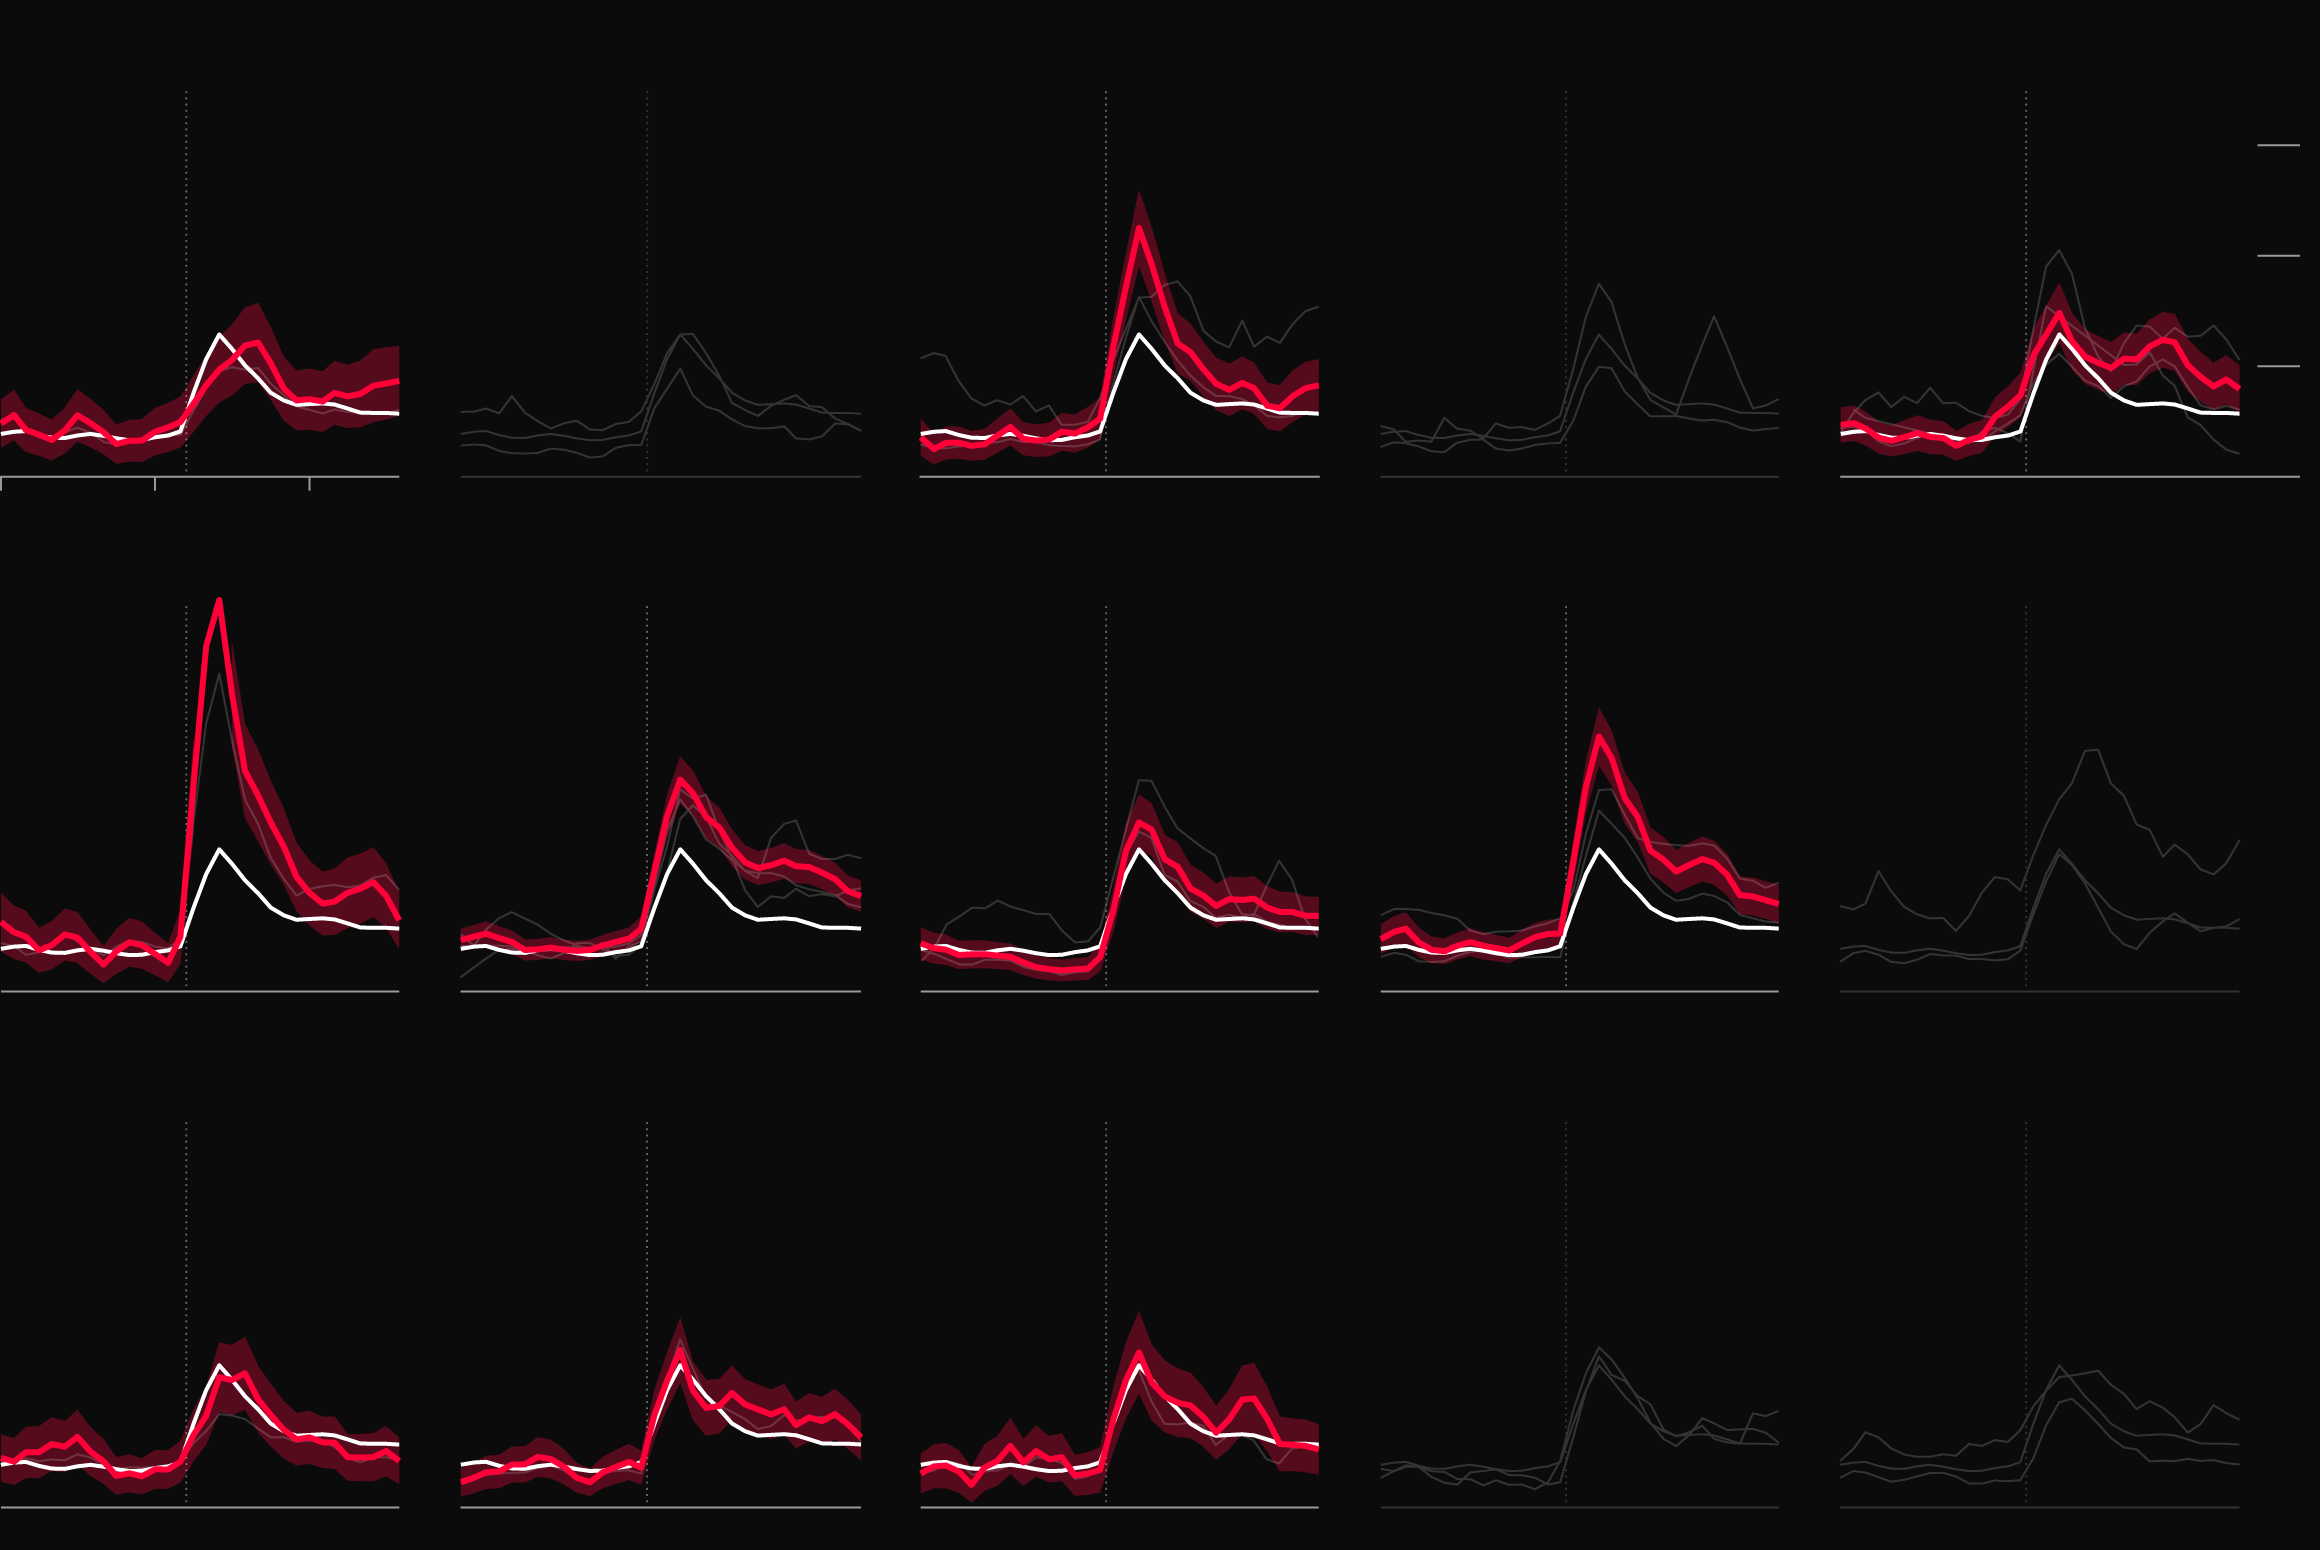
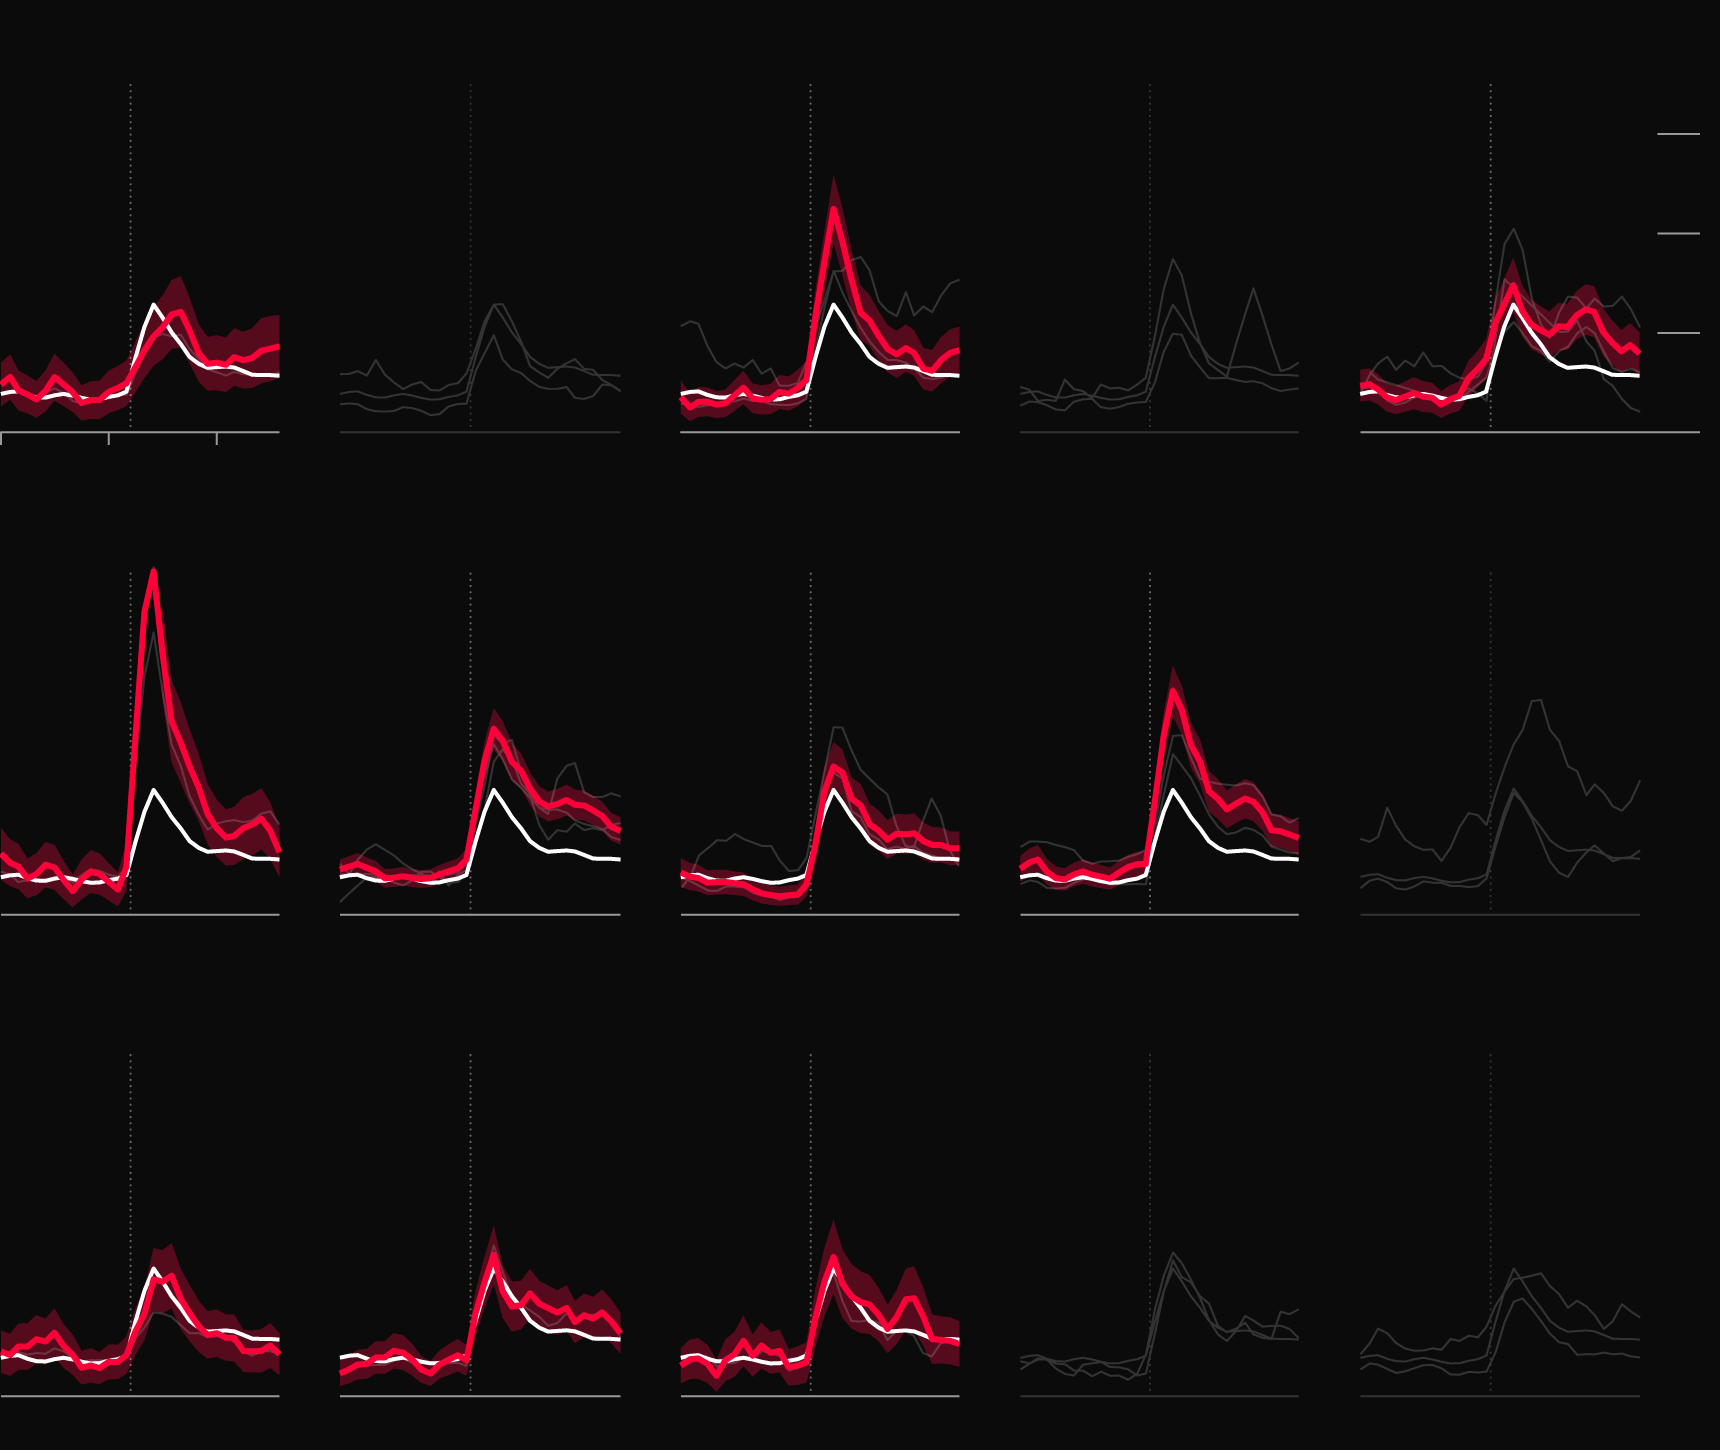
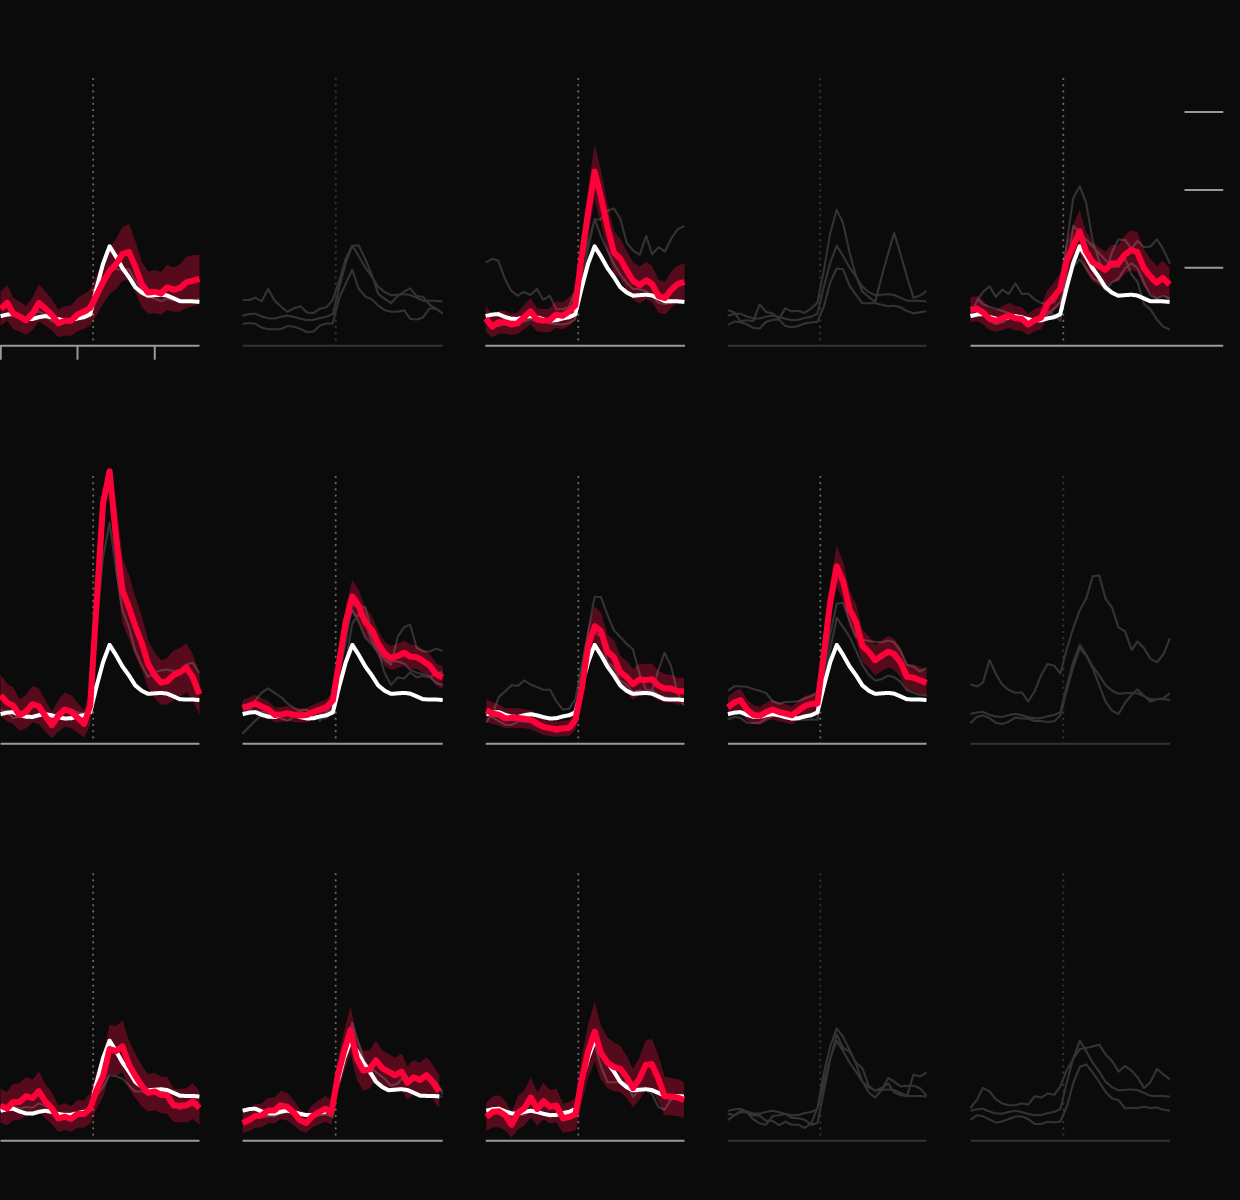
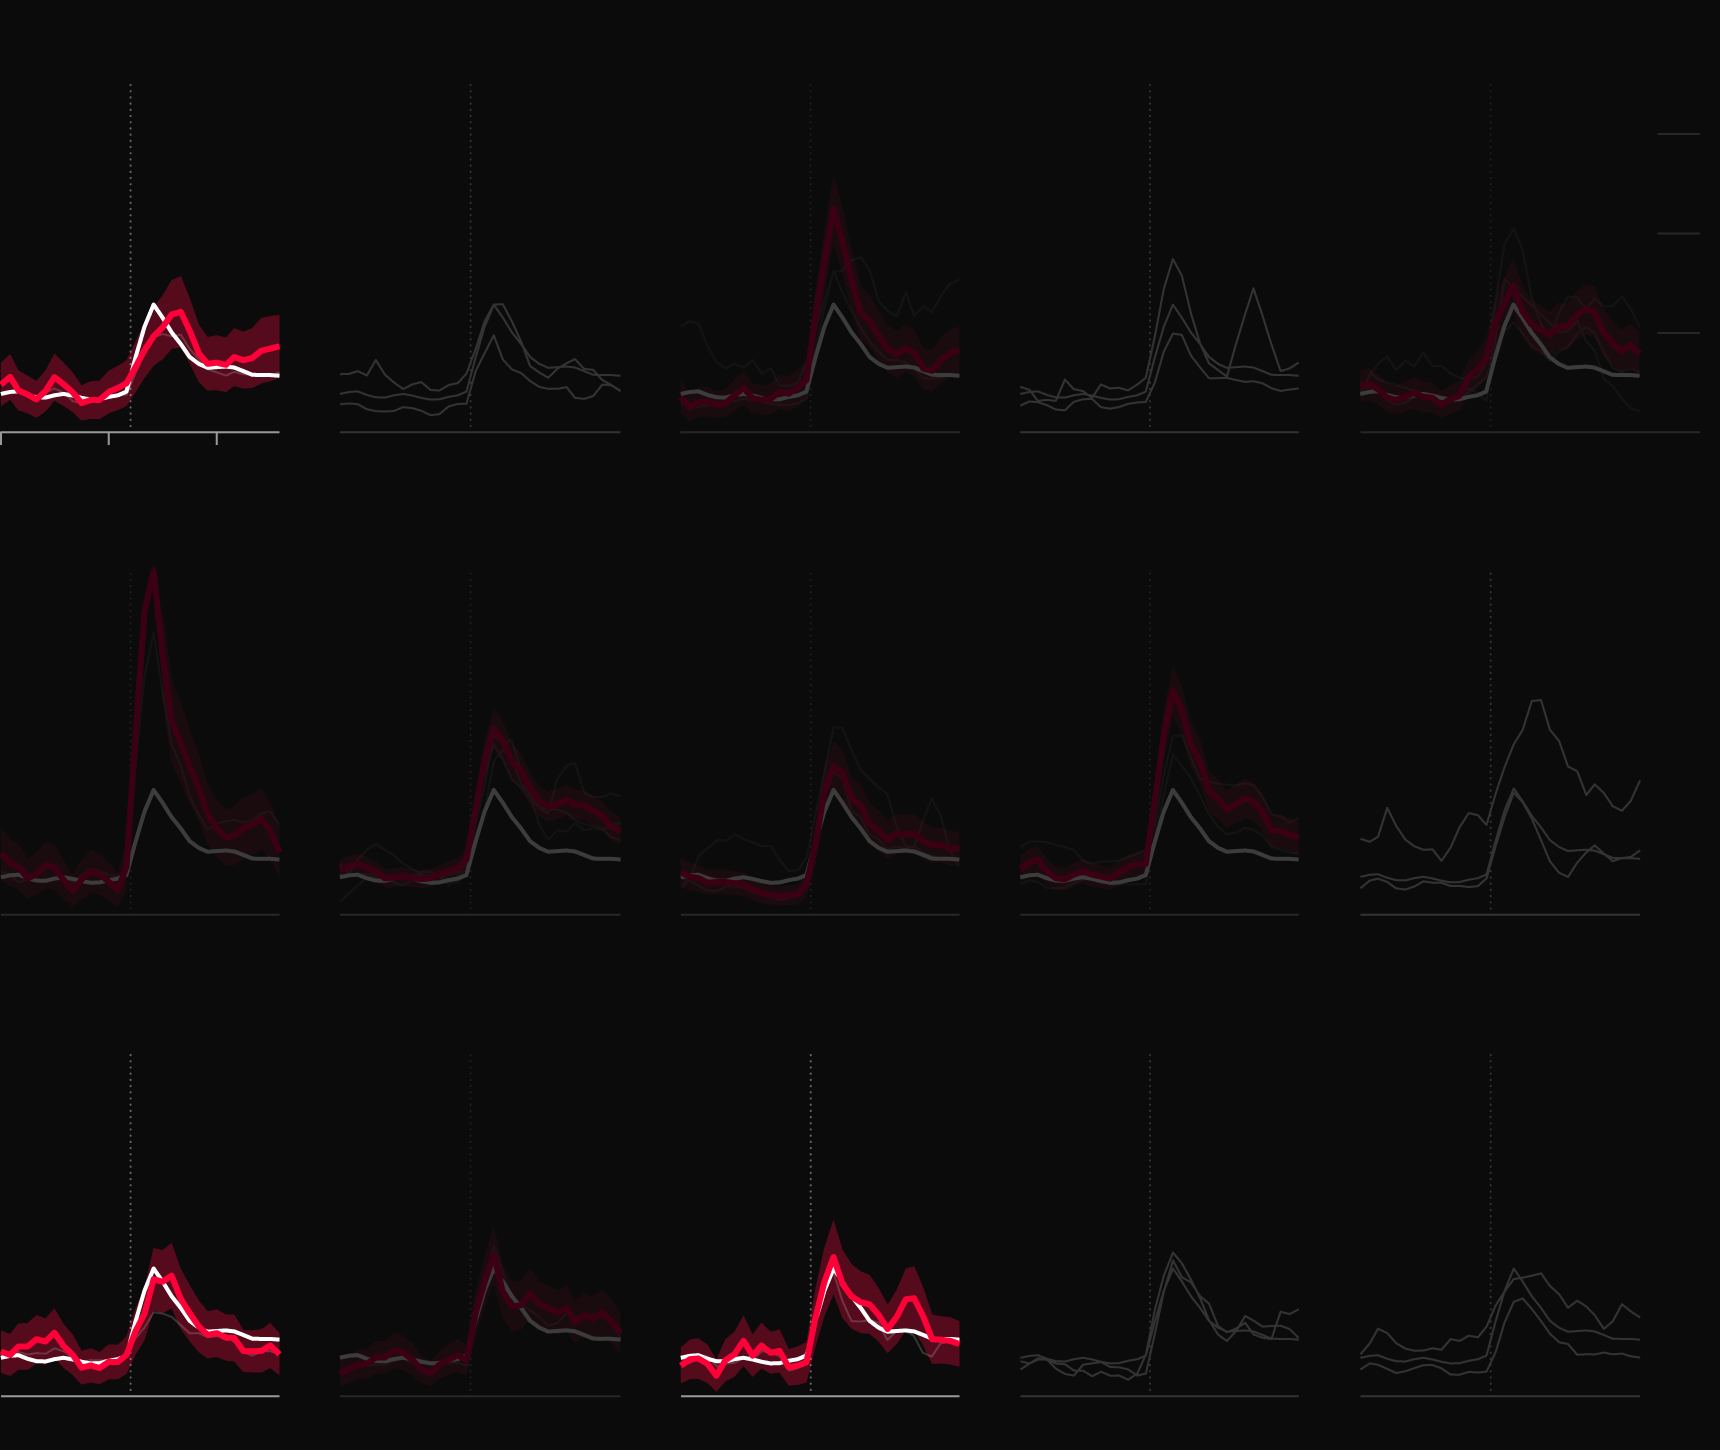
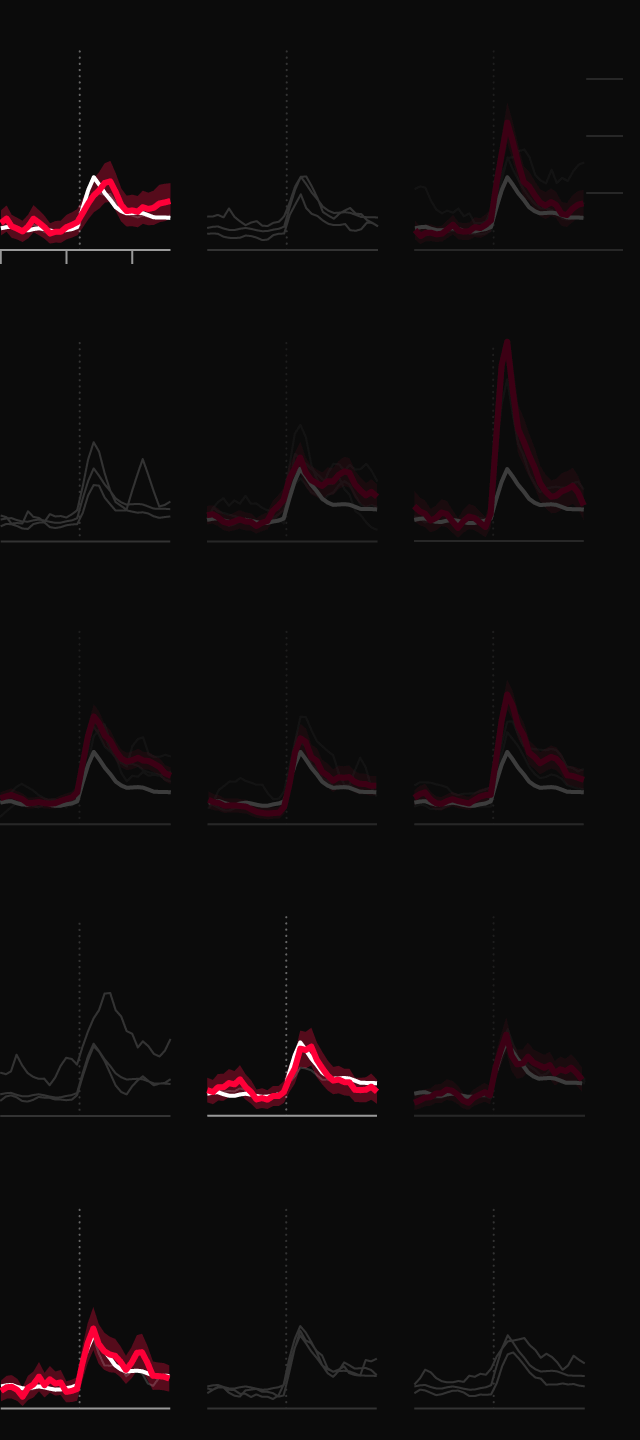
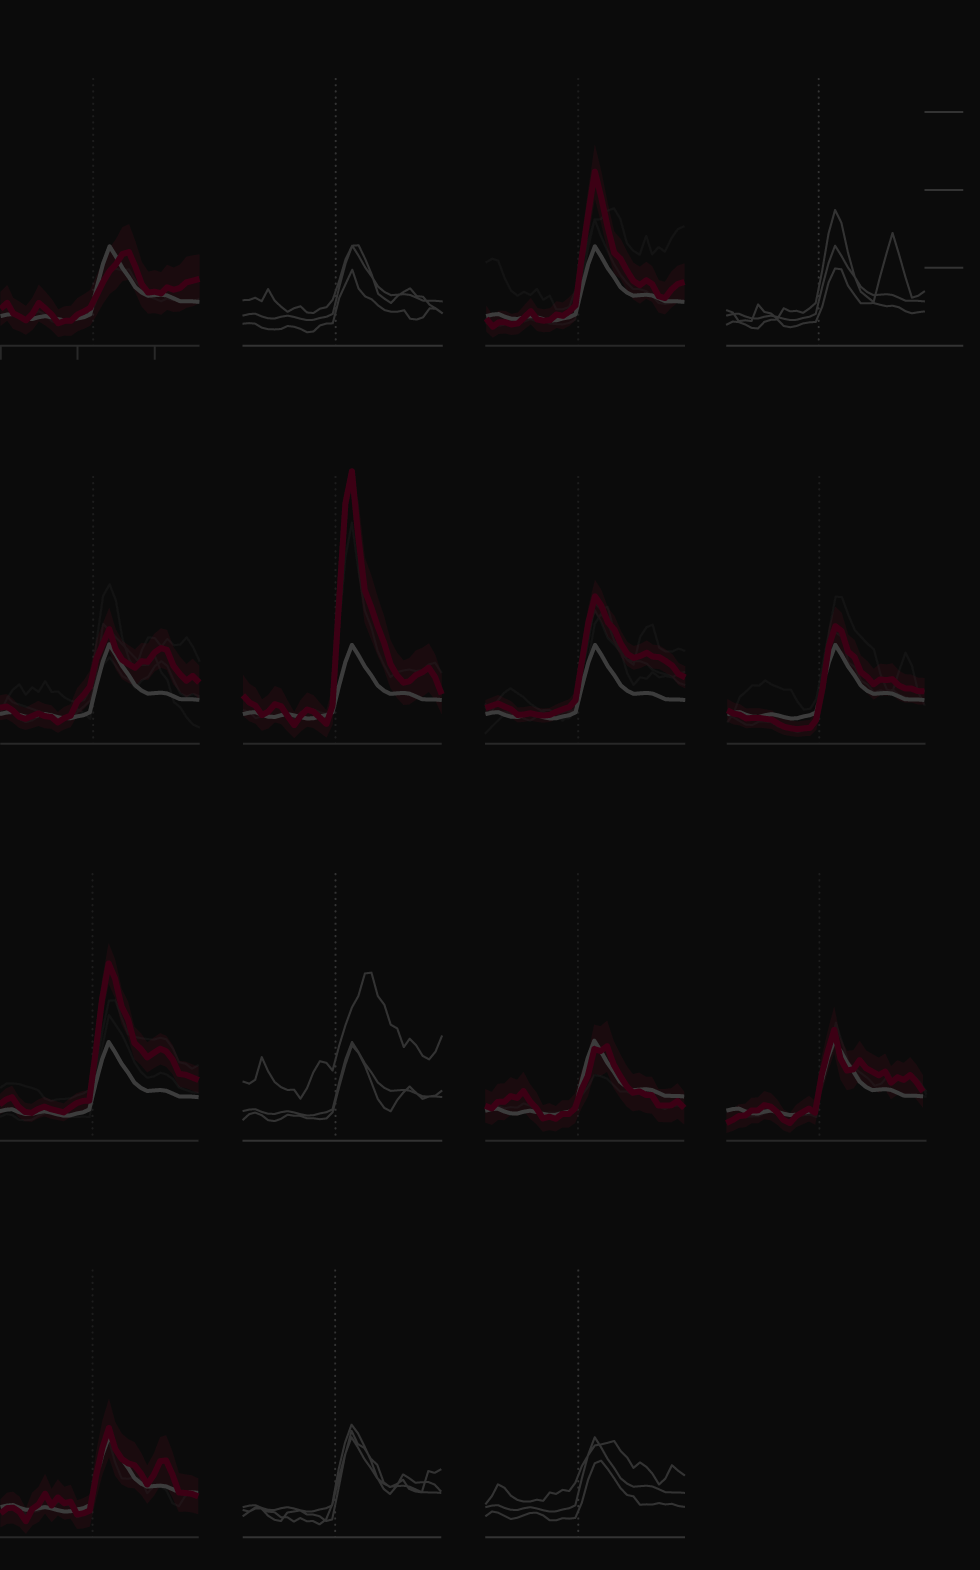
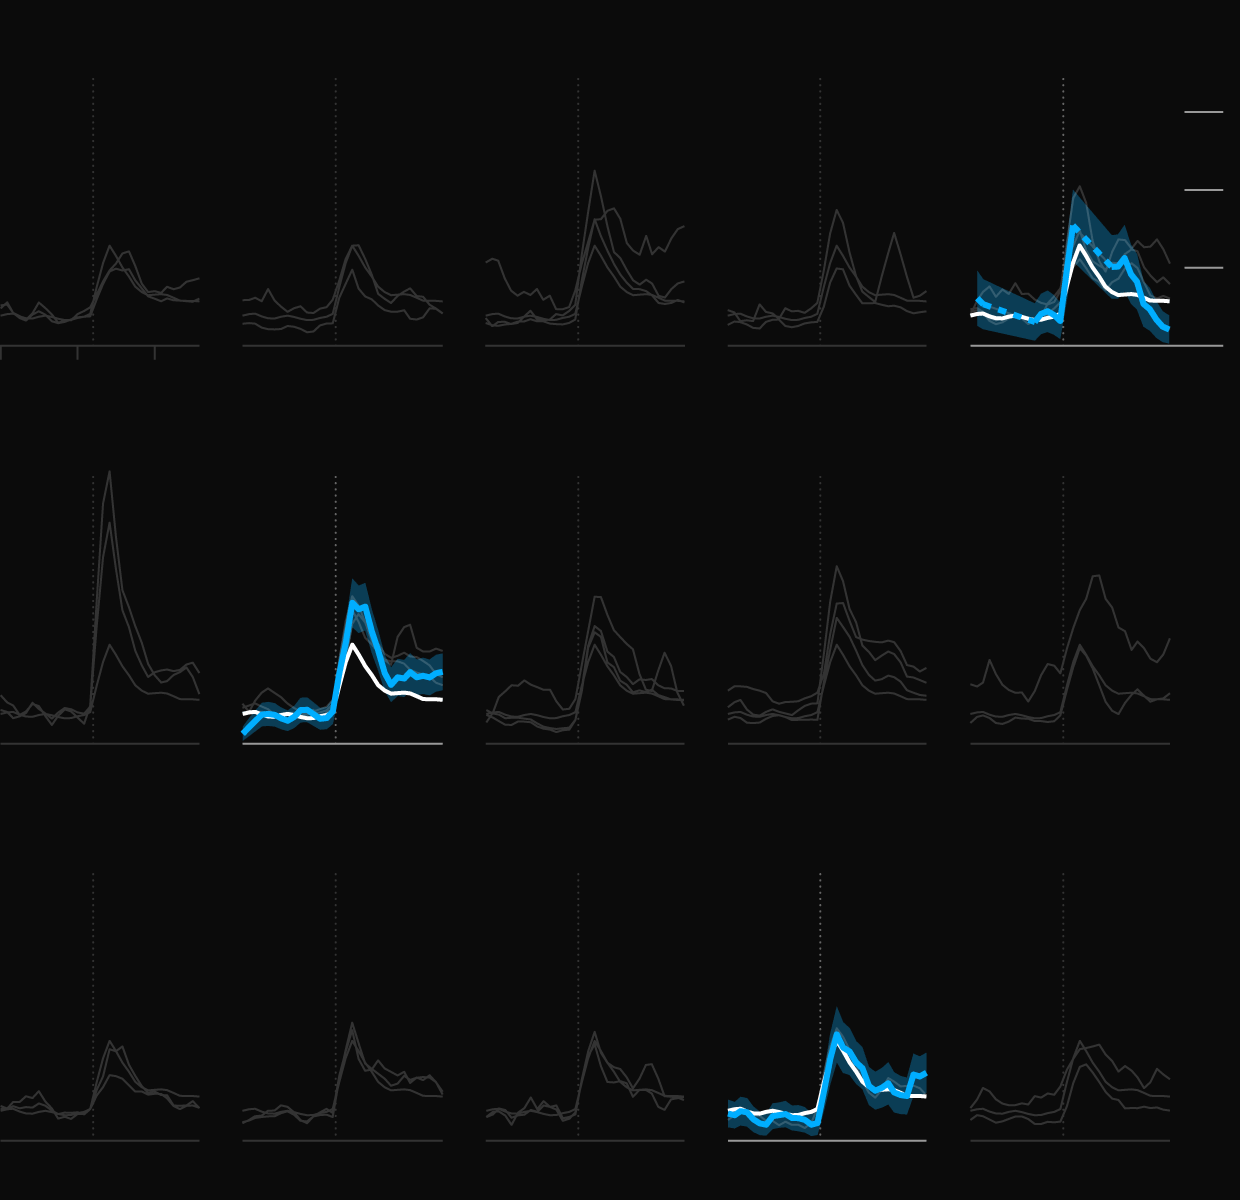
Hispanic Rates Down From Record Highs
Hispanic communities in Chicago, Las Vegas and New York City faced some of the worst unemployment rates at the peak of the crisis, but have seen relatively strong recoveries since then. The tightest labor markets are in fast-growing cities in the Southwest.
Southwest Cities Diverge
Phoenix’s and San Antonio’s broad recoveries have been helped by recent population growth and improved economic diversity. It’s a different story in Albuquerque, where Hispanic workers are concentrated in low-wage industries and face limited opportunities for advancement, said Michael O’Donnell, acting director of The University of New Mexico’s Bureau of Business and Economic Research.
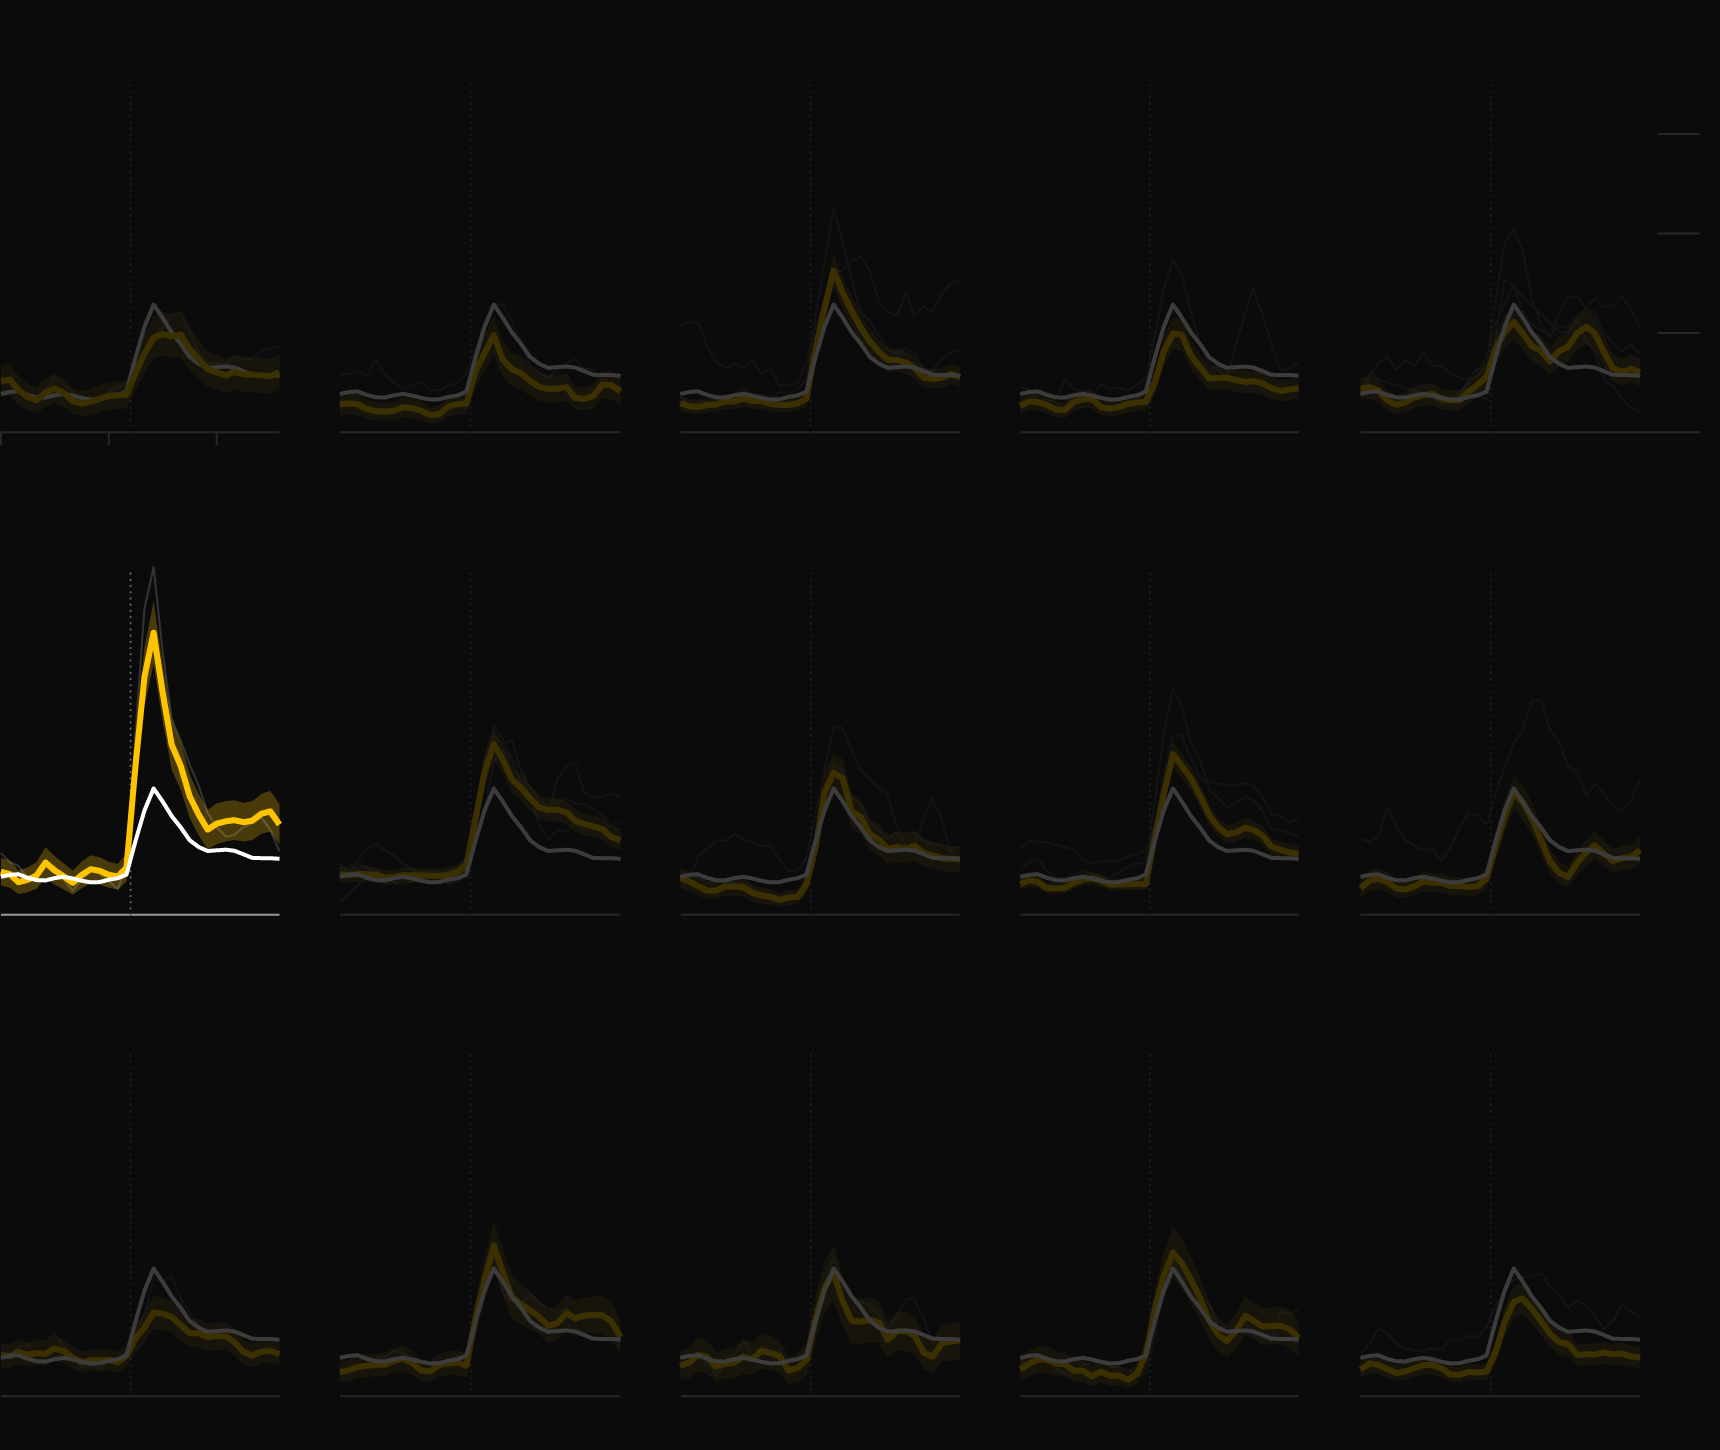
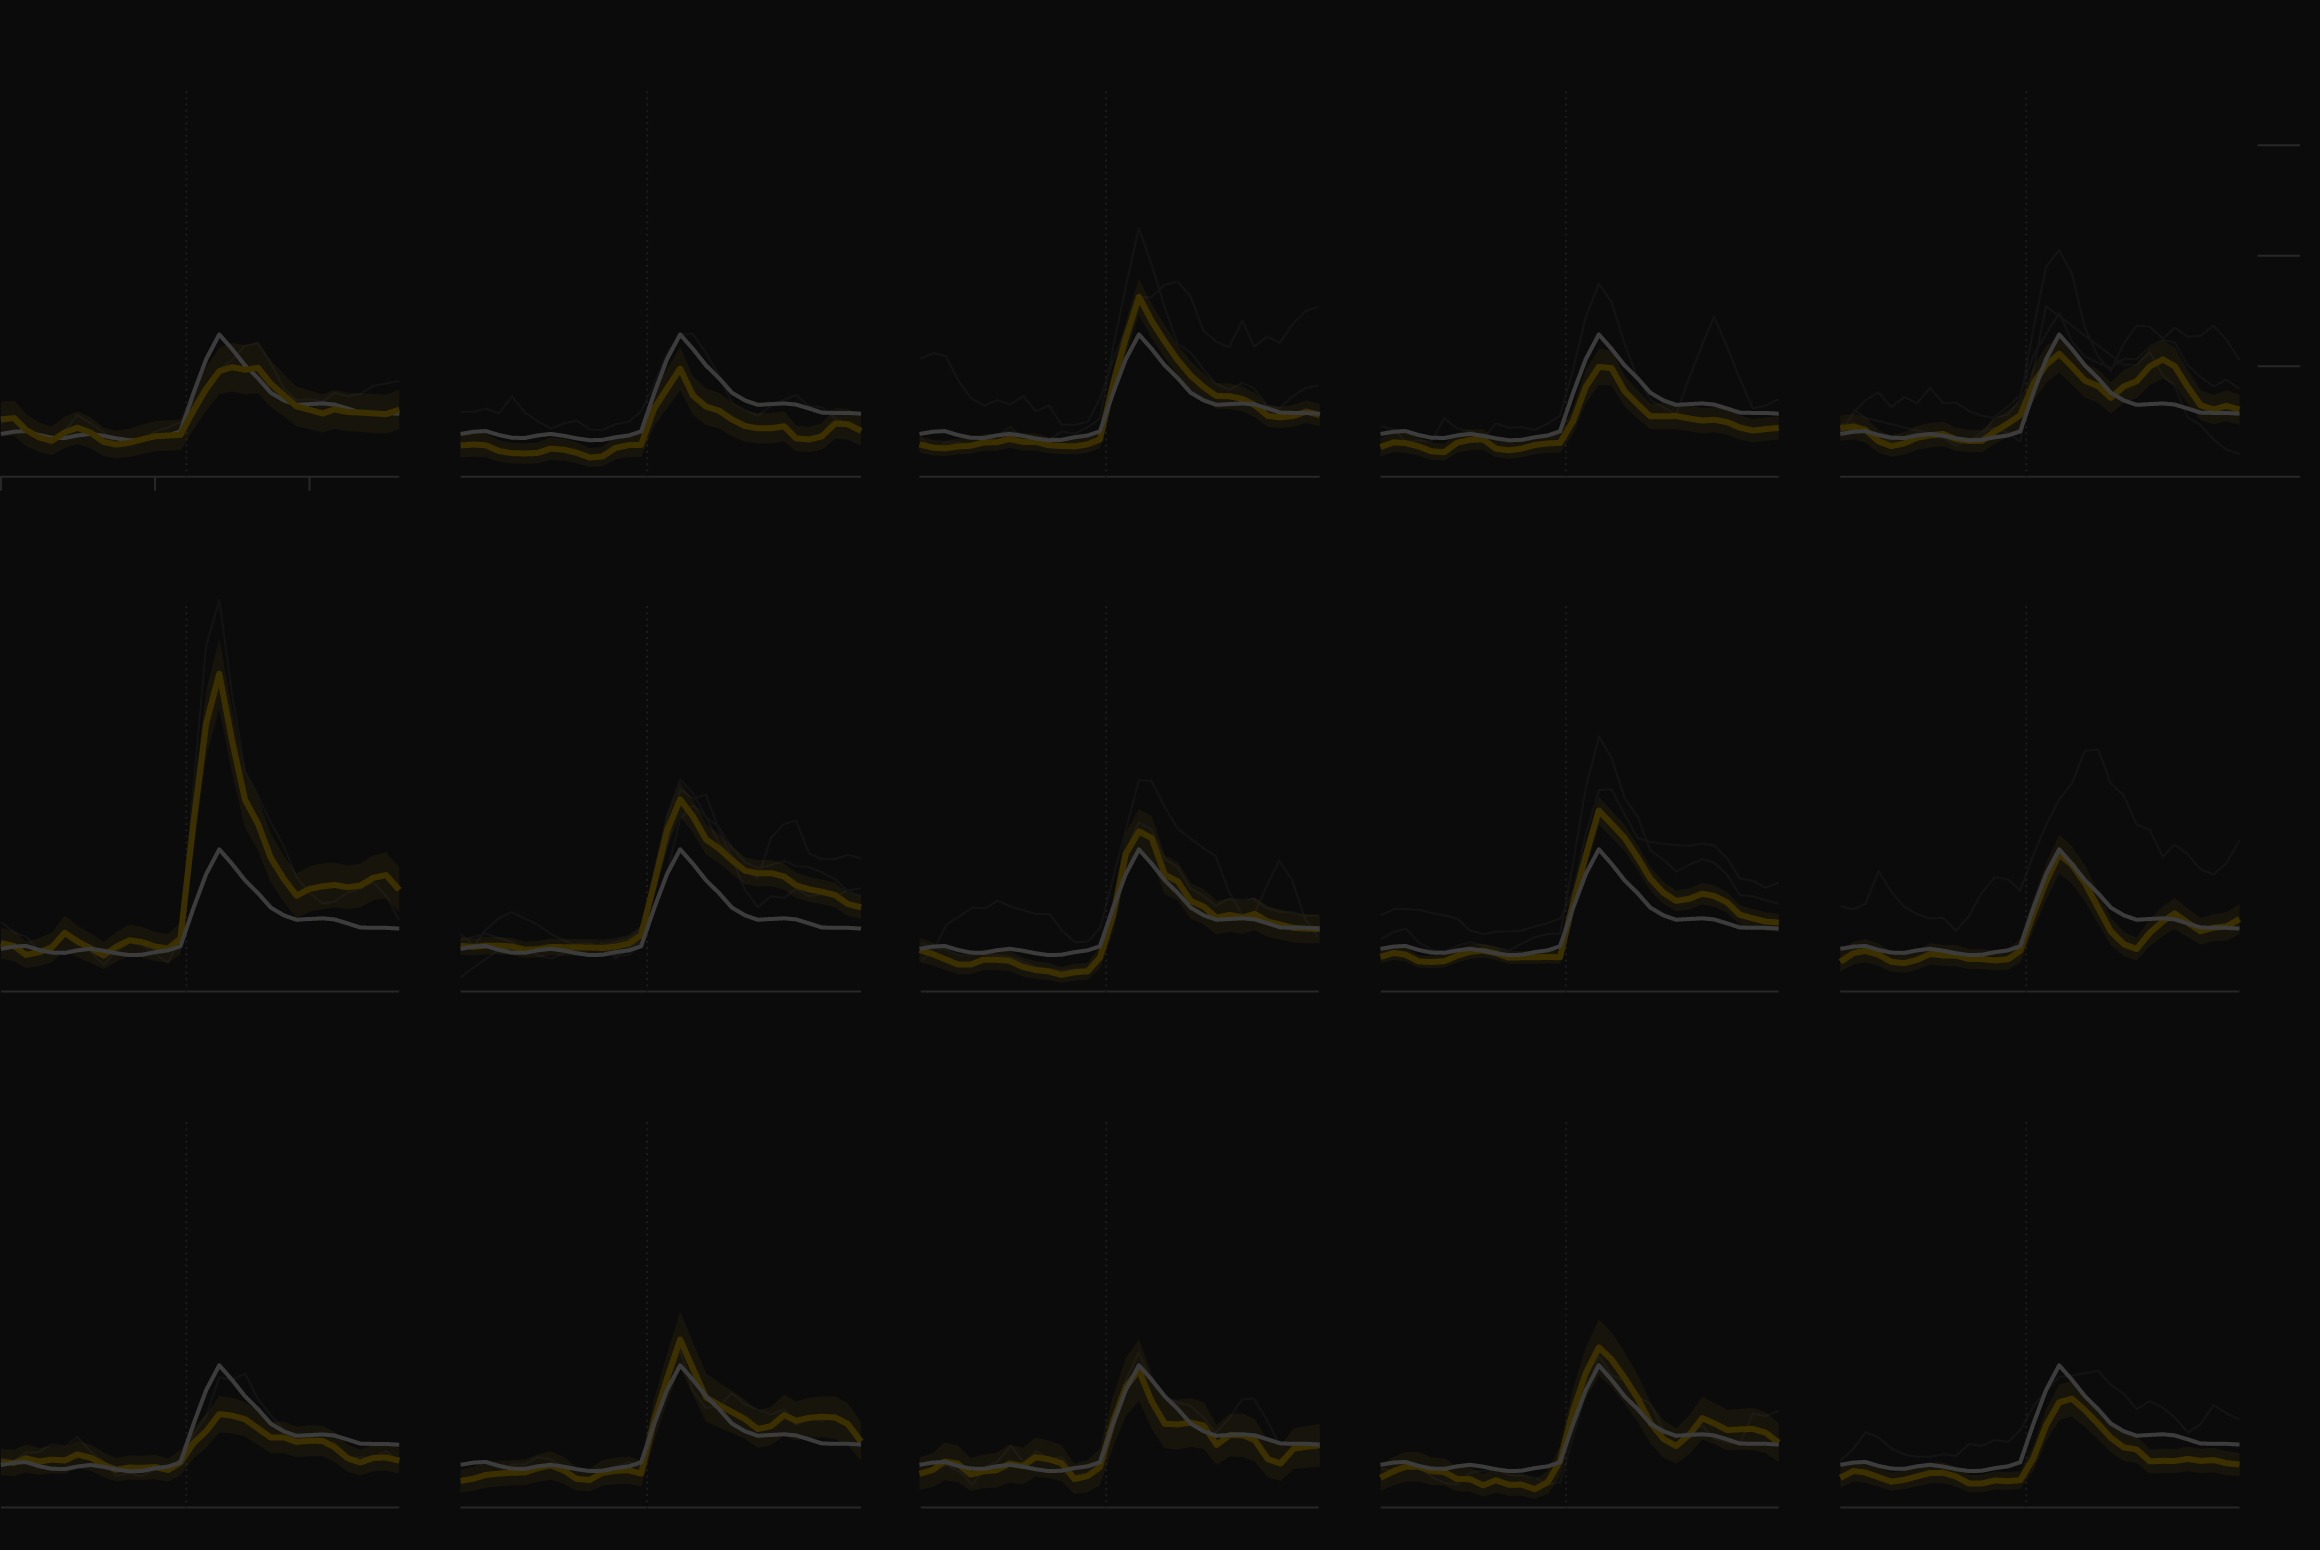
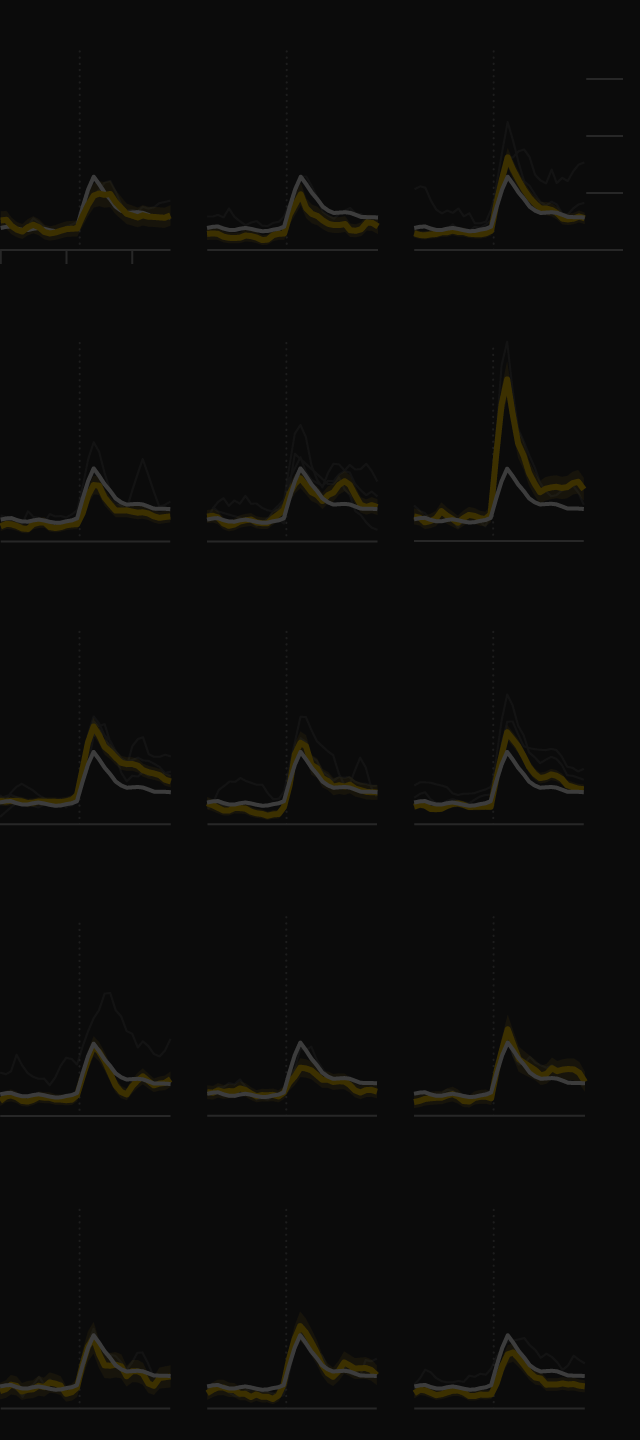
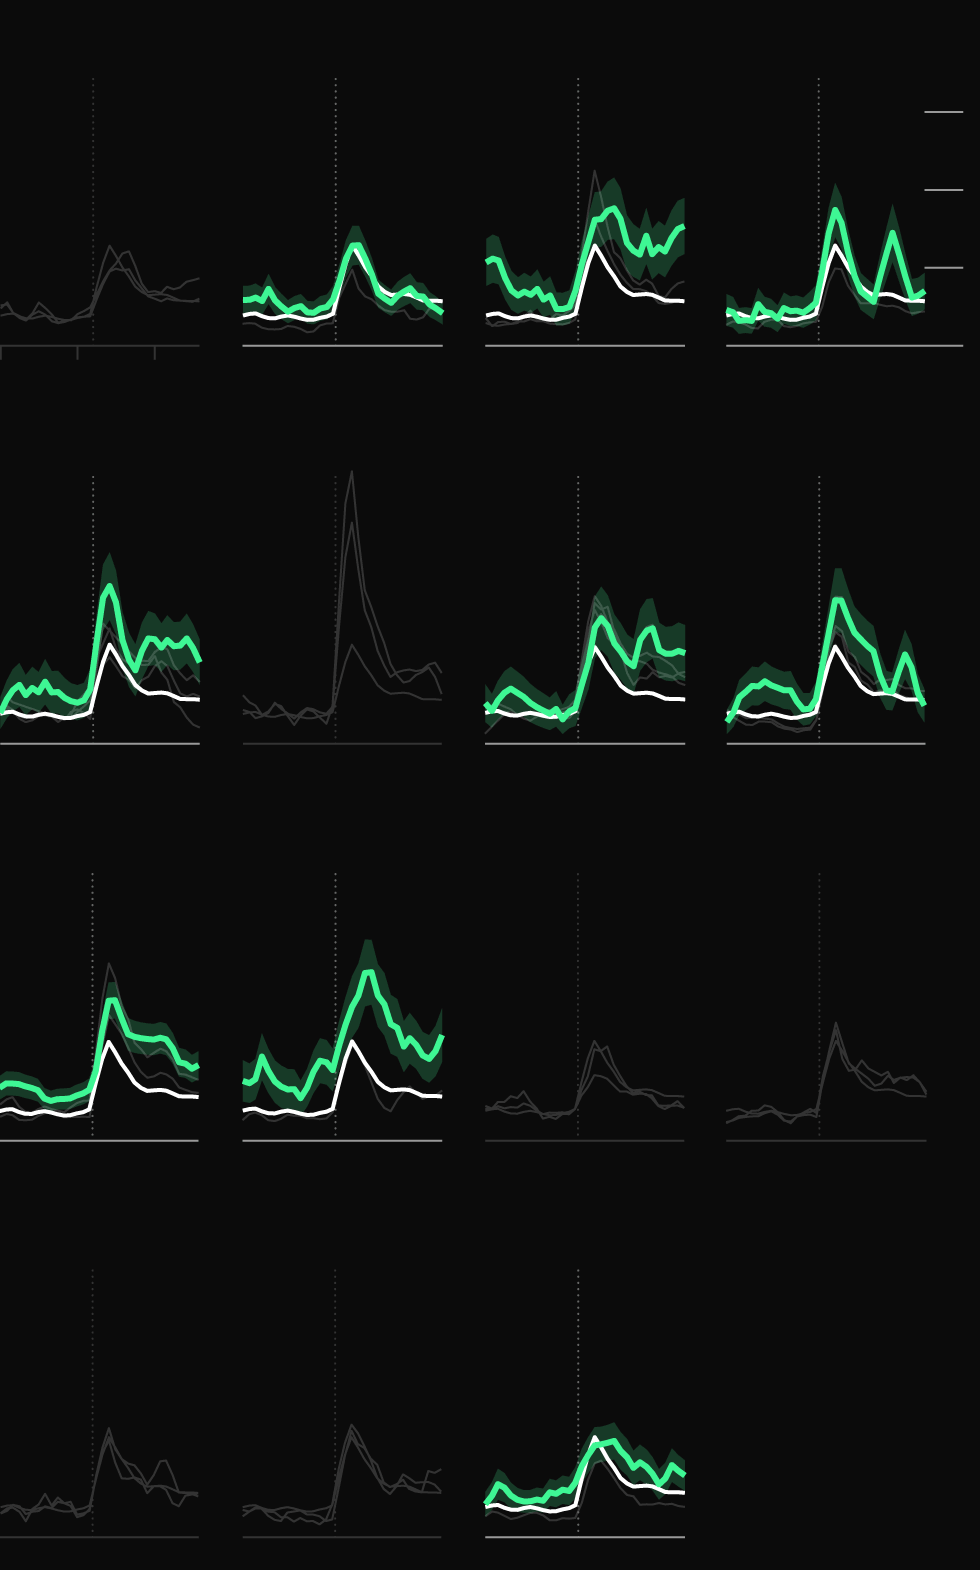
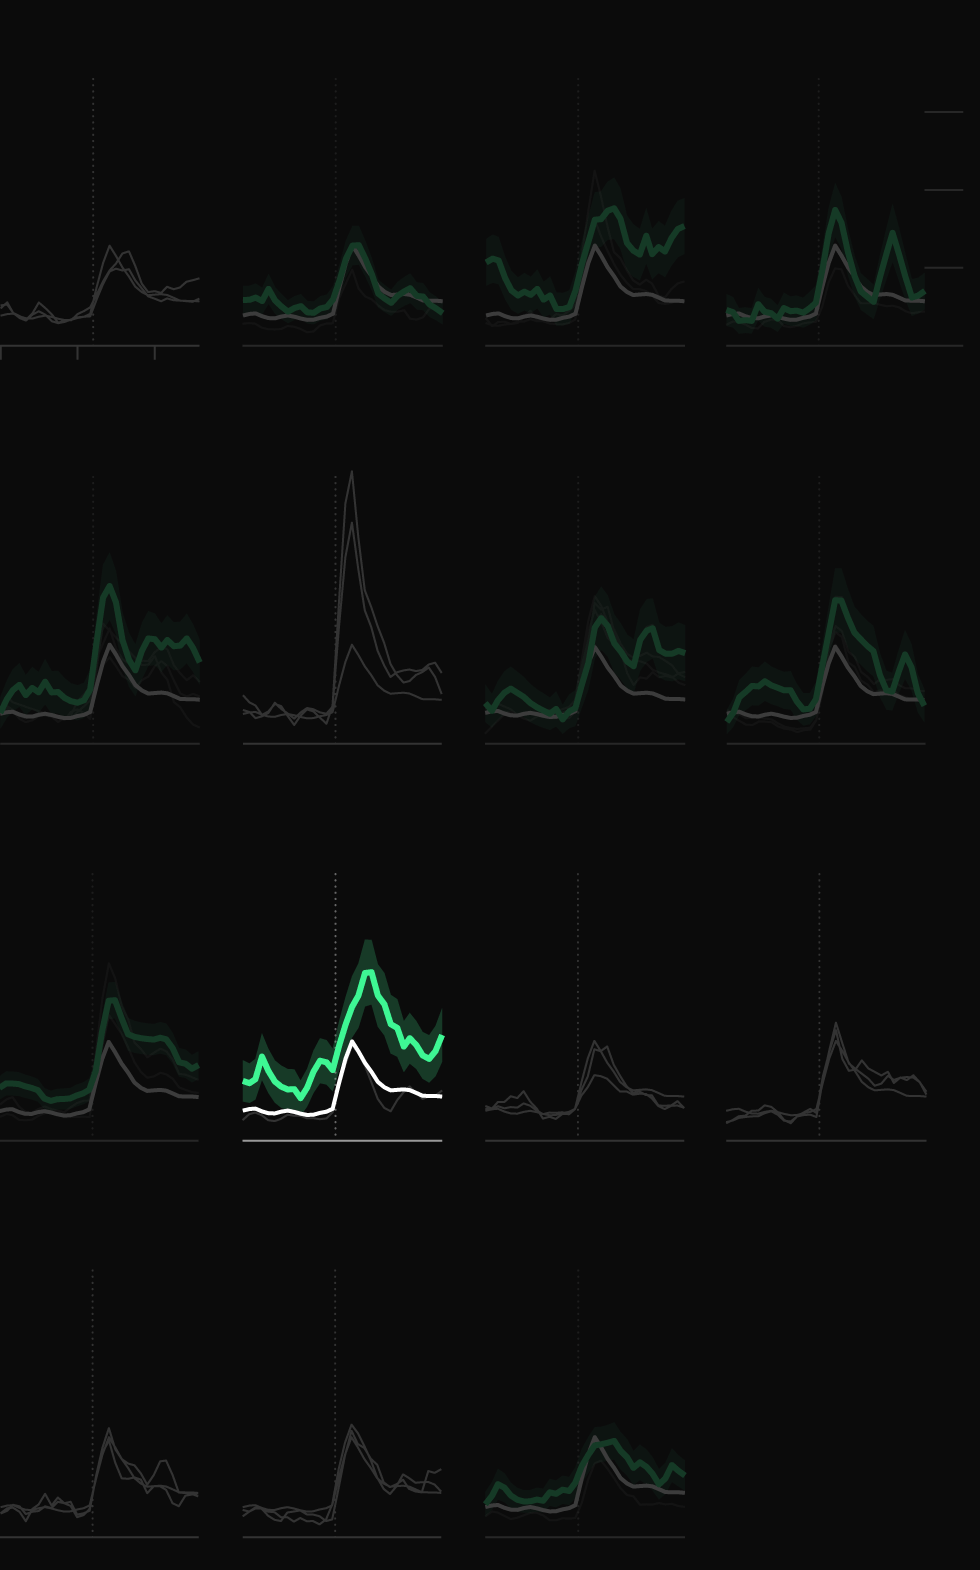
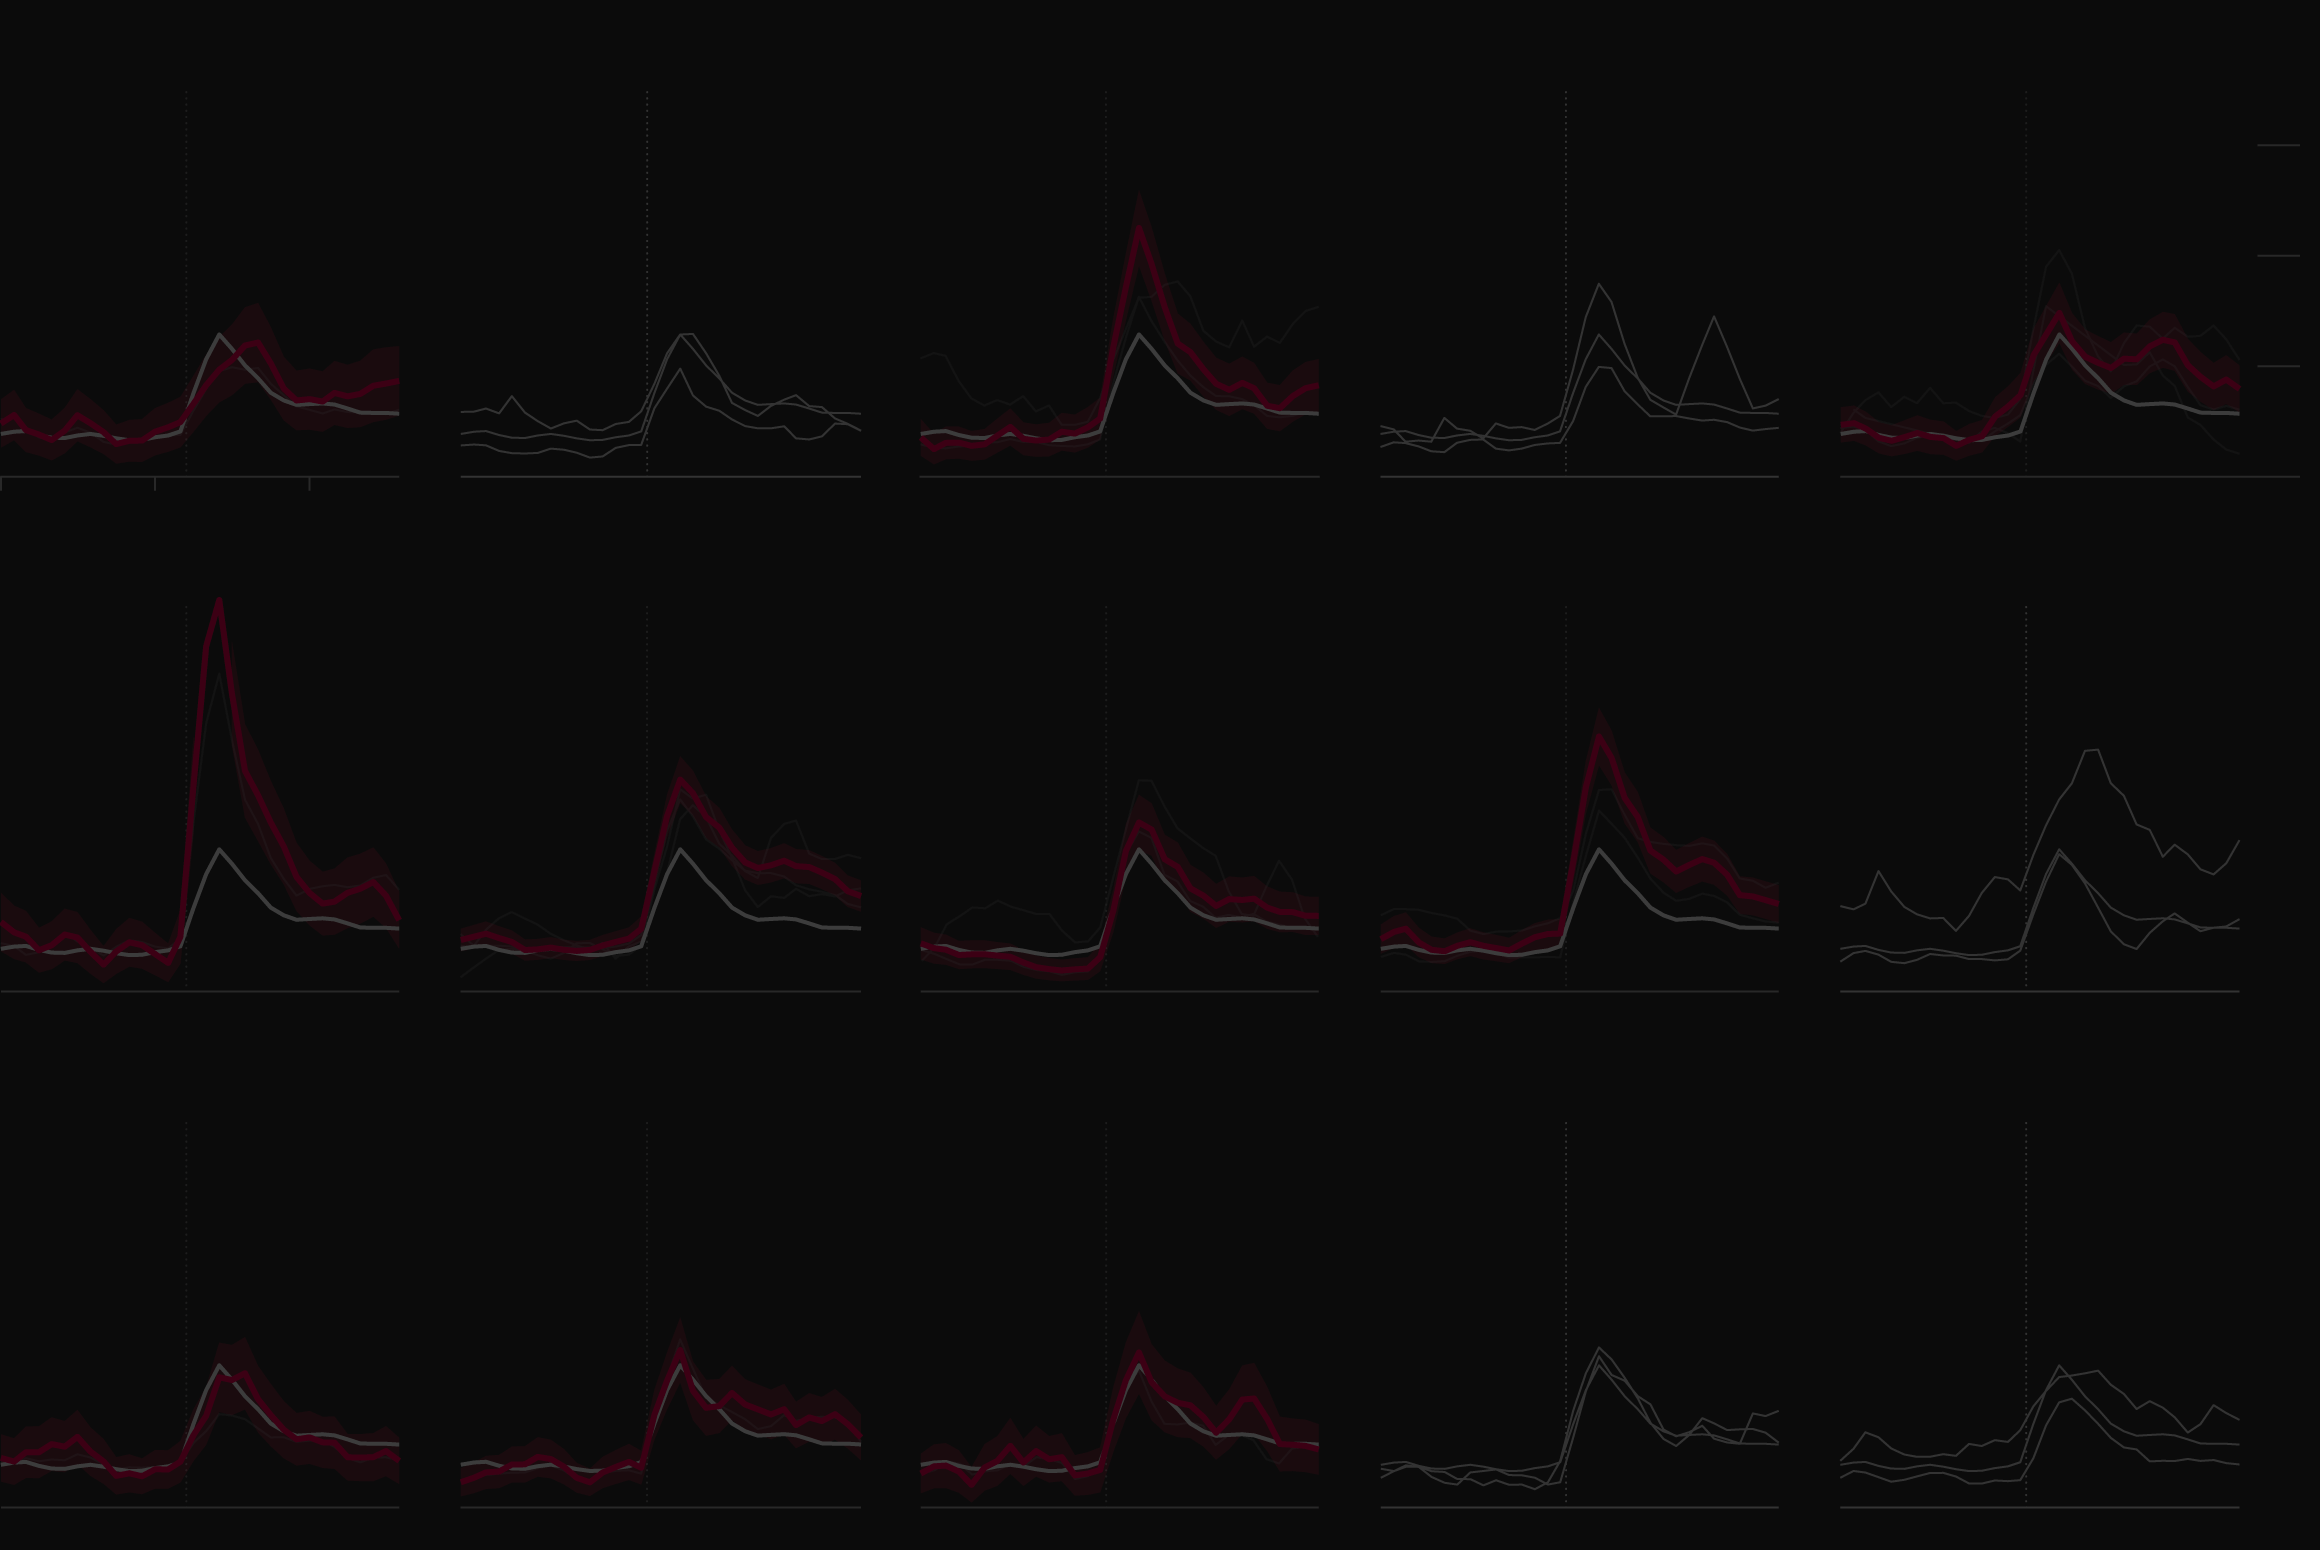
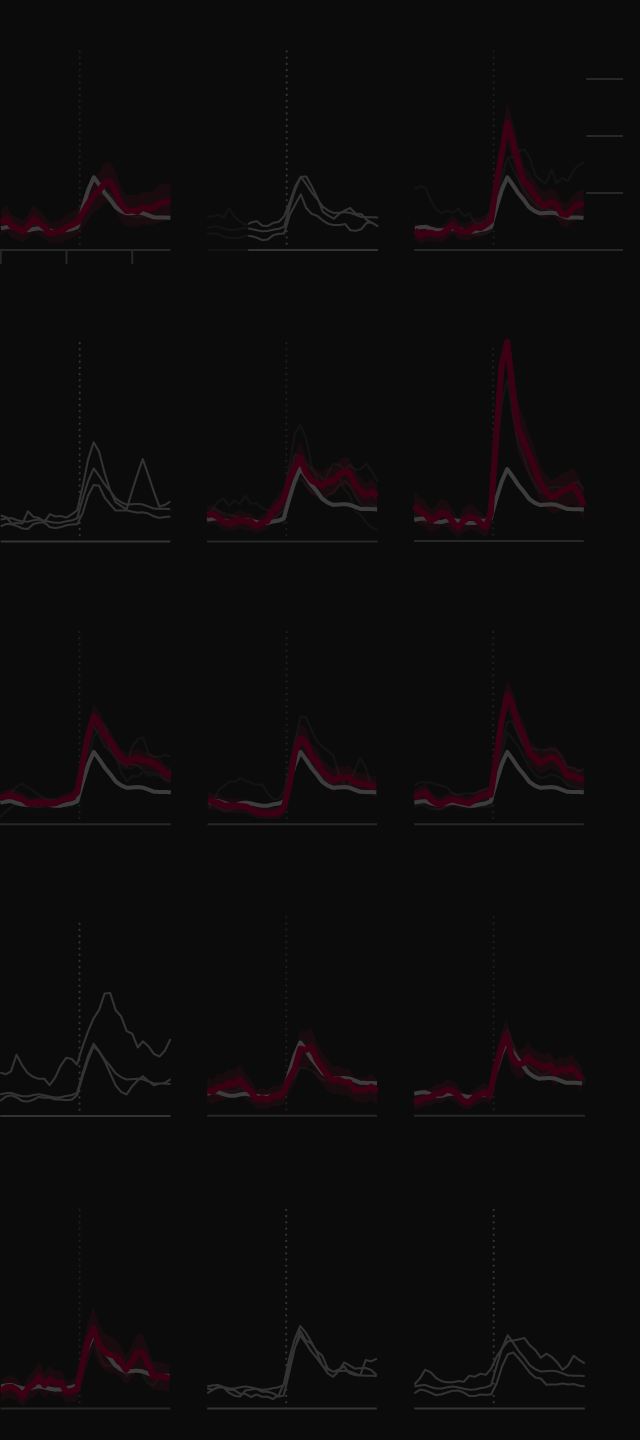
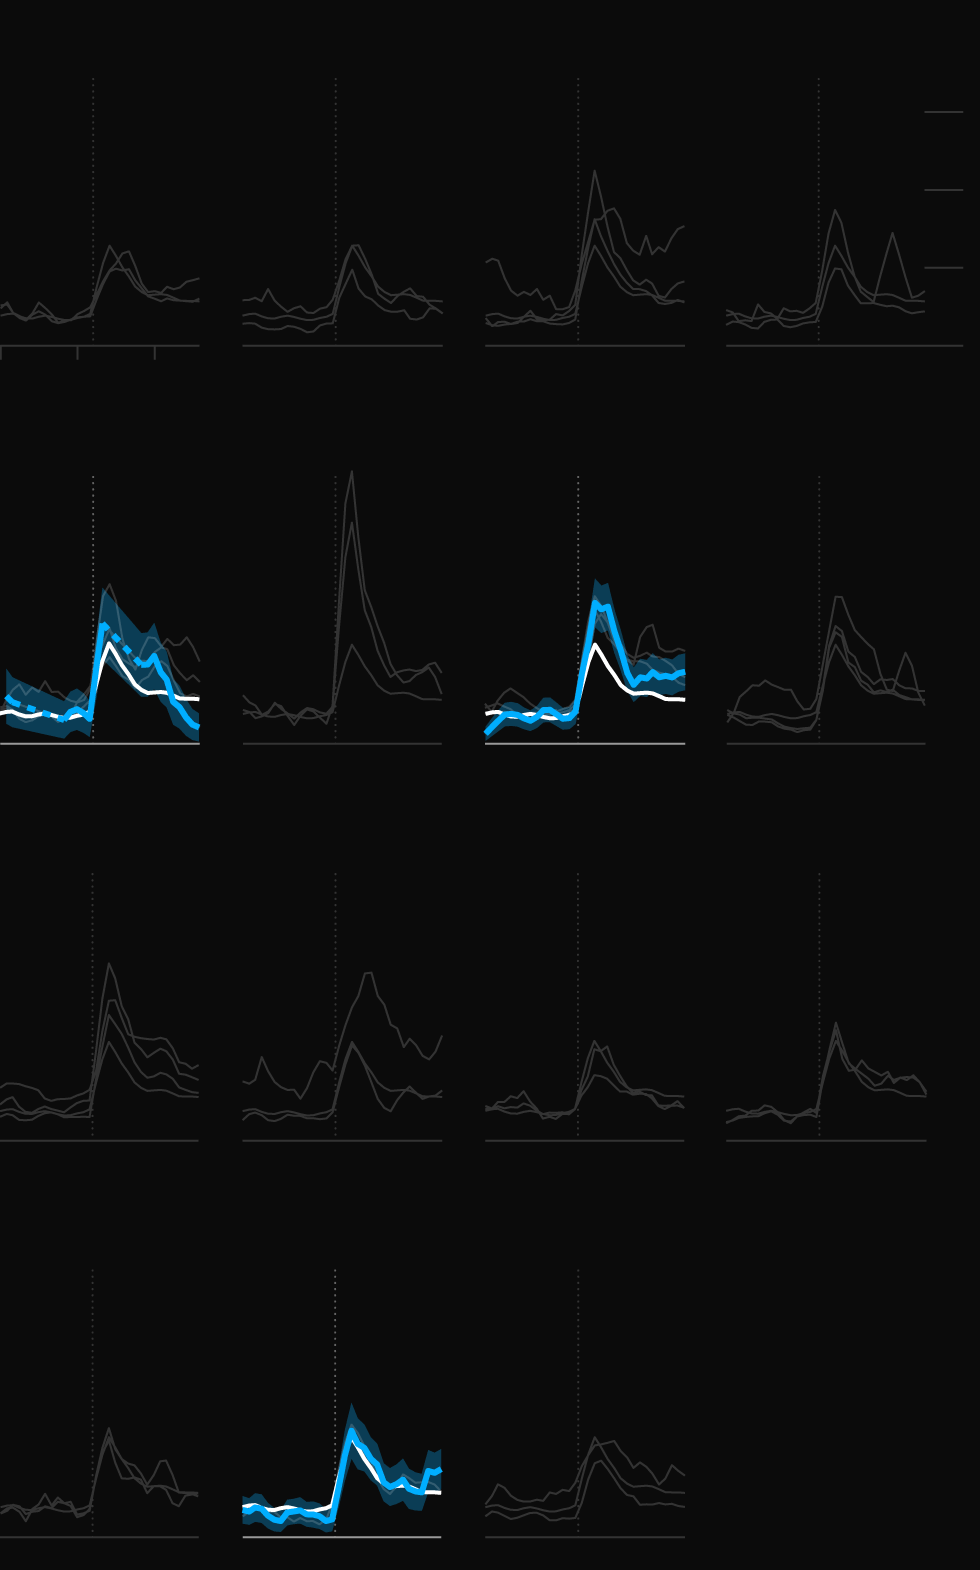
Difficulty Calculating Asian Rates
The economic recovery is hardest to quantify among Asian Americans, who comprise a smaller part of the population. The group’s higher share of foreign-born people and many languages spoken also make surveying uniquely challenging. Response rates for unemployment were significant enough in Los Angeles and San Francisco, where their jobless rates through August remain several percentage points higher than the national average for Asians.
Note: The dashed line for Houston indicates where sample sizes weren’t large enough to calculate a rate.
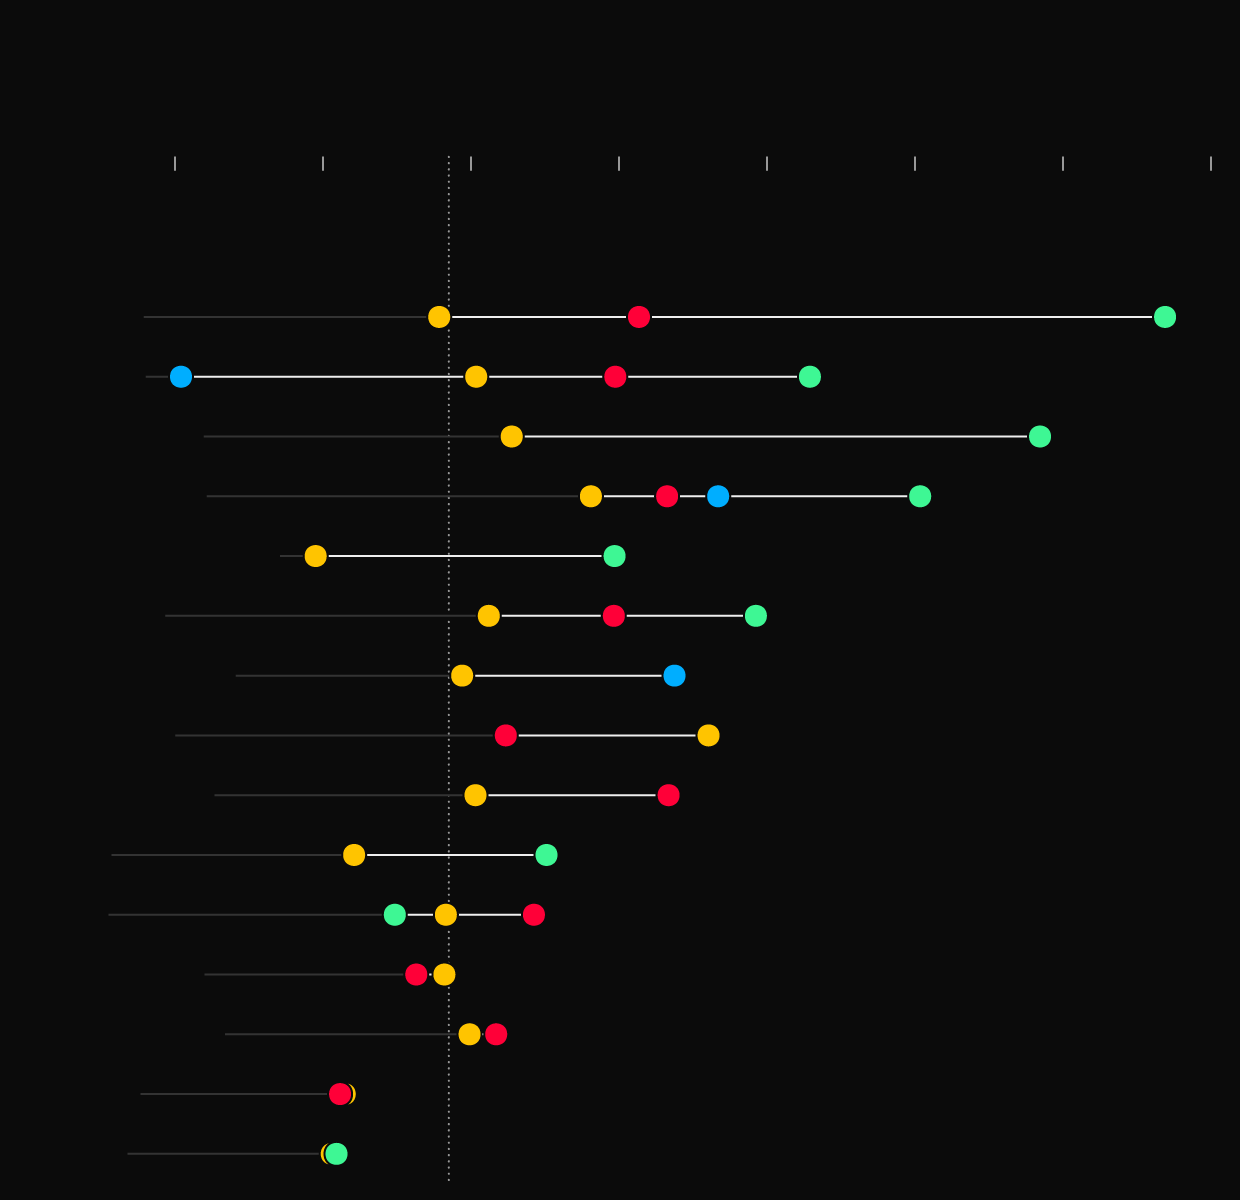
The 15 metro areas included in this Bloomberg analysis represent a combined population of over 100 million people, according to new 2020 census numbers released last month, and had total economic output of $7.9 trillion in 2019, according to the Bureau of Economic Analysis, or about 37% of total U.S. gross domestic product.
Some of the largest metro areas and economic engines of the country—such as New York, Chicago, Houston and Washington, D.C.—saw the widest gaps by race and ethnicity in the June to August period.
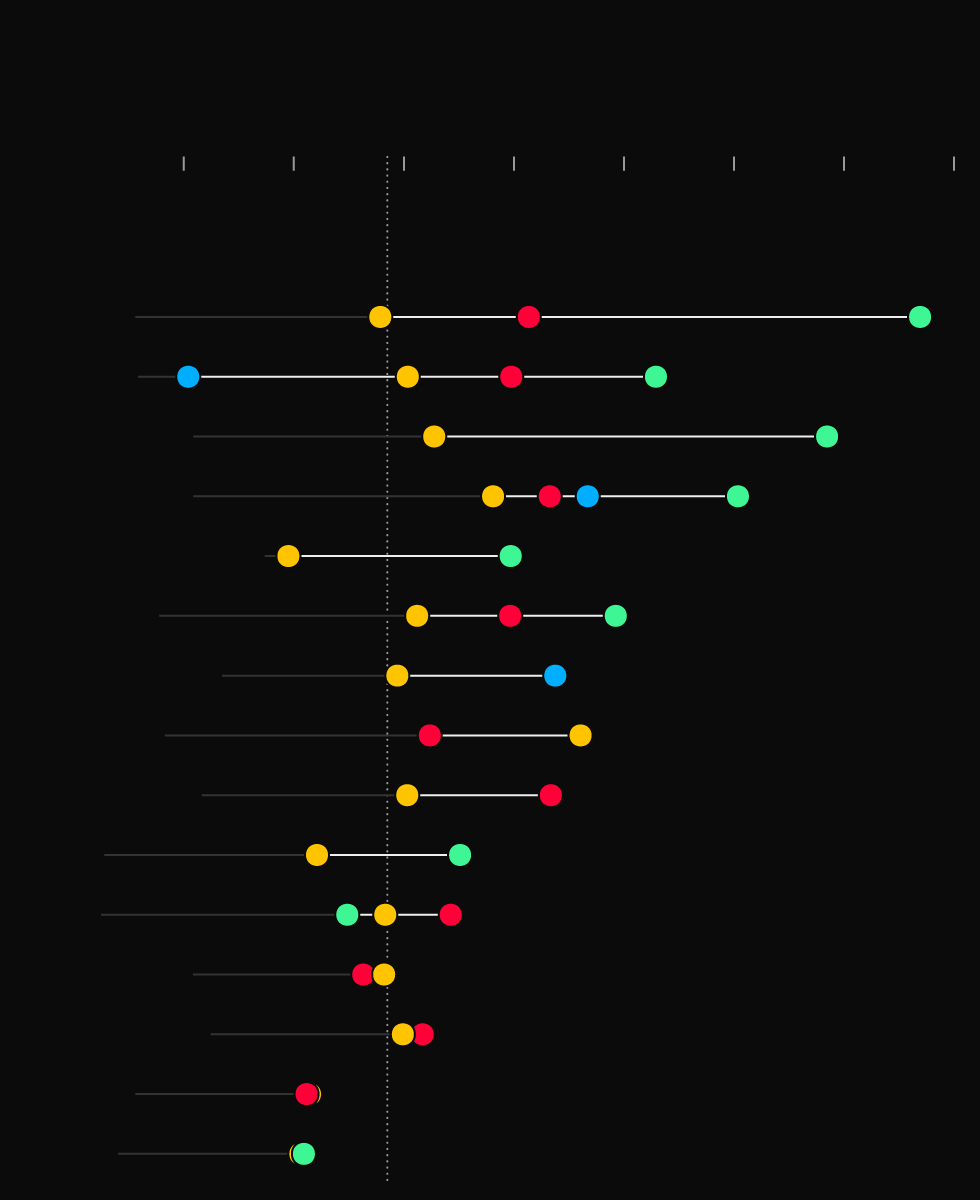
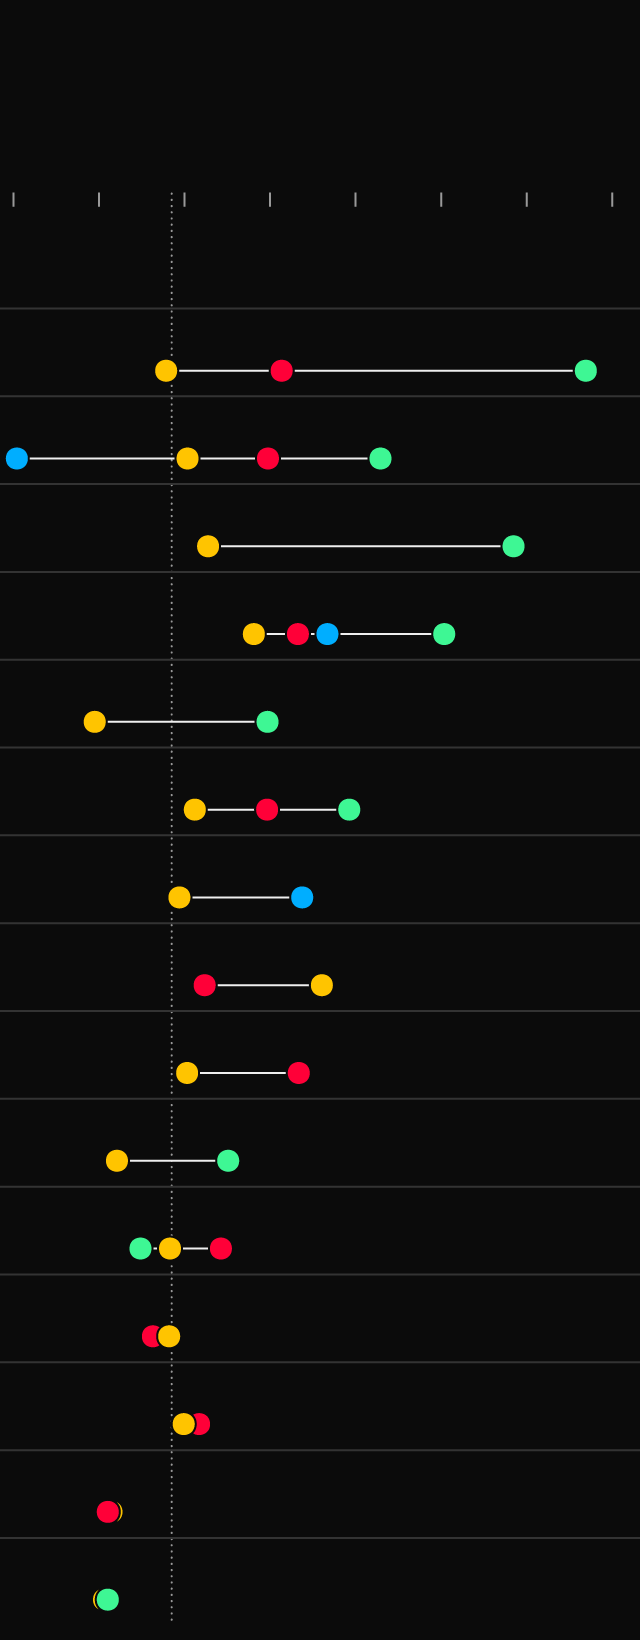
Jobless Gaps Persist
● Asian
● Black
● Hispanic
● White
Unemployment rate (NSA), June–August 2021 average
2
4
6
8
10
12
14
16%
Overall national
unemployment
◀
Chicago
Houston
Philadelphia
◀ All four group rates in L.A. are statistically above the national average.
Los Angeles
Washington, D.C.
New York
San Francisco
Las Vegas
Albuquerque
Dallas
Miami
San Antonio
Riverside, CA
Phoenix
Atlanta
● Asian
● Black
● Hispanic
● White
Unemployment rate (NSA), June–August 2021 average
2
4
6
8
10
12
14
16%
Overall national
unemployment
◀
Chicago
Houston
Philadelphia
Los Angeles
▲ All four group rates in L.A. are statistically above the national average.
Washington, D.C.
New York
San Francisco
Las Vegas
Albuquerque
Dallas
Miami
San Antonio
Riverside, CA
Phoenix
Atlanta
● Asian
● Black
● Hispanic
● White
Unemployment rate (NSA),
June–August 2021 average
2
4
6
8
10
12
14
16%
Overall national
unemployment
◀
Chicago
Houston
Philadelphia
Los Angeles
▲ All four group rates in L.A. are statistically above the national average.
Washington, D.C.
New York
San Francisco
Las Vegas
Albuquerque
Dallas
Miami
San Antonio
Riverside, CA
Phoenix
Atlanta
Bloomberg has also been analyzing local home price trends, how much Paycheck Protection Program money has gone to different neighborhoods, as well as data on business openings, job postings and credit card spending. These other datasets broadly reveal similar signs of an uneven recovery, where some groups—mostly minorities—are increasingly being left behind.
The pandemic’s disproportionate impact on people of color and the increasing evidence of a slowing recovery for those same communities complicate the Fed’s decision to taper.
At a recent Fed event on racism and the economy, Federal Reserve Bank of Boston President Eric Rosengren called the disparate outcomes during the pandemic “horrifying.”
“If ever there was a time for us to focus on these different outcomes, it’s now,” he said.