
Race &Recovery
In a City Split Along Race, Black D.C. Workers See Strong Economic Recovery
Bloomberg is tracking the economic recovery in minority communities across the country
The economic recovery in Washington, D.C., was buoyed by federal government jobs. Now, the city faces the tougher challenge of getting private-sector business back.
That’s the view of the mayor of the nation’s capital, Muriel Bowser, who visited New York City this week in part to draw a return of corporate travel.
“We need office workers back,” she said, including from new employers. “Companies are going to look to move and we want them to look to D.C. when they do.”
In the District of Columbia, where the population of Black and White residents is about evenly split, the economic rebound has been strong. The region is seeing some of the lowest unemployment rates among major metropolitan areas for both racial groups, according to an analysis by Bloomberg.
A key element of that resilience is the concentration of jobs in the federal government, which provided a floor of sorts. The local recovery is also supported by a rising housing market for White and Black neighborhoods, though there are hard-to-miss signs of economically vulnerable people being squeezed out.
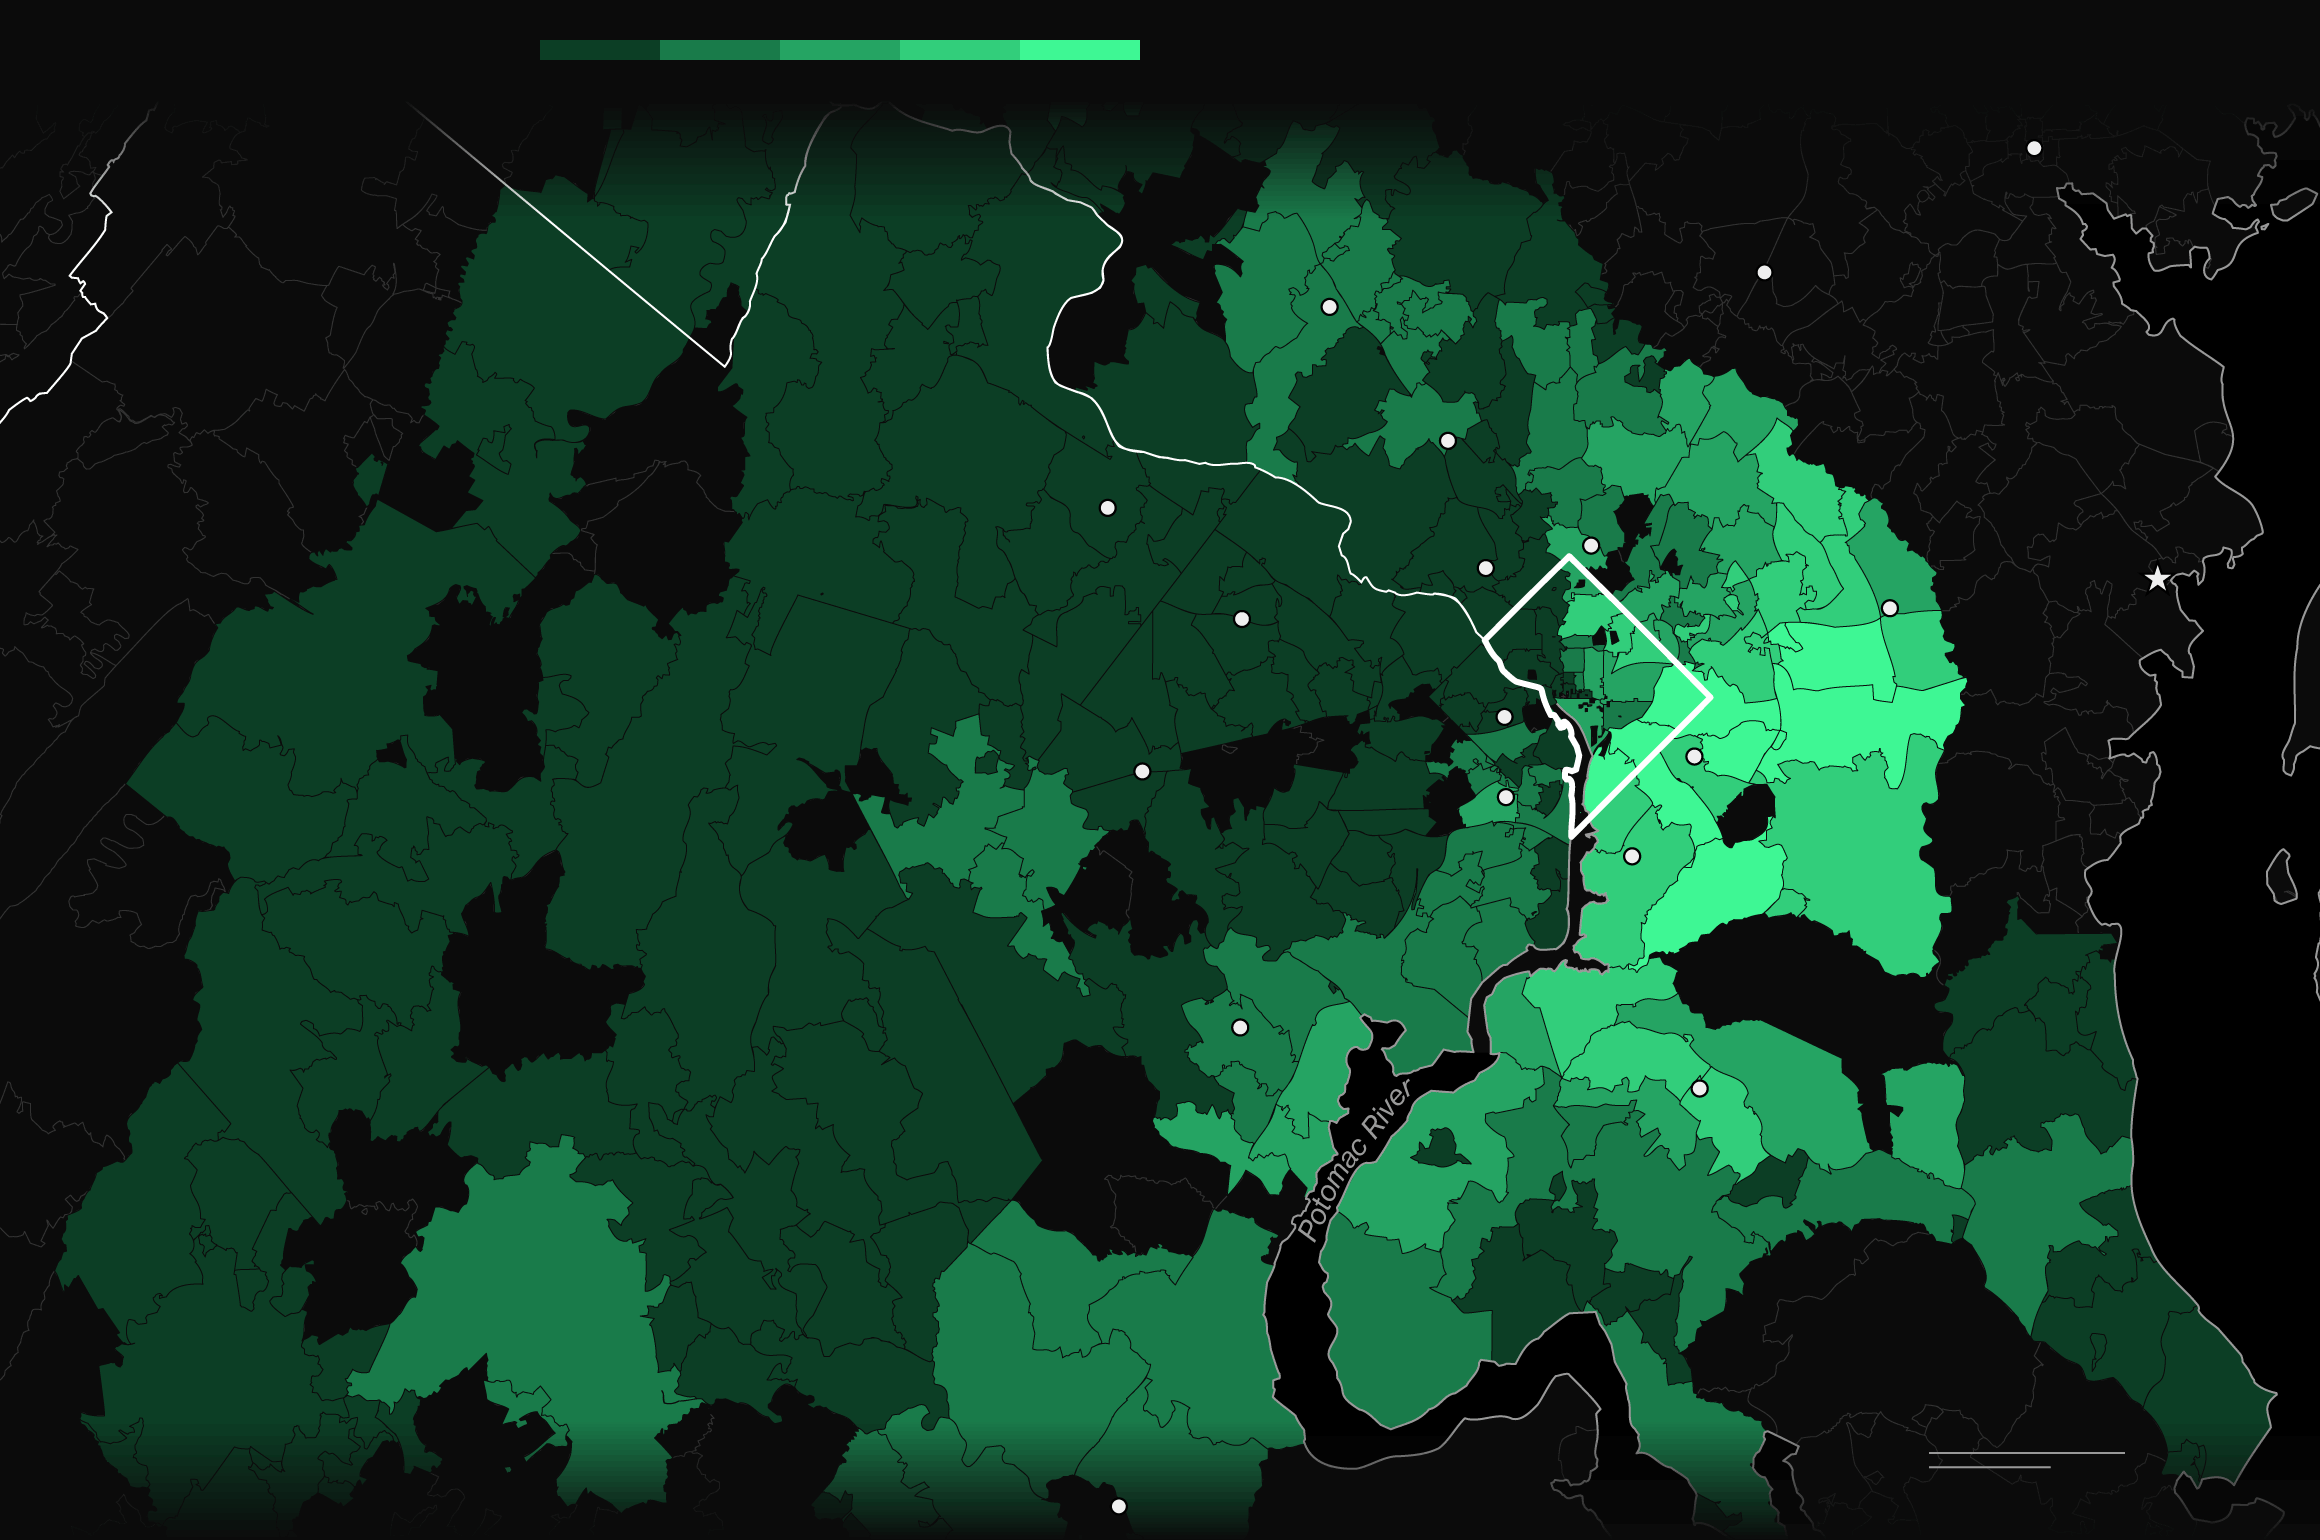
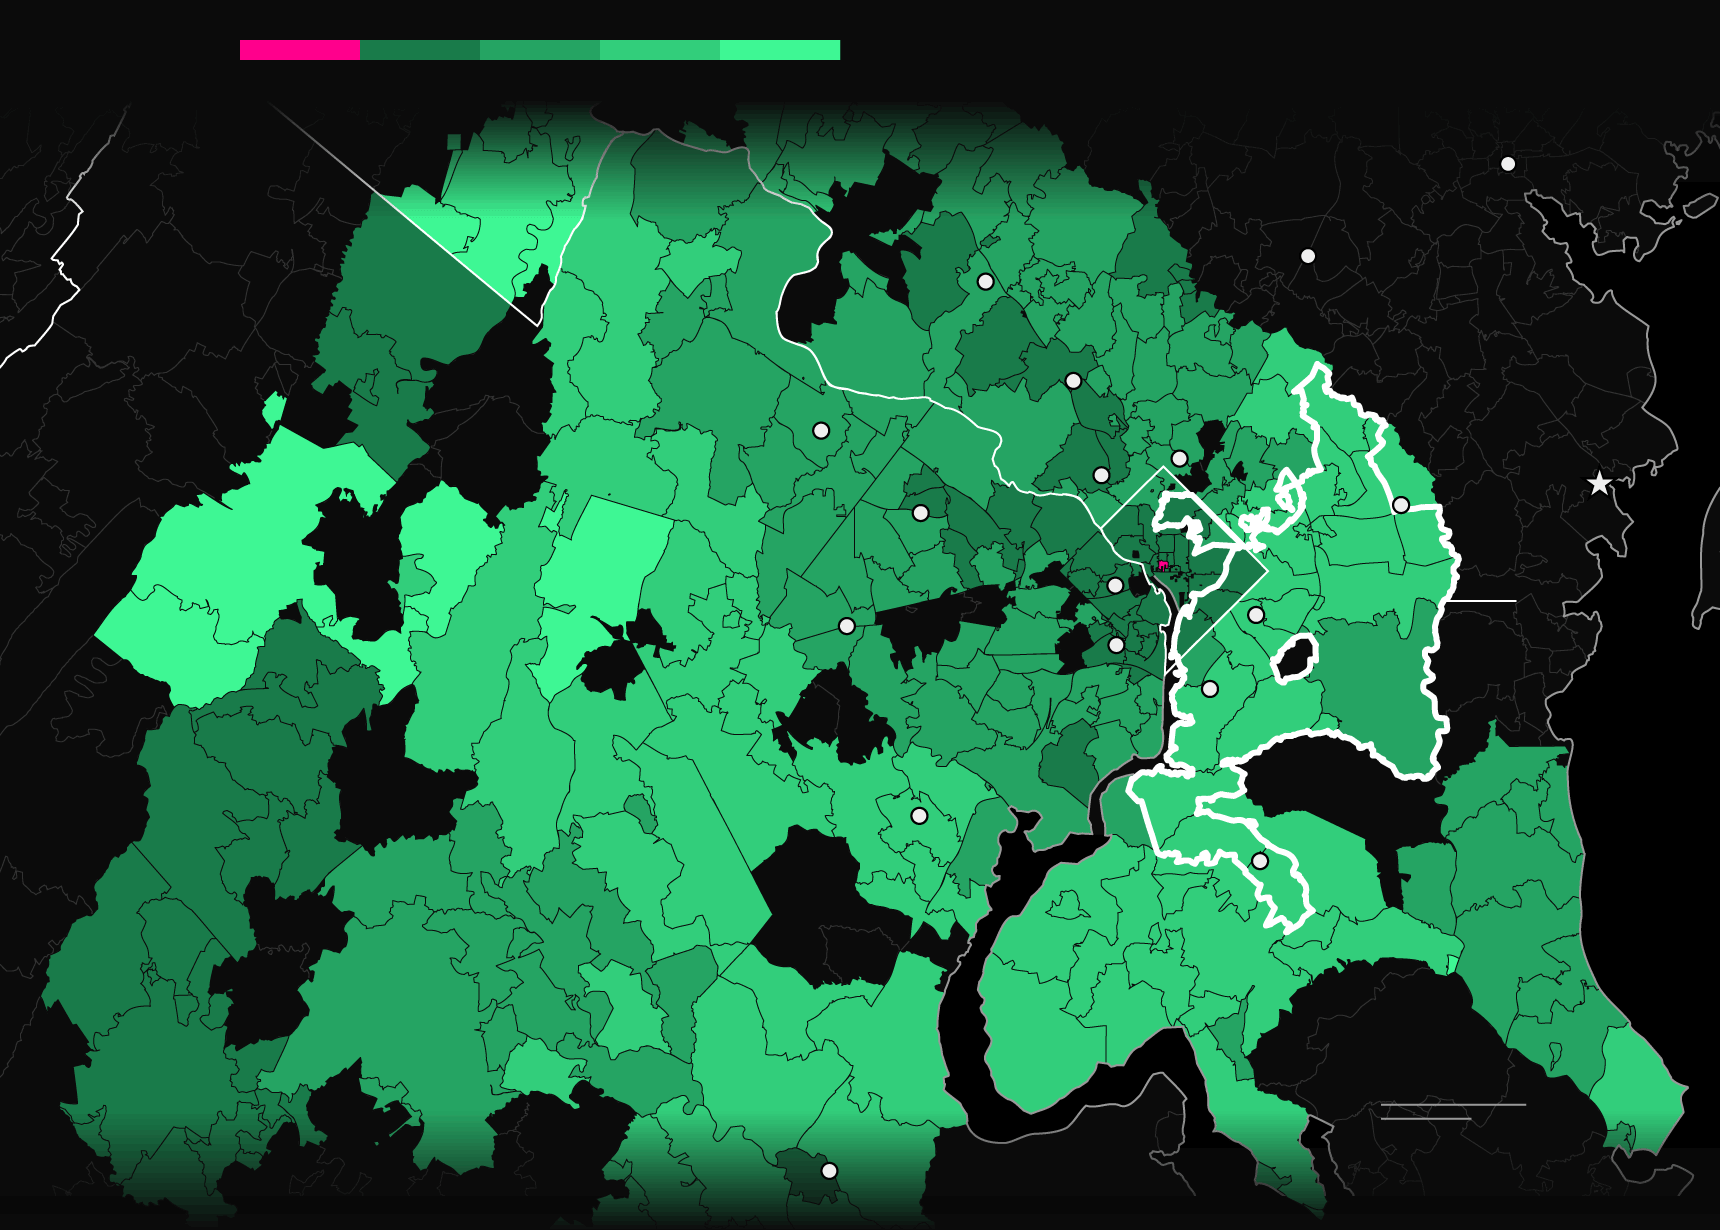
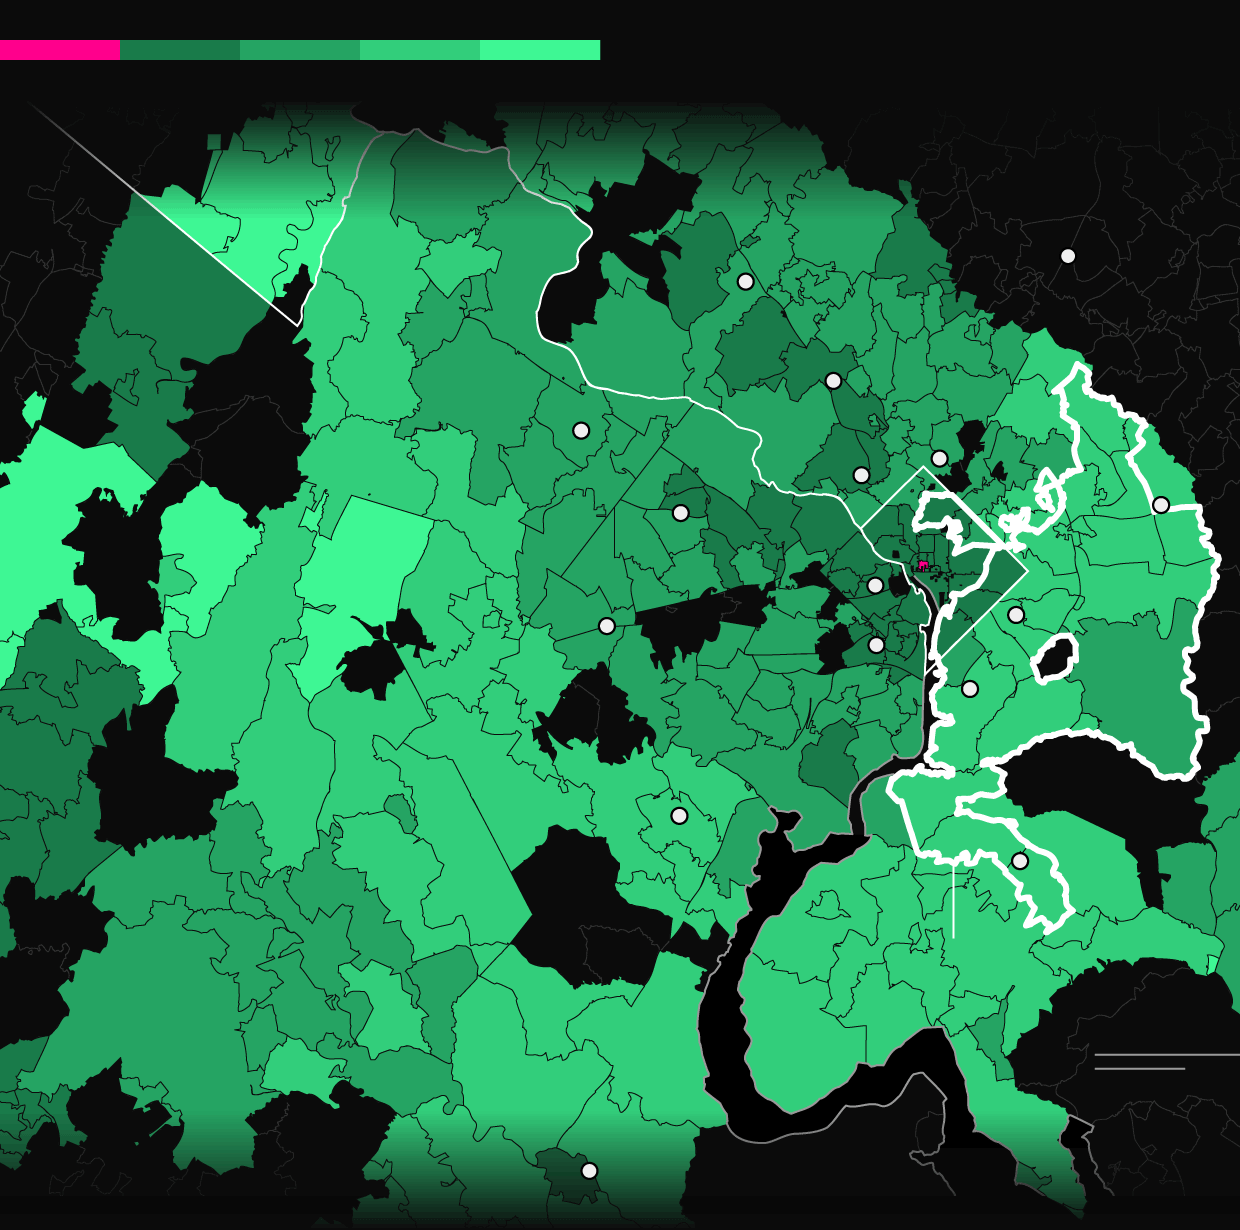
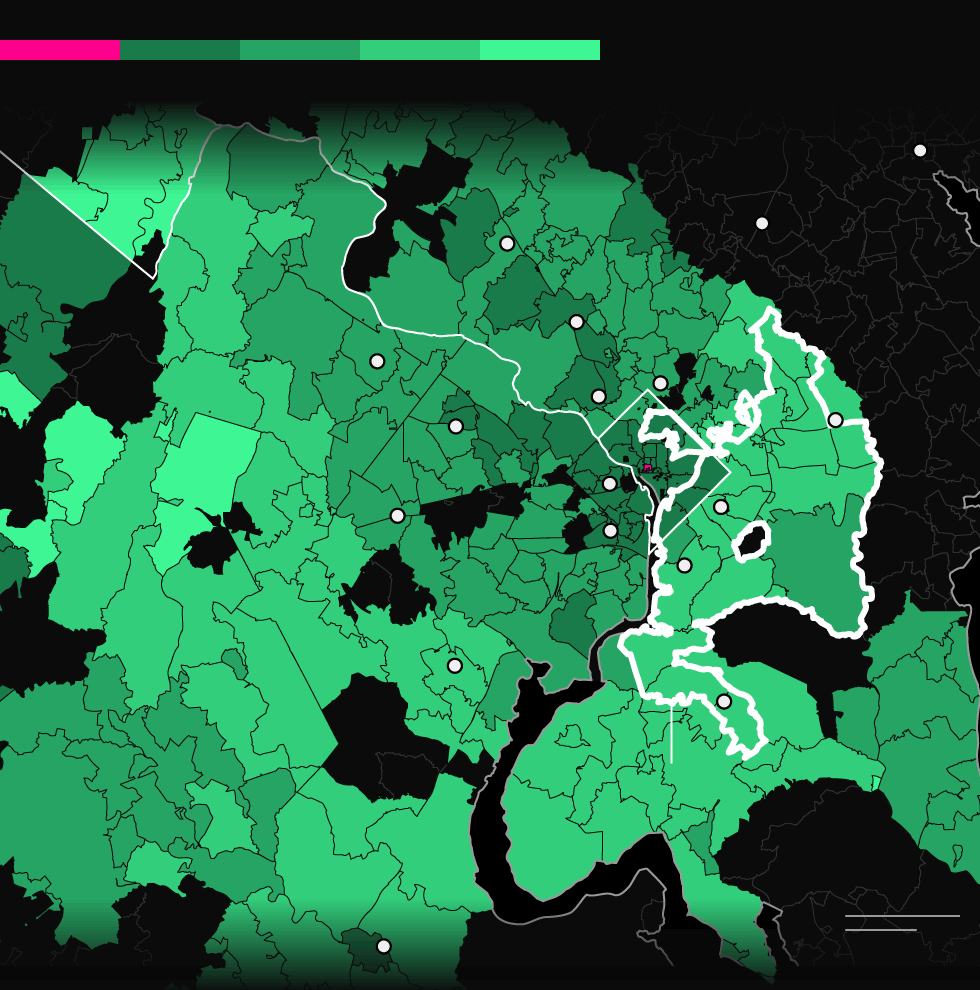
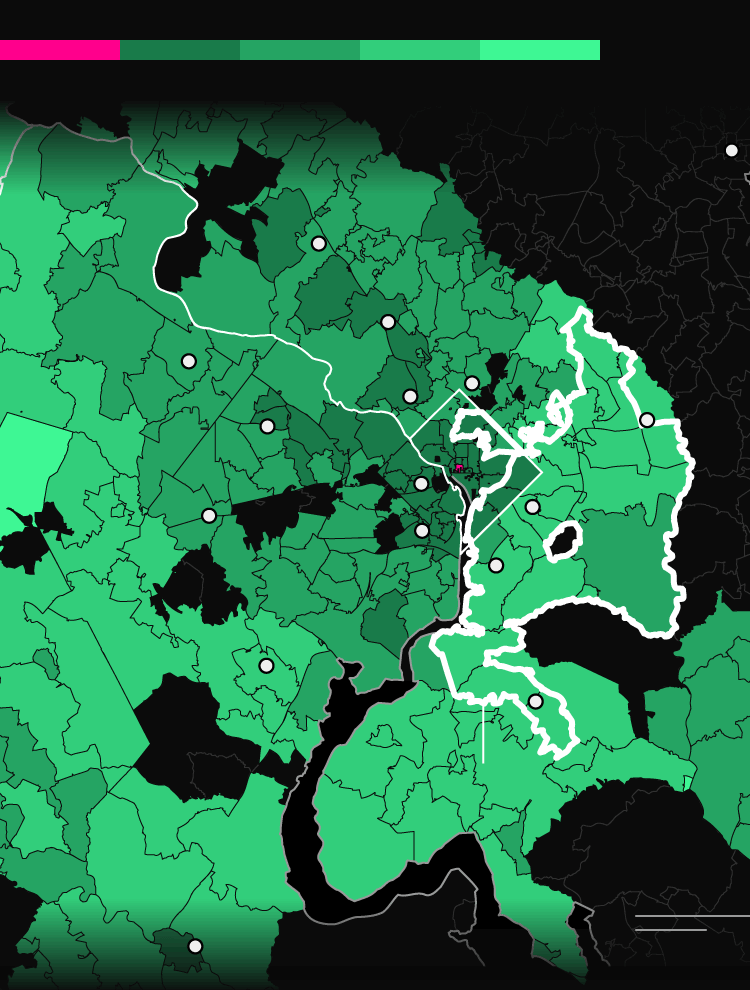
Black population share (2019)
10
25
50
75%
west
Virginia
Baltimore
Columbia
Germantown
maryland
Rockville
Ashburn
Silver
Spring
Bethesda
Annapolis
Bowie
Reston
Washington, D.C.
Virginia
Arlington
Suitland
Centreville
Alexandria
Oxon Hill
Dale City
Waldorf
Chesapeake
Bay
10 miles
Fredericksburg
10 km
Black population share (2019)
10
25
50
75%
west
Virginia
Baltimore
Columbia
Germantown
maryland
Rockville
Silver
Spring
Ashburn
Bethesda
Annapolis
Bowie
Reston
Virginia
Washington, D.C.
Suitland
Centreville
Arlington
Alexandria
Chesapeake
Bay
Oxon Hill
Dale City
Waldorf
Potomac River
10 miles
Fredericksburg
10 km
Black population share (2019)
10
25
50
75%
west
Virginia
Columbia
Germantown
maryland
Rockville
Silver
Spring
Ashburn
Bethesda
Bowie
Reston
Virginia
Washington, D.C.
Suitland
Centreville
Arlington
Alexandria
Oxon Hill
Dale City
Waldorf
10 miles
Potomac River
10 km
Fredericksburg
Black population share (2019)
10
25
50
75%
Baltimore
west
Virginia
Columbia
Germantown
maryland
Rockville
Silver
Spring
Ashburn
Bethesda
Bowie
Reston
Virginia
Washington, D.C.
Suitland
Centreville
Arlington
Alexandria
Oxon Hill
Dale City
Waldorf
10 miles
Fredericksburg
10 km
Black population share (2019)
10
25
50
75%
Baltimore
maryland
Germantown
Rockville
Silver
Spring
Ashburn
Bethesda
Bowie
Reston
Washington, D.C.
Suitland
Centreville
Arlington
Alexandria
Virginia
Oxon Hill
Dale City
Waldorf
10 miles
Fredericksburg
10 km
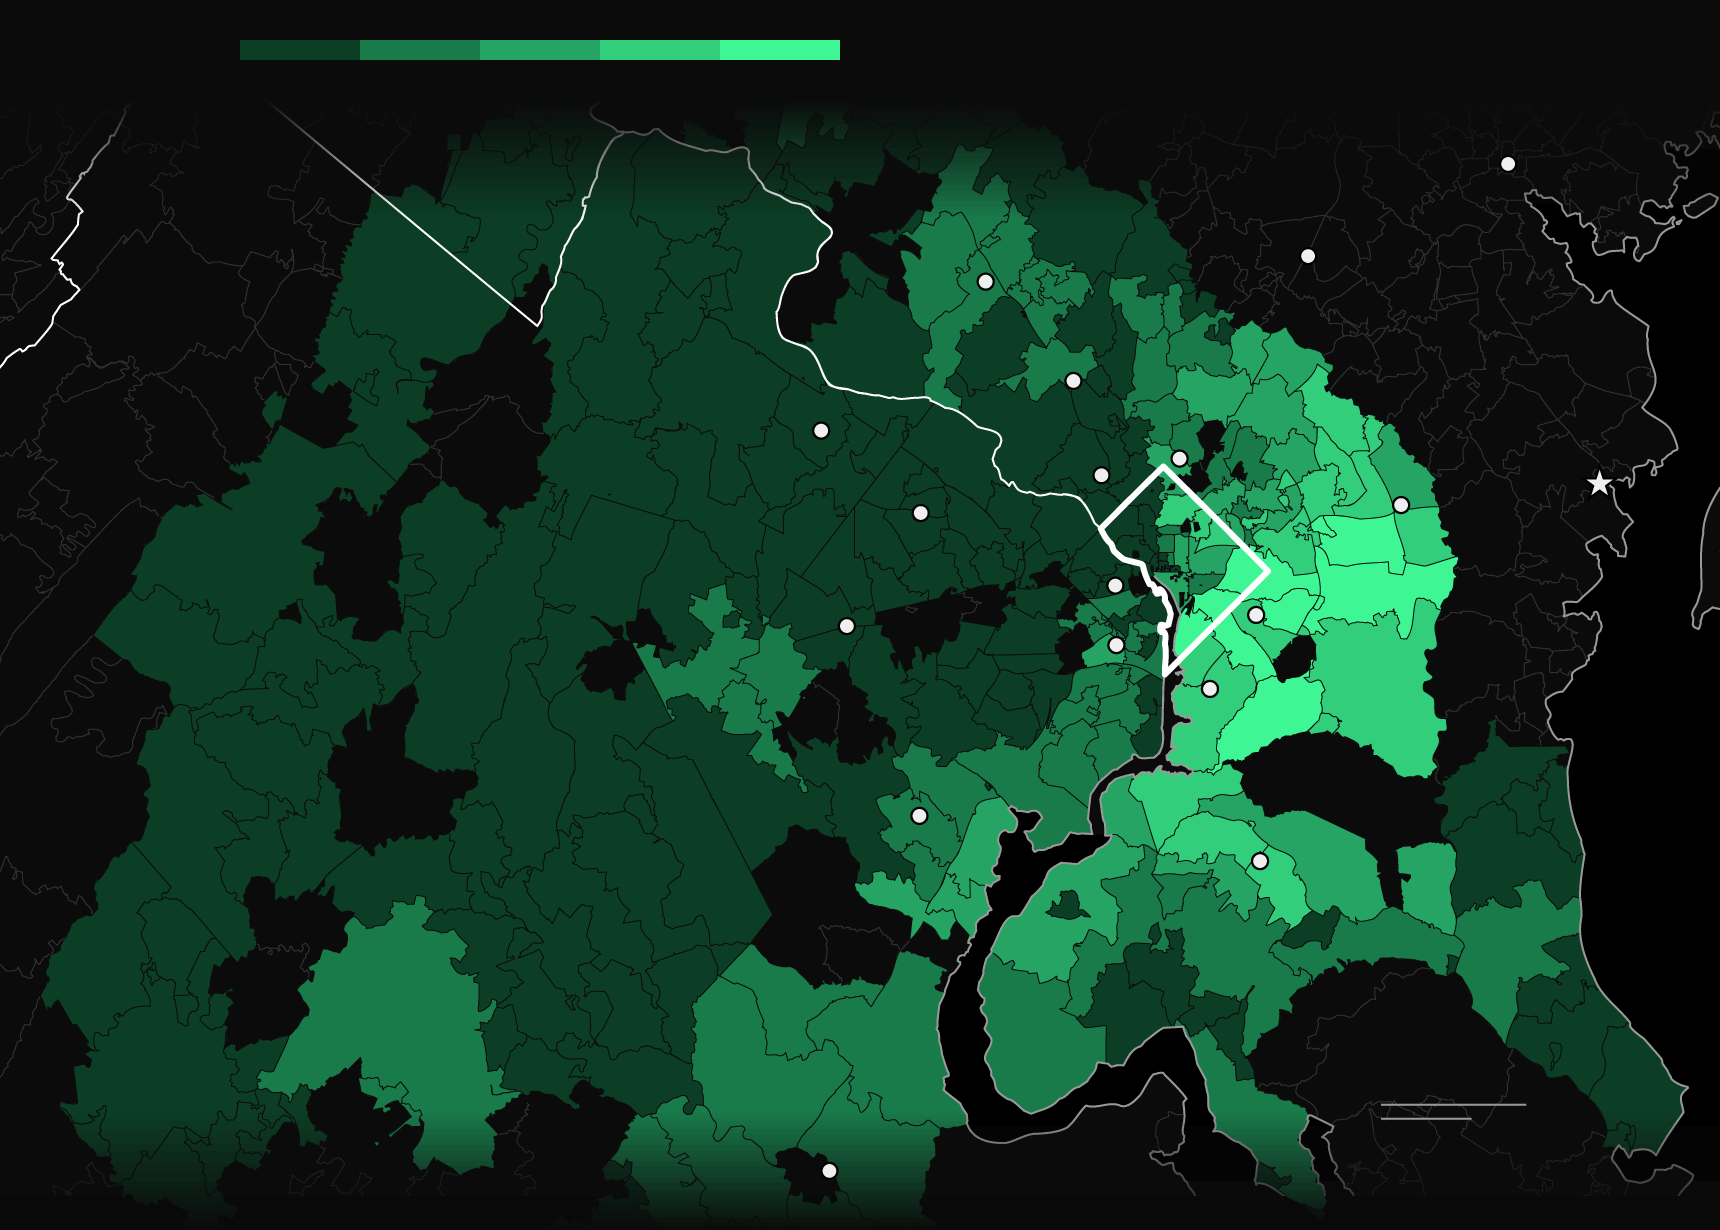
Median household income (2019)
50K
100K
150K
$200K
west
Virginia
Baltimore
Columbia
Germantown
$150,156
Glenn Dale, MD
Rockville
Ashburn
Silver
Spring
Bethesda
Annapolis
Bowie
Reston
Washington, D.C.
Virginia
Arlington
Suitland
Centreville
Majority-Black
zipcodes
Alexandria
Oxon Hill
Dale City
Waldorf
Chesapeake
Bay
10 miles
Fredericksburg
10 km
Median household income (2019)
50K
100K
150K
$200K
west
Virginia
Baltimore
Columbia
Germantown
$150,156
Glenn Dale, MD
Rockville
Silver
Spring
Ashburn
Bethesda
Annapolis
Bowie
Reston
Virginia
Washington, D.C.
Majority-Black
zipcodes
Suitland
Centreville
Arlington
Alexandria
Chesapeake
Bay
Oxon Hill
Dale City
Waldorf
Potomac River
10 miles
Fredericksburg
10 km
Median household income (2019)
50K
100K
150K
$200K
west
Virginia
$150,156
Glenn Dale, MD
Germantown
Rockville
Silver
Spring
Ashburn
Bethesda
Bowie
Reston
Virginia
Washington, D.C.
Suitland
Centreville
Arlington
Alexandria
Oxon Hill
Dale City
Waldorf
Majority-Black
zipcodes
10 miles
Potomac River
10 km
Fredericksburg
Median household income (2019)
50K
100K
150K
$200K
Baltimore
west
Virginia
$150,156
Glenn Dale, MD
Germantown
Rockville
Silver
Spring
Ashburn
Bethesda
Bowie
Reston
Virginia
Washington, D.C.
Suitland
Centreville
Arlington
Alexandria
Oxon Hill
Dale City
Waldorf
Majority-Black
zipcodes
10 miles
Fredericksburg
10 km
Median household income (2019)
50K
100K
150K
$200K
Baltimore
$150,156
Glenn Dale, MD
Germantown
Rockville
Silver
Spring
Ashburn
Bethesda
Bowie
Reston
Washington, D.C.
Suitland
Centreville
Arlington
Alexandria
Virginia
Oxon Hill
Dale City
Waldorf
Majority-Black
zipcodes
10 miles
Fredericksburg
10 km
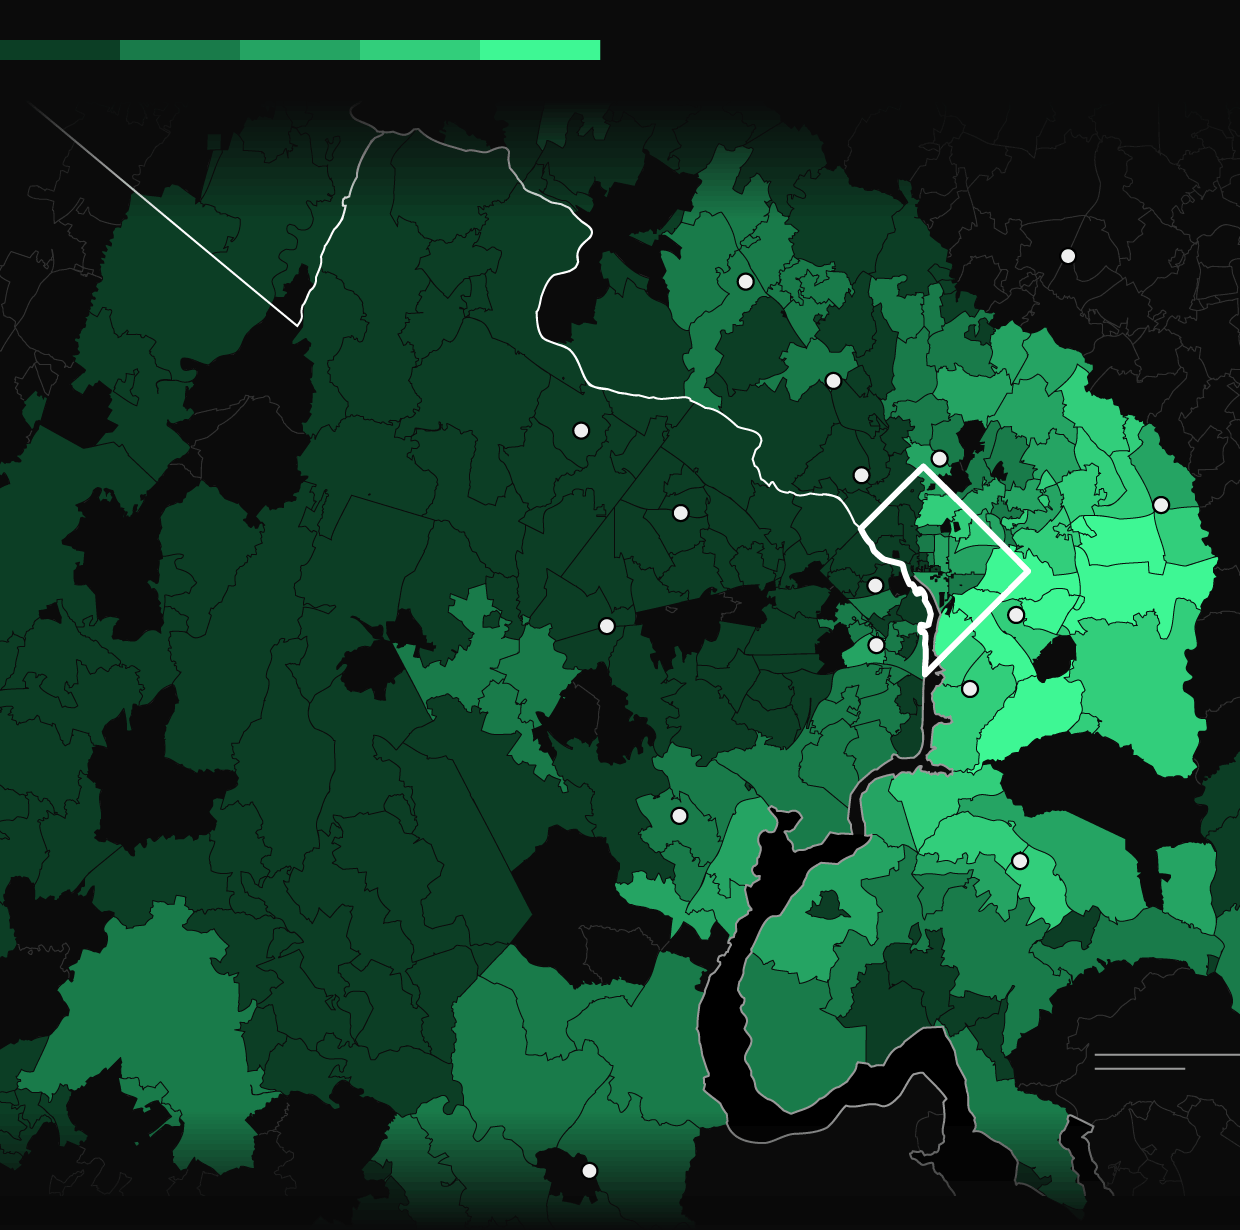
Typical home value (May 2021)
350K
500K
750K
$1M
west
Virginia
Baltimore
New $1M+
home areas
Germantown
maryland
Rockville
Ashburn
Silver
Spring
Bethesda
Annapolis
Bowie
Reston
Washington, D.C.
Virginia
Arlington
Suitland
Centreville
Majority-Black
zipcodes
Alexandria
Oxon Hill
Dale City
Waldorf
Chesapeake
Bay
10 miles
Fredericksburg
10 km
Typical home value (May 2021)
350K
500K
750K
$1M
west
Virginia
New $1M+
home areas
Baltimore
Germantown
maryland
Rockville
Silver
Spring
Ashburn
Bethesda
Annapolis
Bowie
Reston
Virginia
Washington, D.C.
Majority-Black
zipcodes
Suitland
Centreville
Arlington
Alexandria
Chesapeake
Bay
Oxon Hill
Dale City
Waldorf
Potomac River
10 miles
Fredericksburg
10 km
Typical home value (May 2021)
350K
500K
750K
$1M
west
Virginia
New $1M+
home areas
Germantown
maryland
Rockville
Silver
Spring
Ashburn
Bethesda
Bowie
Reston
Virginia
Washington, D.C.
Suitland
Centreville
Arlington
Alexandria
Oxon Hill
Dale City
Waldorf
Majority-Black
zipcodes
10 miles
Potomac River
10 km
Fredericksburg
Typical home value (May 2021)
350K
500K
750K
$1M
Baltimore
west
Virginia
New $1M+
home areas
Germantown
maryland
Rockville
Silver
Spring
Ashburn
Bethesda
Bowie
Reston
Virginia
Washington, D.C.
Suitland
Centreville
Arlington
Alexandria
Oxon Hill
Dale City
Waldorf
Majority-Black
zipcodes
10 miles
Fredericksburg
10 km
Typical home value (May 2021)
350K
500K
750K
$1M
Baltimore
New $1M+
home areas
Germantown
Rockville
Silver
Spring
Ashburn
Bethesda
Bowie
Reston
Washington, D.C.
Suitland
Centreville
Arlington
Alexandria
Virginia
Oxon Hill
Dale City
Waldorf
Majority-Black
zipcodes
10 miles
Fredericksburg
10 km
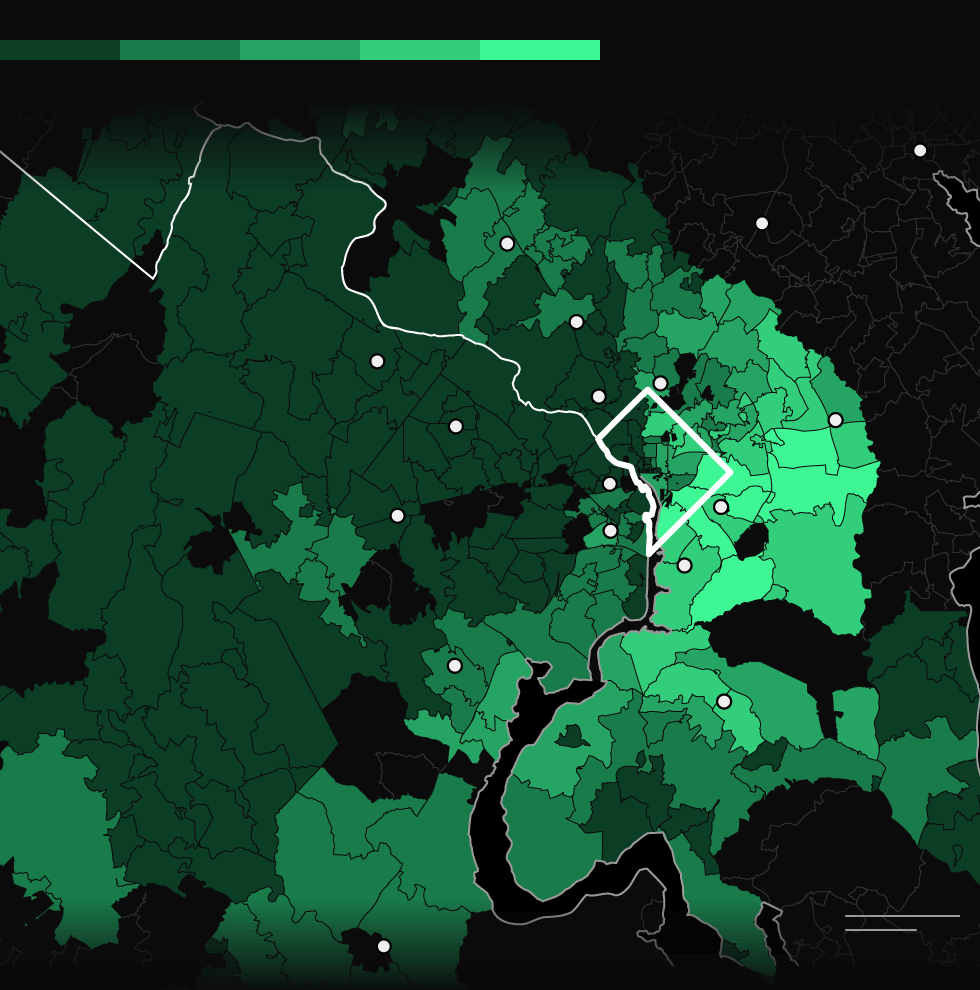
Home value change, May 2021 vs May 2020
0
+10
+15
+20%
west
Virginia
Baltimore
Columbia
Germantown
maryland
Rockville
Ashburn
Silver
Spring
Bethesda
Annapolis
Bowie
Reston
Washington, D.C.
Virginia
Arlington
Suitland
Centreville
Majority-Black
zipcodes
Alexandria
Oxon Hill
Dale City
Waldorf
Chesapeake
Bay
10 miles
Fredericksburg
10 km
Home value change, May 2021 vs May 2020
0
+10
+15
+20%
west
Virginia
Baltimore
Columbia
Germantown
maryland
Rockville
Silver
Spring
Ashburn
Bethesda
Annapolis
Bowie
Reston
Virginia
Washington, D.C.
Majority-Black
zipcodes
Suitland
Centreville
Arlington
Alexandria
Chesapeake
Bay
Oxon Hill
Dale City
Waldorf
Potomac River
10 miles
Fredericksburg
10 km
Home value change, May 2021 vs May 2020
0
+10
+15
+20%
west
Virginia
Columbia
Germantown
maryland
Rockville
Silver
Spring
Ashburn
Bethesda
Bowie
Reston
Virginia
Washington, D.C.
Suitland
Centreville
Arlington
Alexandria
Oxon Hill
Dale City
Waldorf
Majority-Black
zipcodes
10 miles
Potomac River
10 km
Fredericksburg
Home value change, May 2021 vs May 2020
0
+10
+15
+20%
Baltimore
west
Virginia
Columbia
Germantown
maryland
Rockville
Silver
Spring
Ashburn
Bethesda
Bowie
Reston
Virginia
Washington, D.C.
Suitland
Centreville
Arlington
Alexandria
Oxon Hill
Dale City
Waldorf
Majority-Black
zipcodes
10 miles
Fredericksburg
10 km
Home value change, May 2021 vs May 2020
0
+10
+15
+20%
Baltimore
maryland
Germantown
Rockville
Silver
Spring
Ashburn
Bethesda
Bowie
Reston
Washington, D.C.
Suitland
Centreville
Arlington
Alexandria
Virginia
Oxon Hill
Dale City
Waldorf
Majority-Black
zipcodes
10 miles
Fredericksburg
10 km
Share of homes worth at least twice their mortgage (Q1 2021)
15
20
30
40%
west
Virginia
Baltimore
Columbia
Germantown
maryland
Rockville
Ashburn
Silver
Spring
Bethesda
Annapolis
Bowie
Reston
Washington, D.C.
Virginia
Arlington
Suitland
Centreville
Majority-Black
zipcodes
Alexandria
Oxon Hill
Dale City
Waldorf
Chesapeake
Bay
10 miles
Fredericksburg
10 km
Share of homes worth at least twice their mortgage (Q1 2021)
15
20
30
40%
west
Virginia
Baltimore
Columbia
Germantown
maryland
Rockville
Silver
Spring
Ashburn
Bethesda
Annapolis
Bowie
Reston
Virginia
Washington, D.C.
Majority-Black
zipcodes
Suitland
Centreville
Arlington
Alexandria
Chesapeake
Bay
Oxon Hill
Dale City
Waldorf
Potomac River
10 miles
Fredericksburg
10 km
Share of homes worth at least twice their mortgage (Q1 2021)
15
20
30
40%
west
Virginia
Columbia
Germantown
maryland
Rockville
Silver
Spring
Ashburn
Bethesda
Bowie
Reston
Virginia
Washington, D.C.
Suitland
Centreville
Arlington
Alexandria
Oxon Hill
Dale City
Waldorf
Majority-Black
zipcodes
10 miles
Potomac River
10 km
Fredericksburg
Share of homes worth at least twice their mortgage (Q1 2021)
15
20
30
40%
Baltimore
west
Virginia
Columbia
Germantown
maryland
Rockville
Silver
Spring
Ashburn
Bethesda
Bowie
Reston
Virginia
Washington, D.C.
Suitland
Centreville
Arlington
Alexandria
Oxon Hill
Dale City
Waldorf
Majority-Black
zipcodes
10 miles
Fredericksburg
10 km
Share of homes worth at least twice the mortgage (2021)
15
20
30
40%
Baltimore
maryland
Germantown
Rockville
Silver
Spring
Ashburn
Bethesda
Bowie
Reston
Washington, D.C.
Suitland
Centreville
Arlington
Alexandria
Virginia
Oxon Hill
Dale City
Waldorf
Majority-Black
zipcodes
10 miles
Fredericksburg
10 km
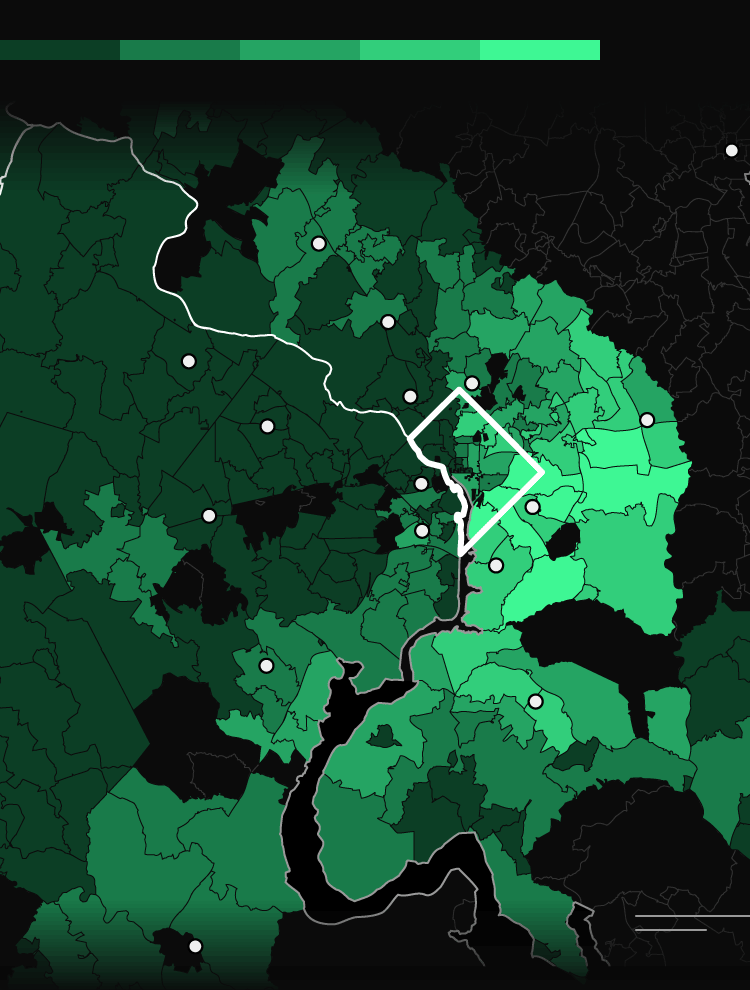
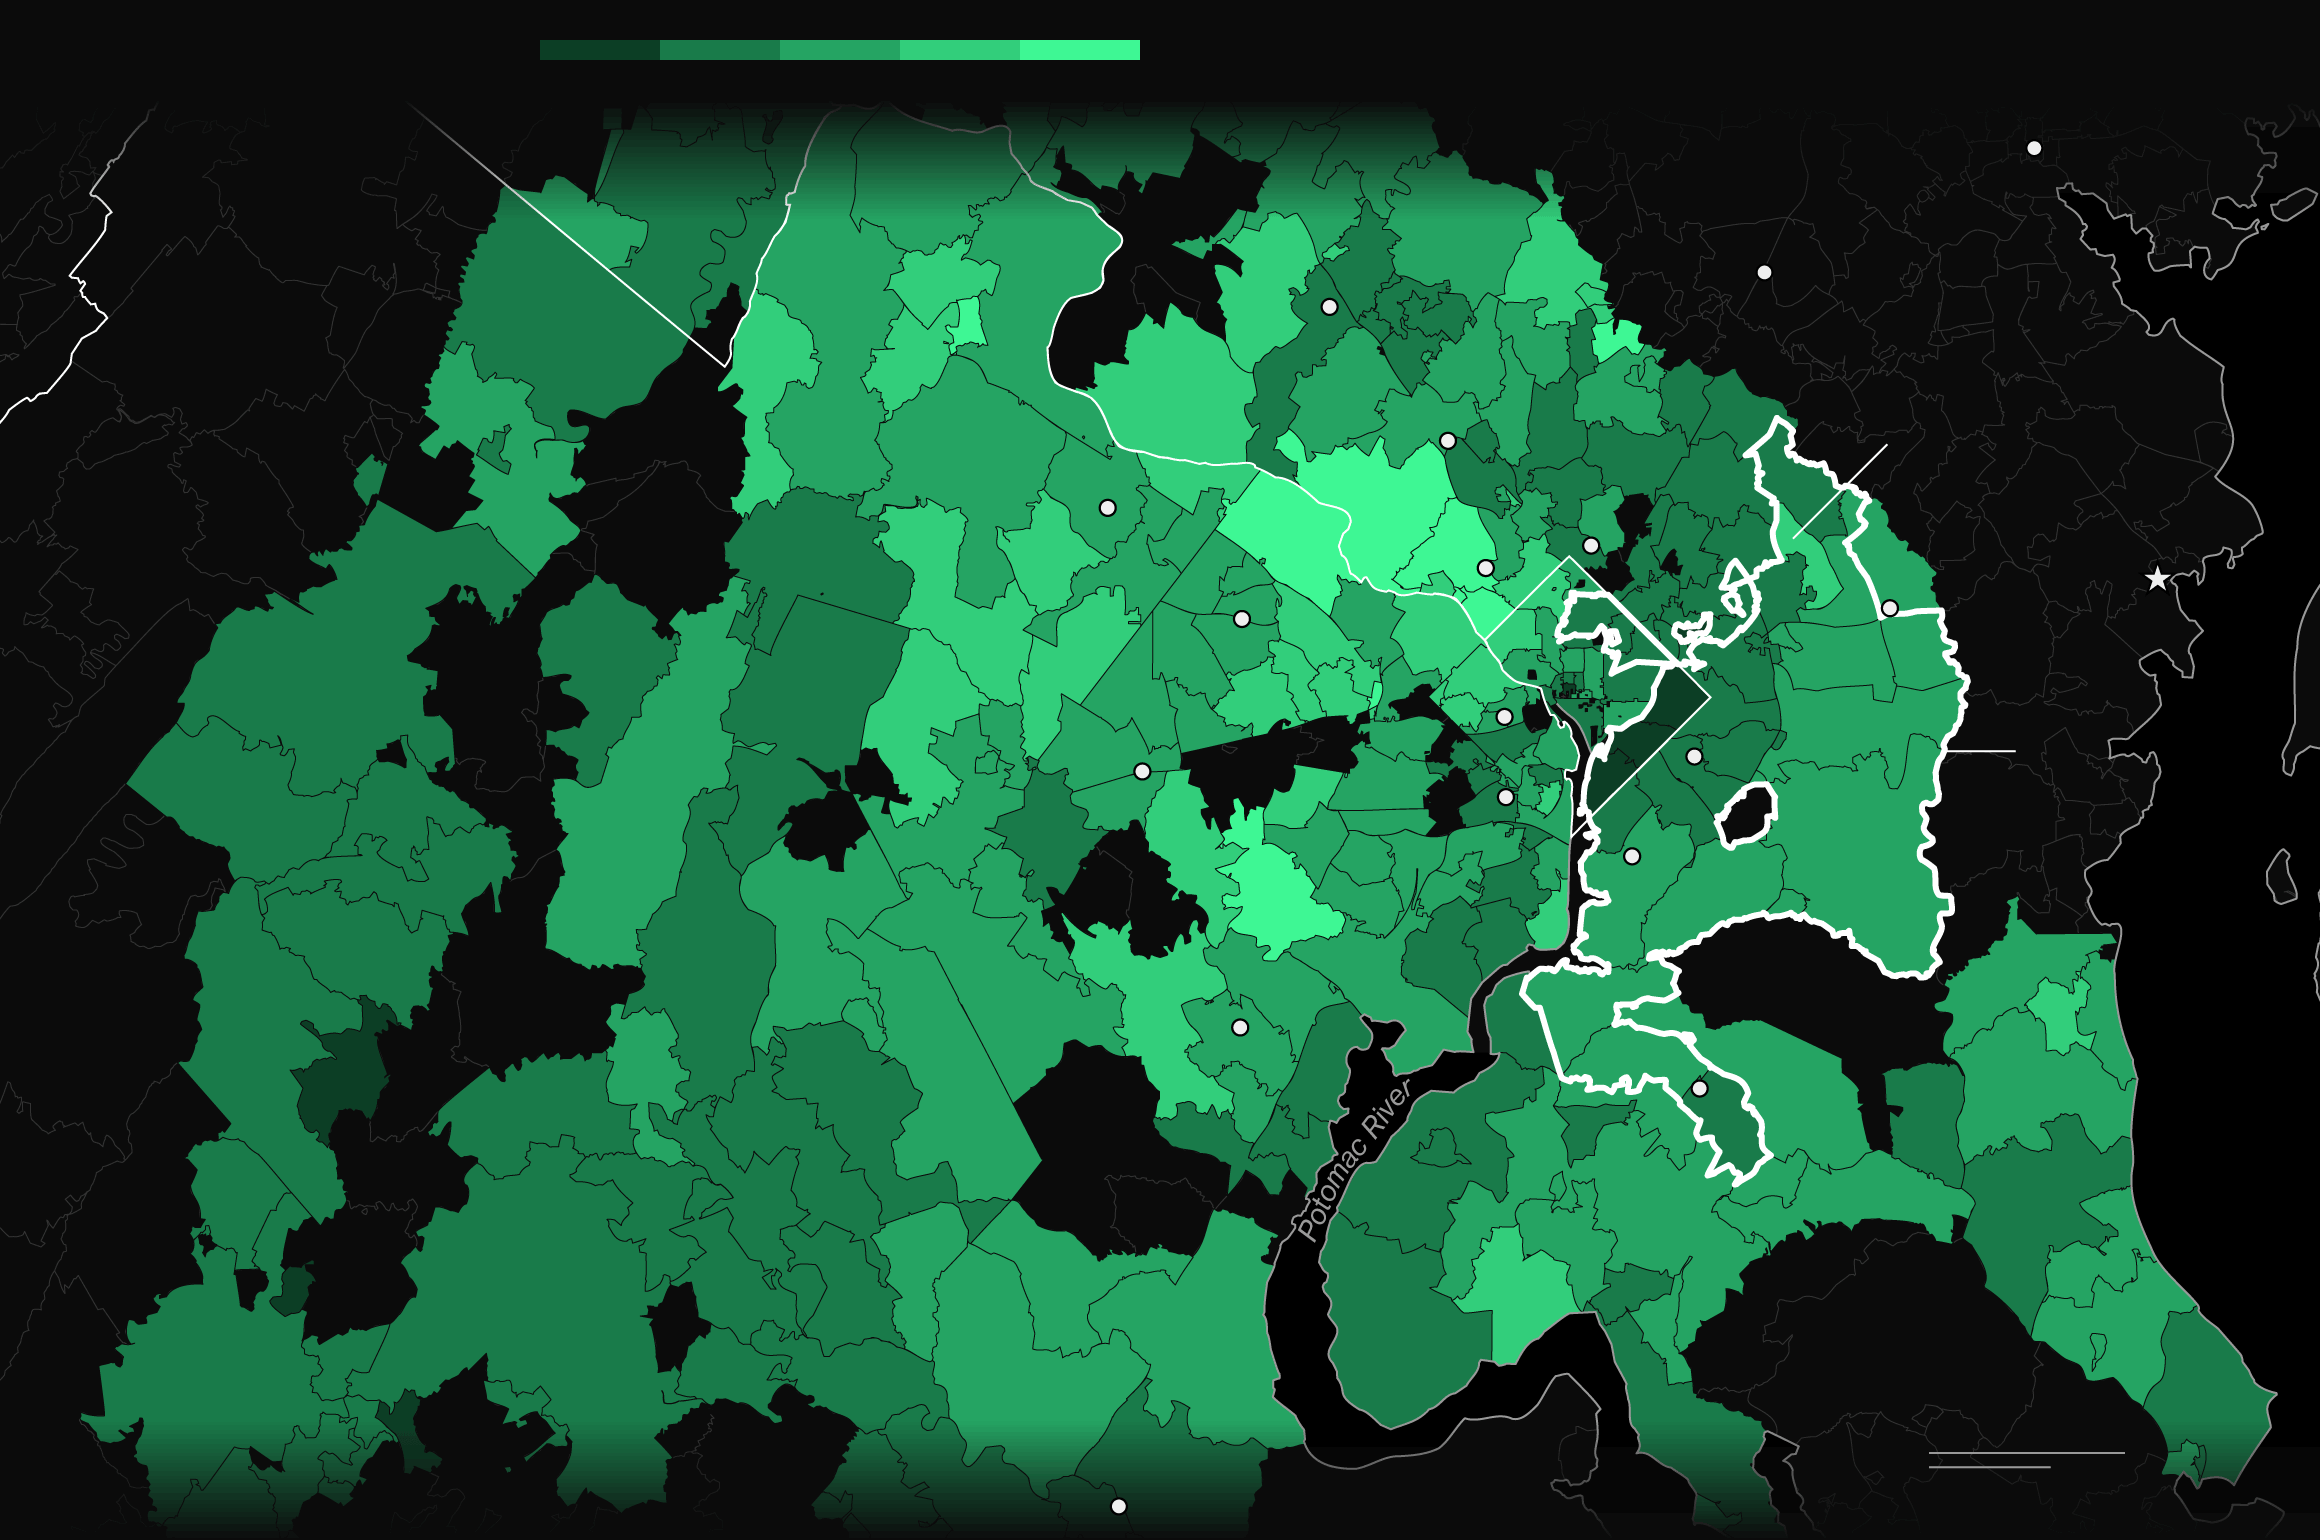
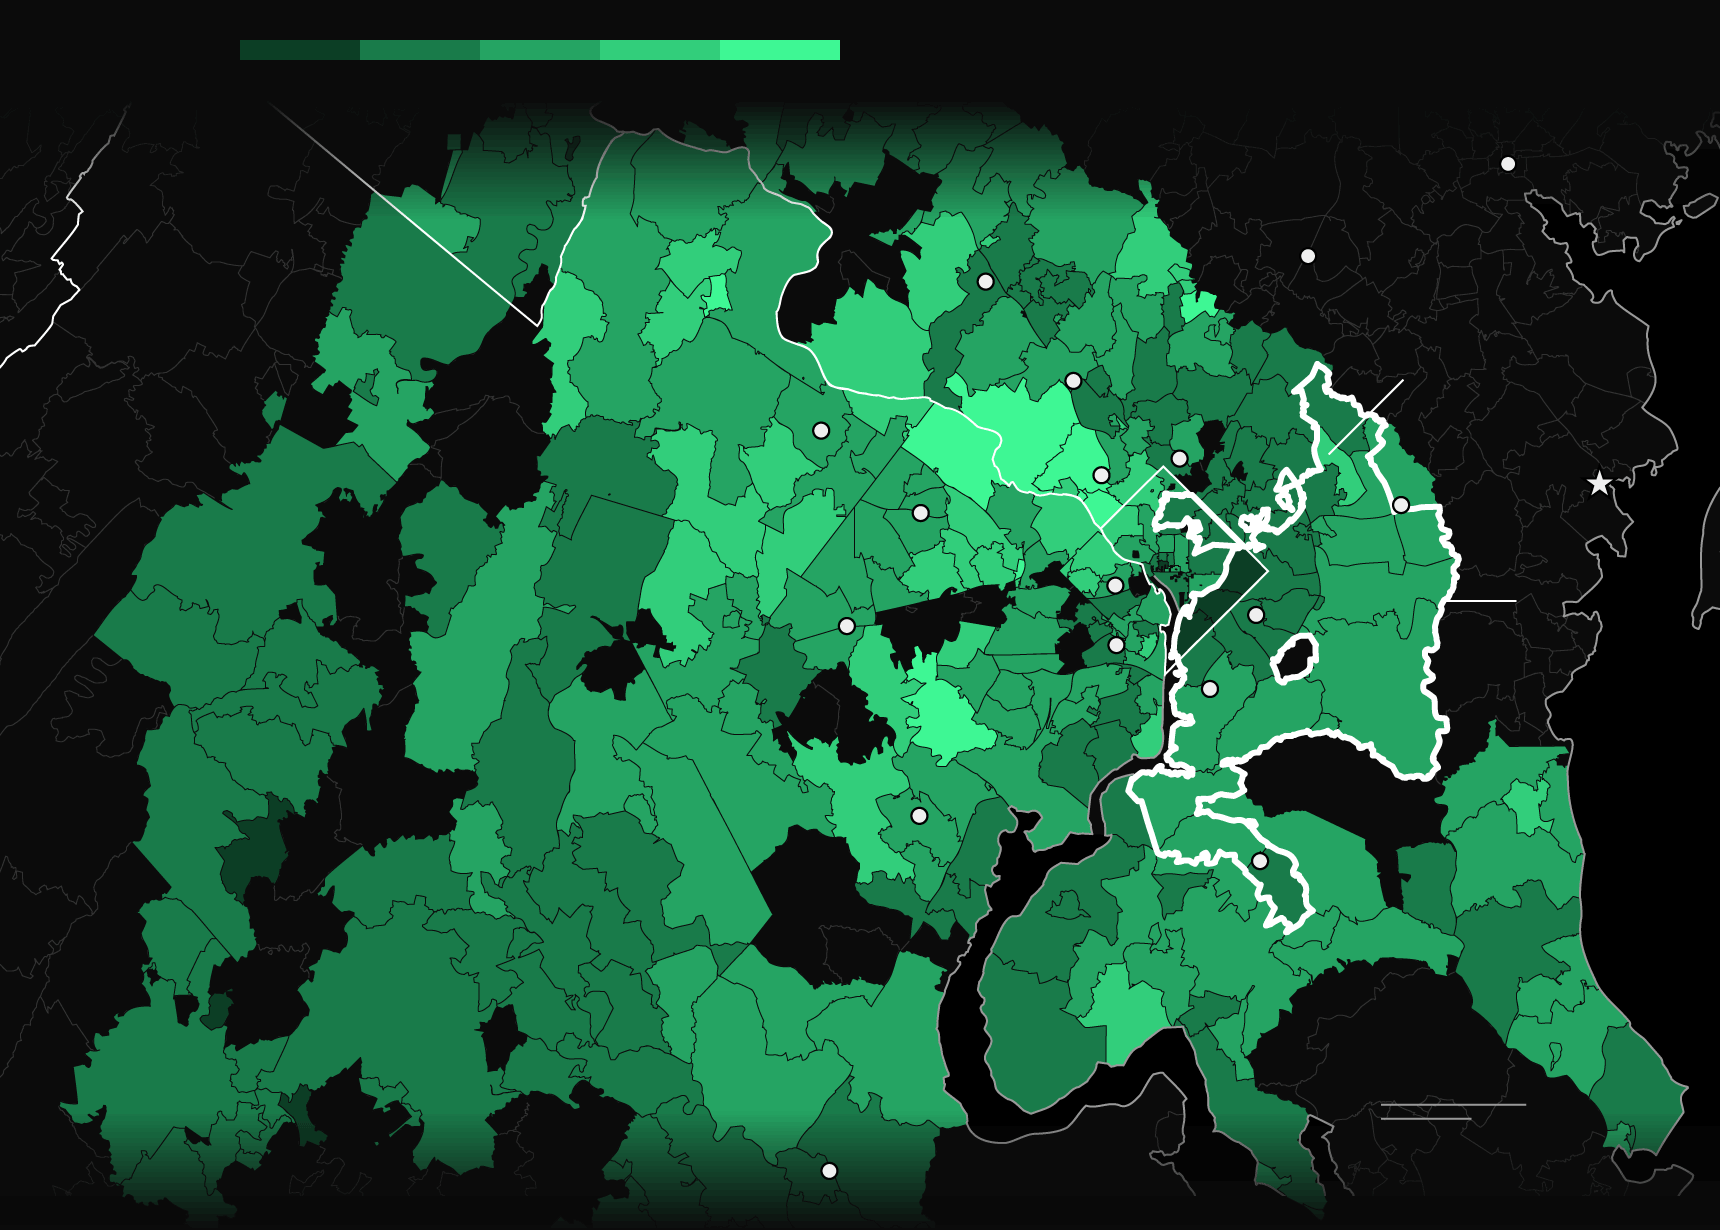
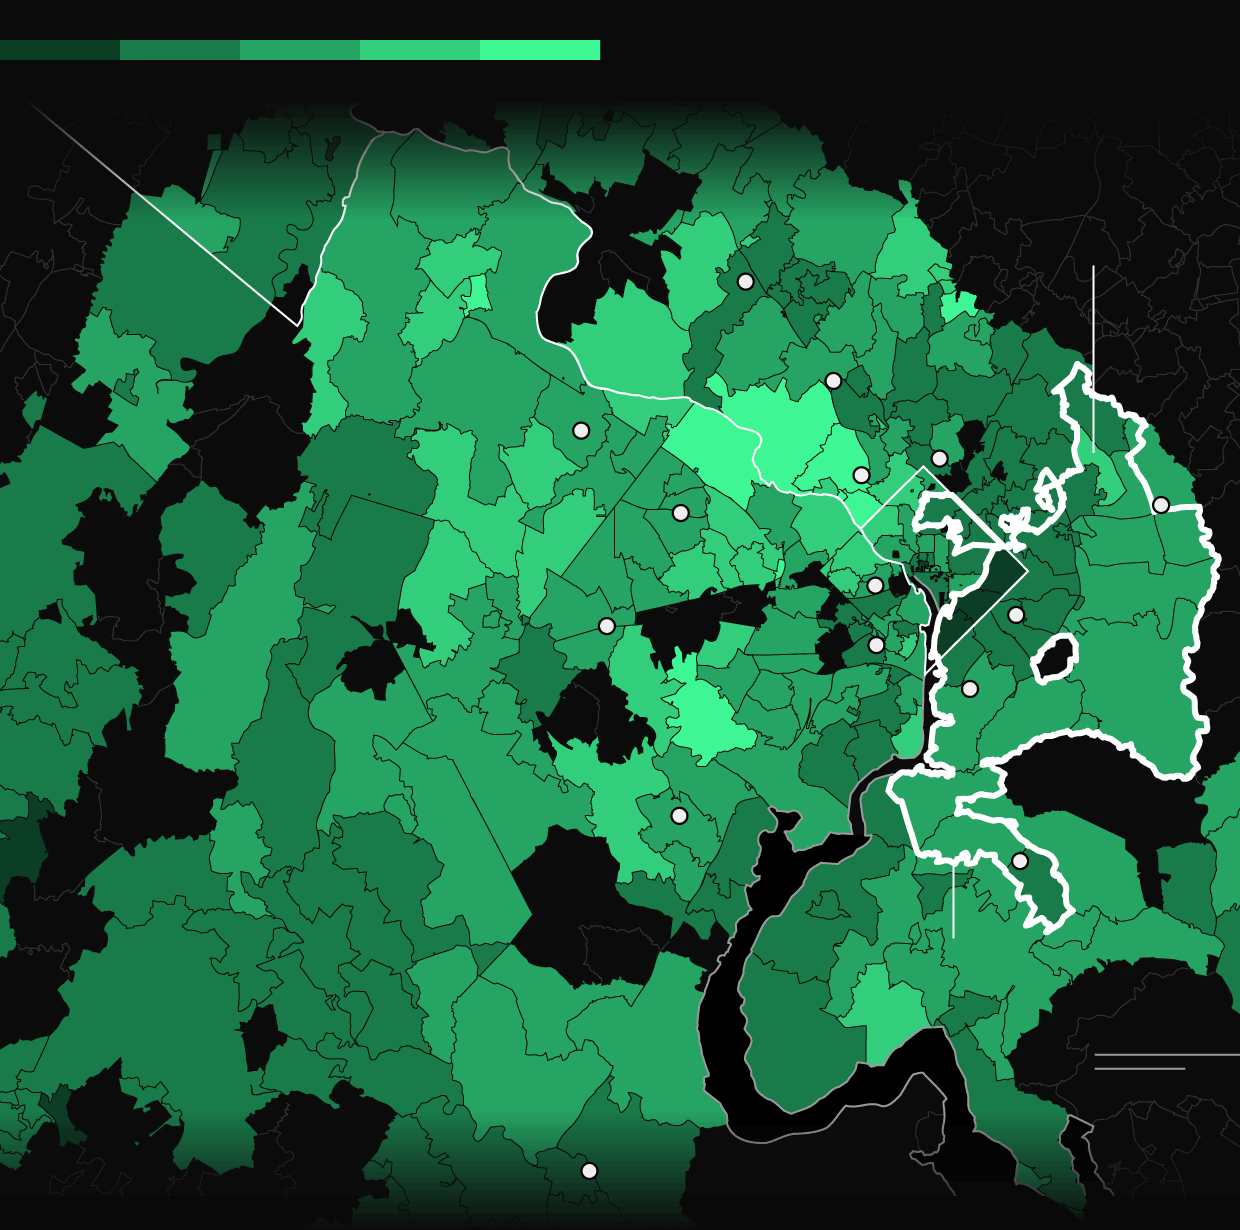
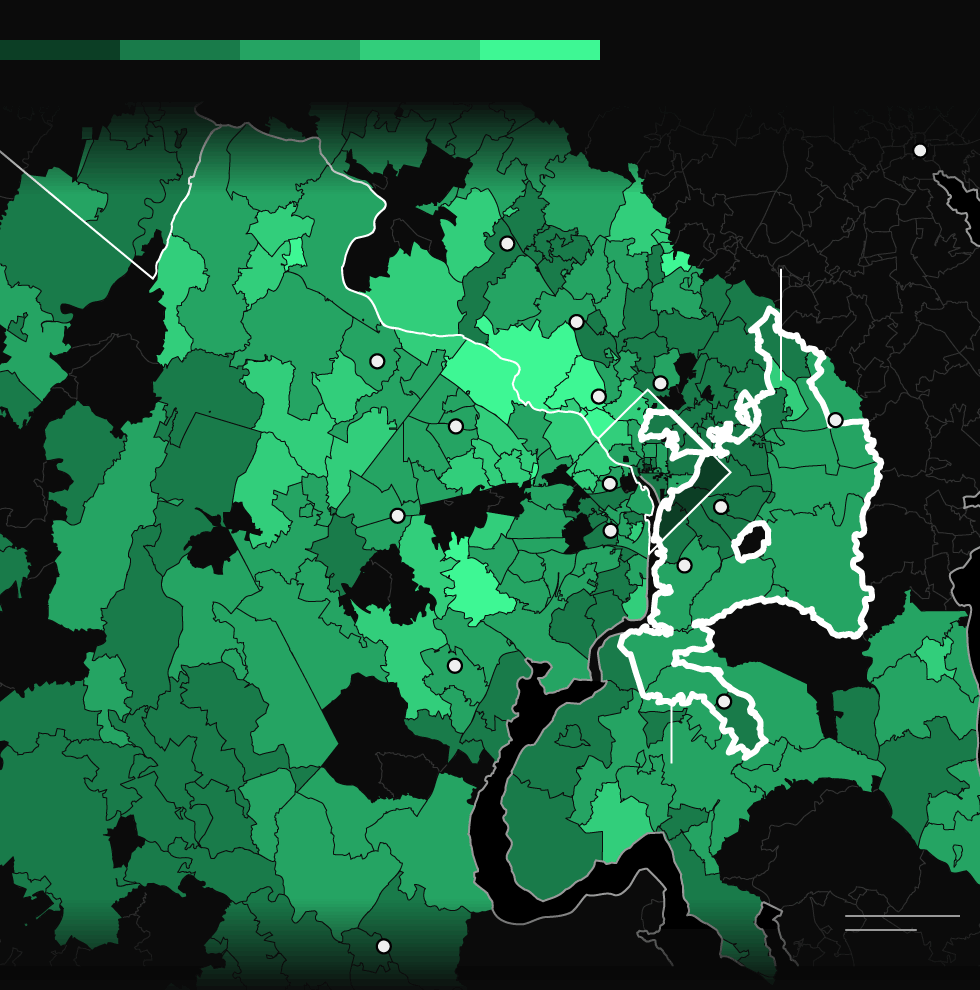
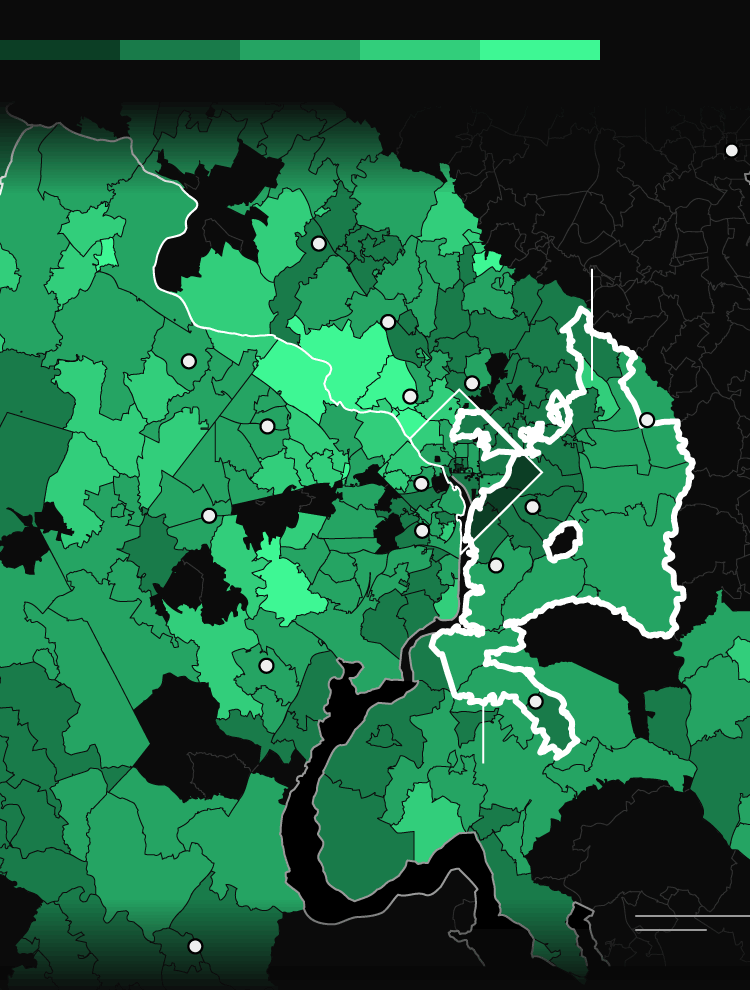
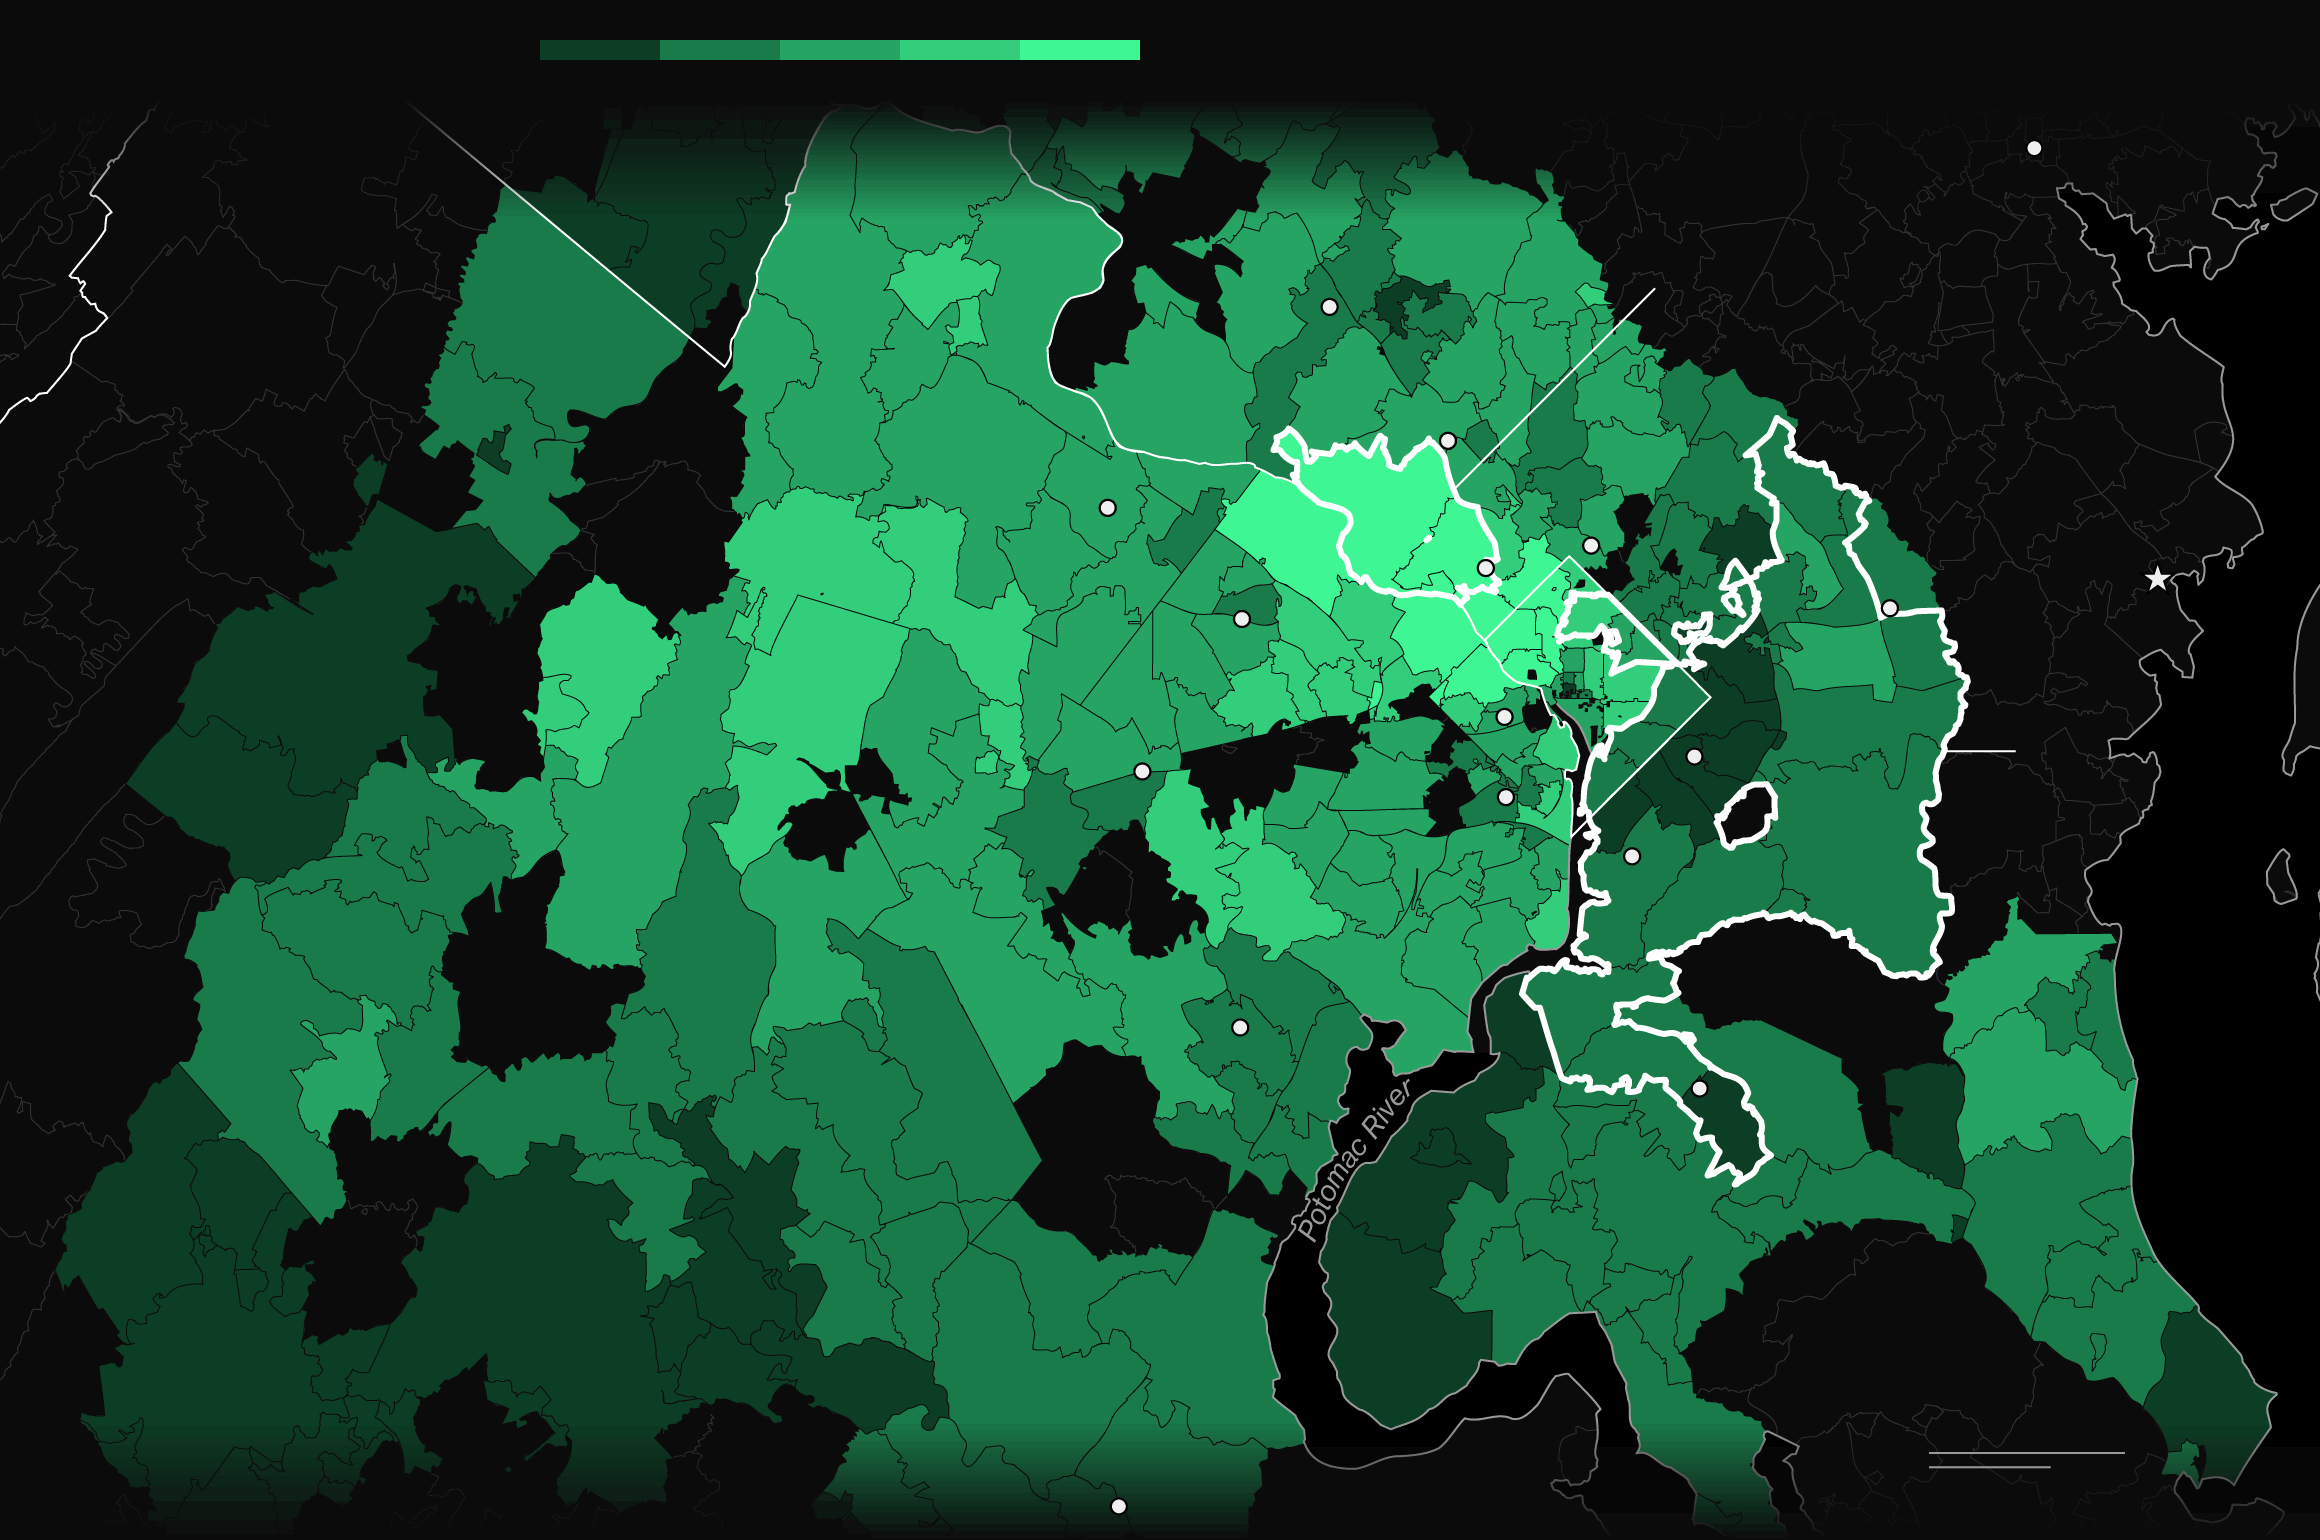
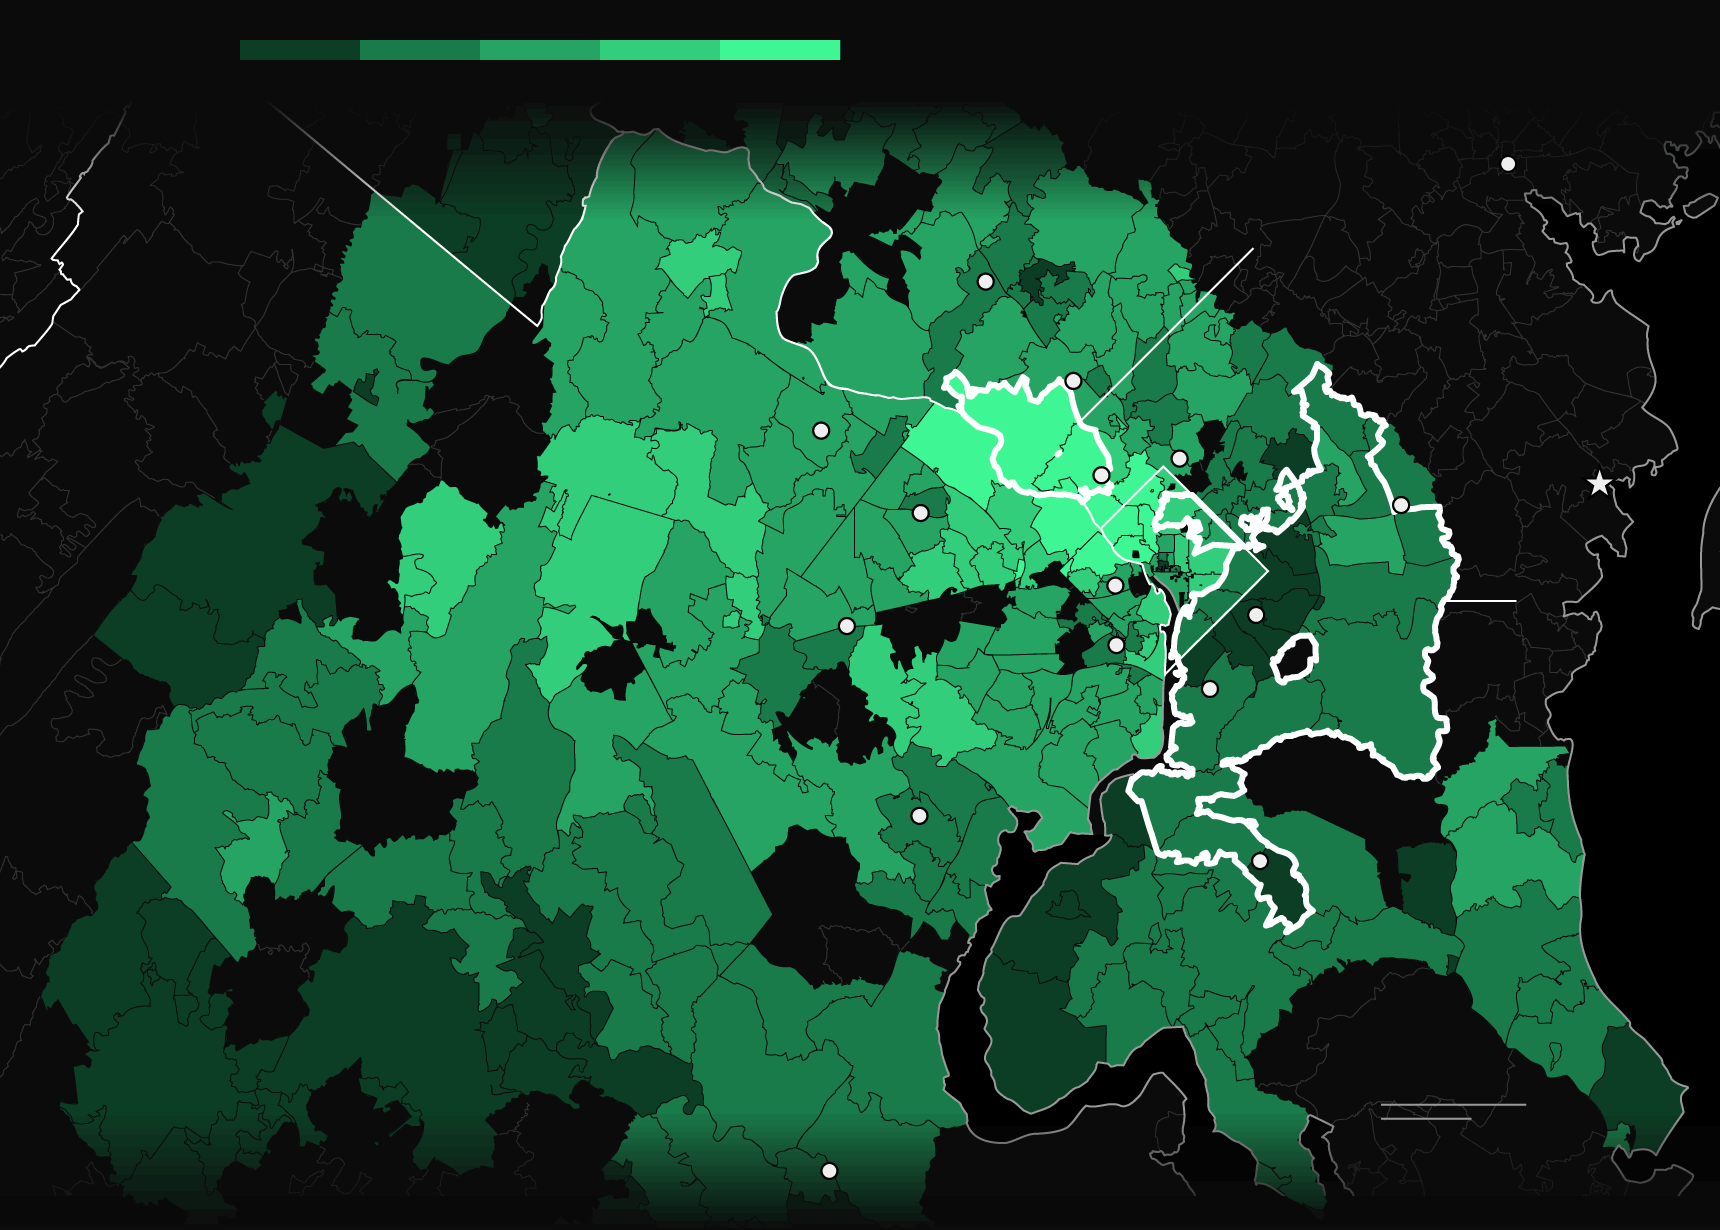
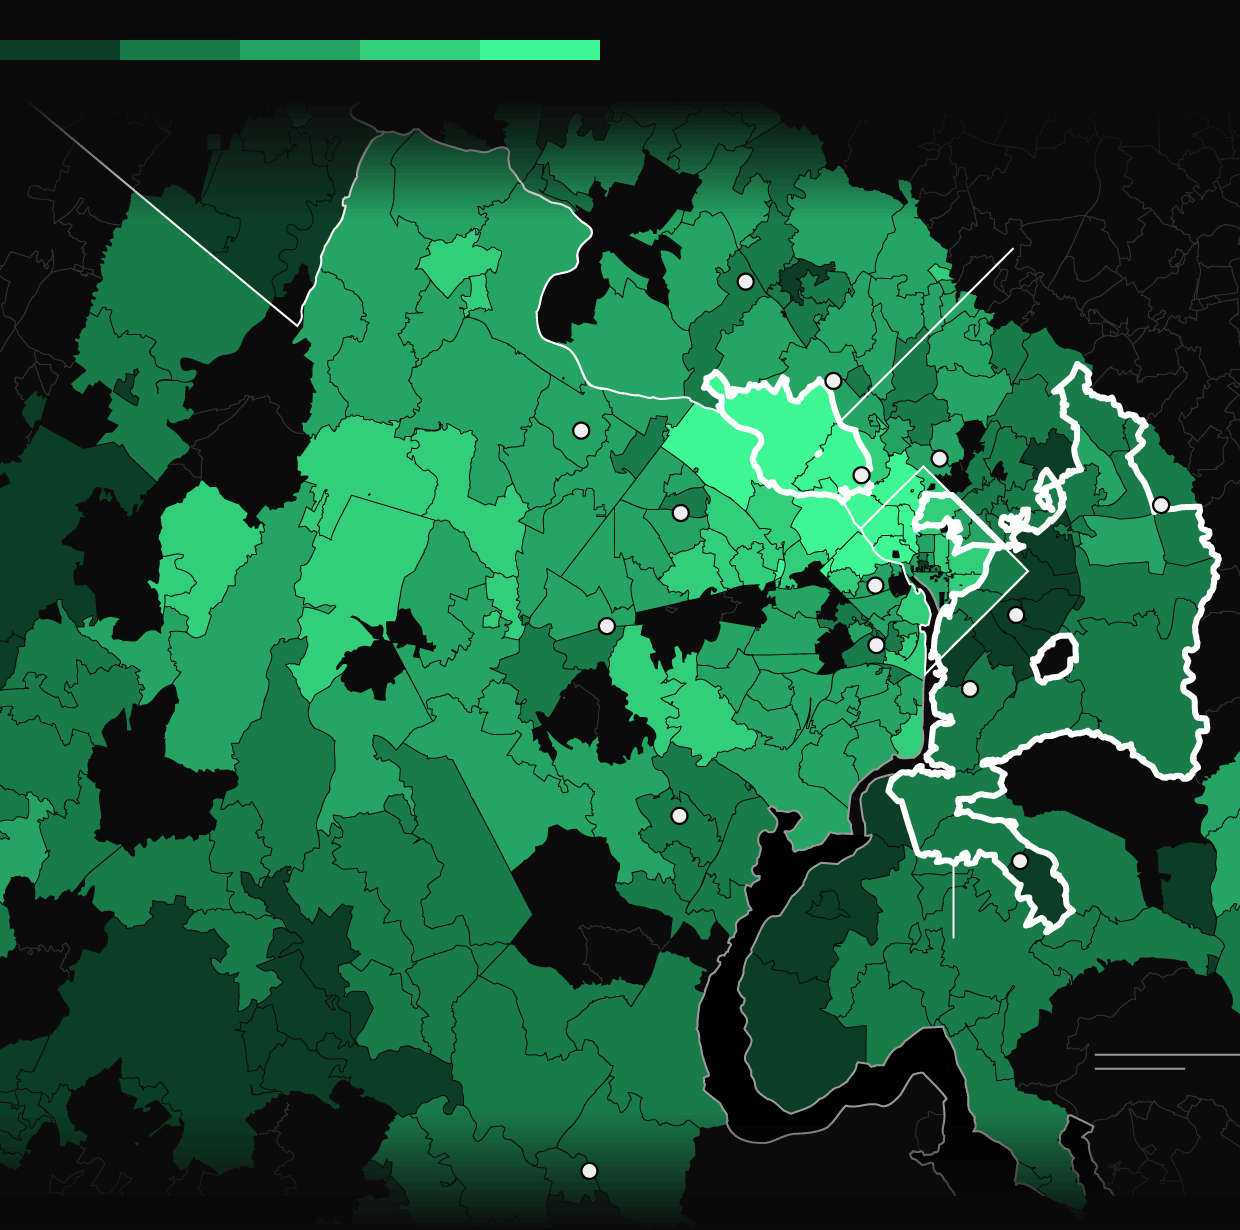
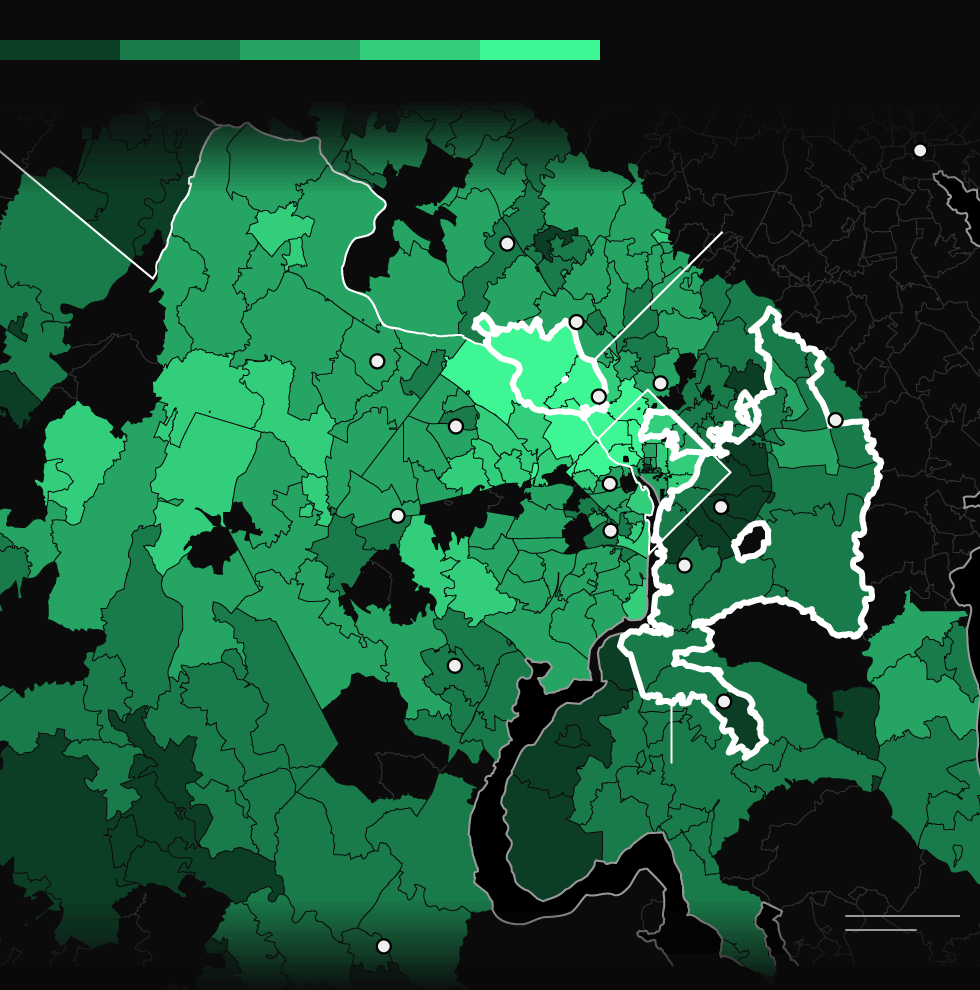
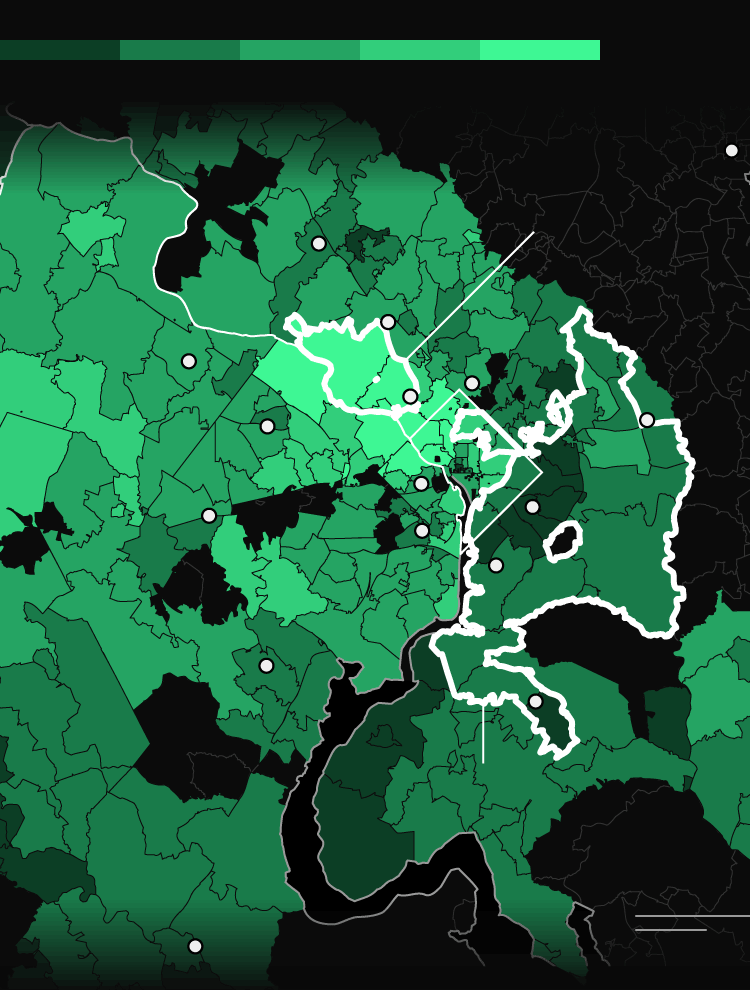
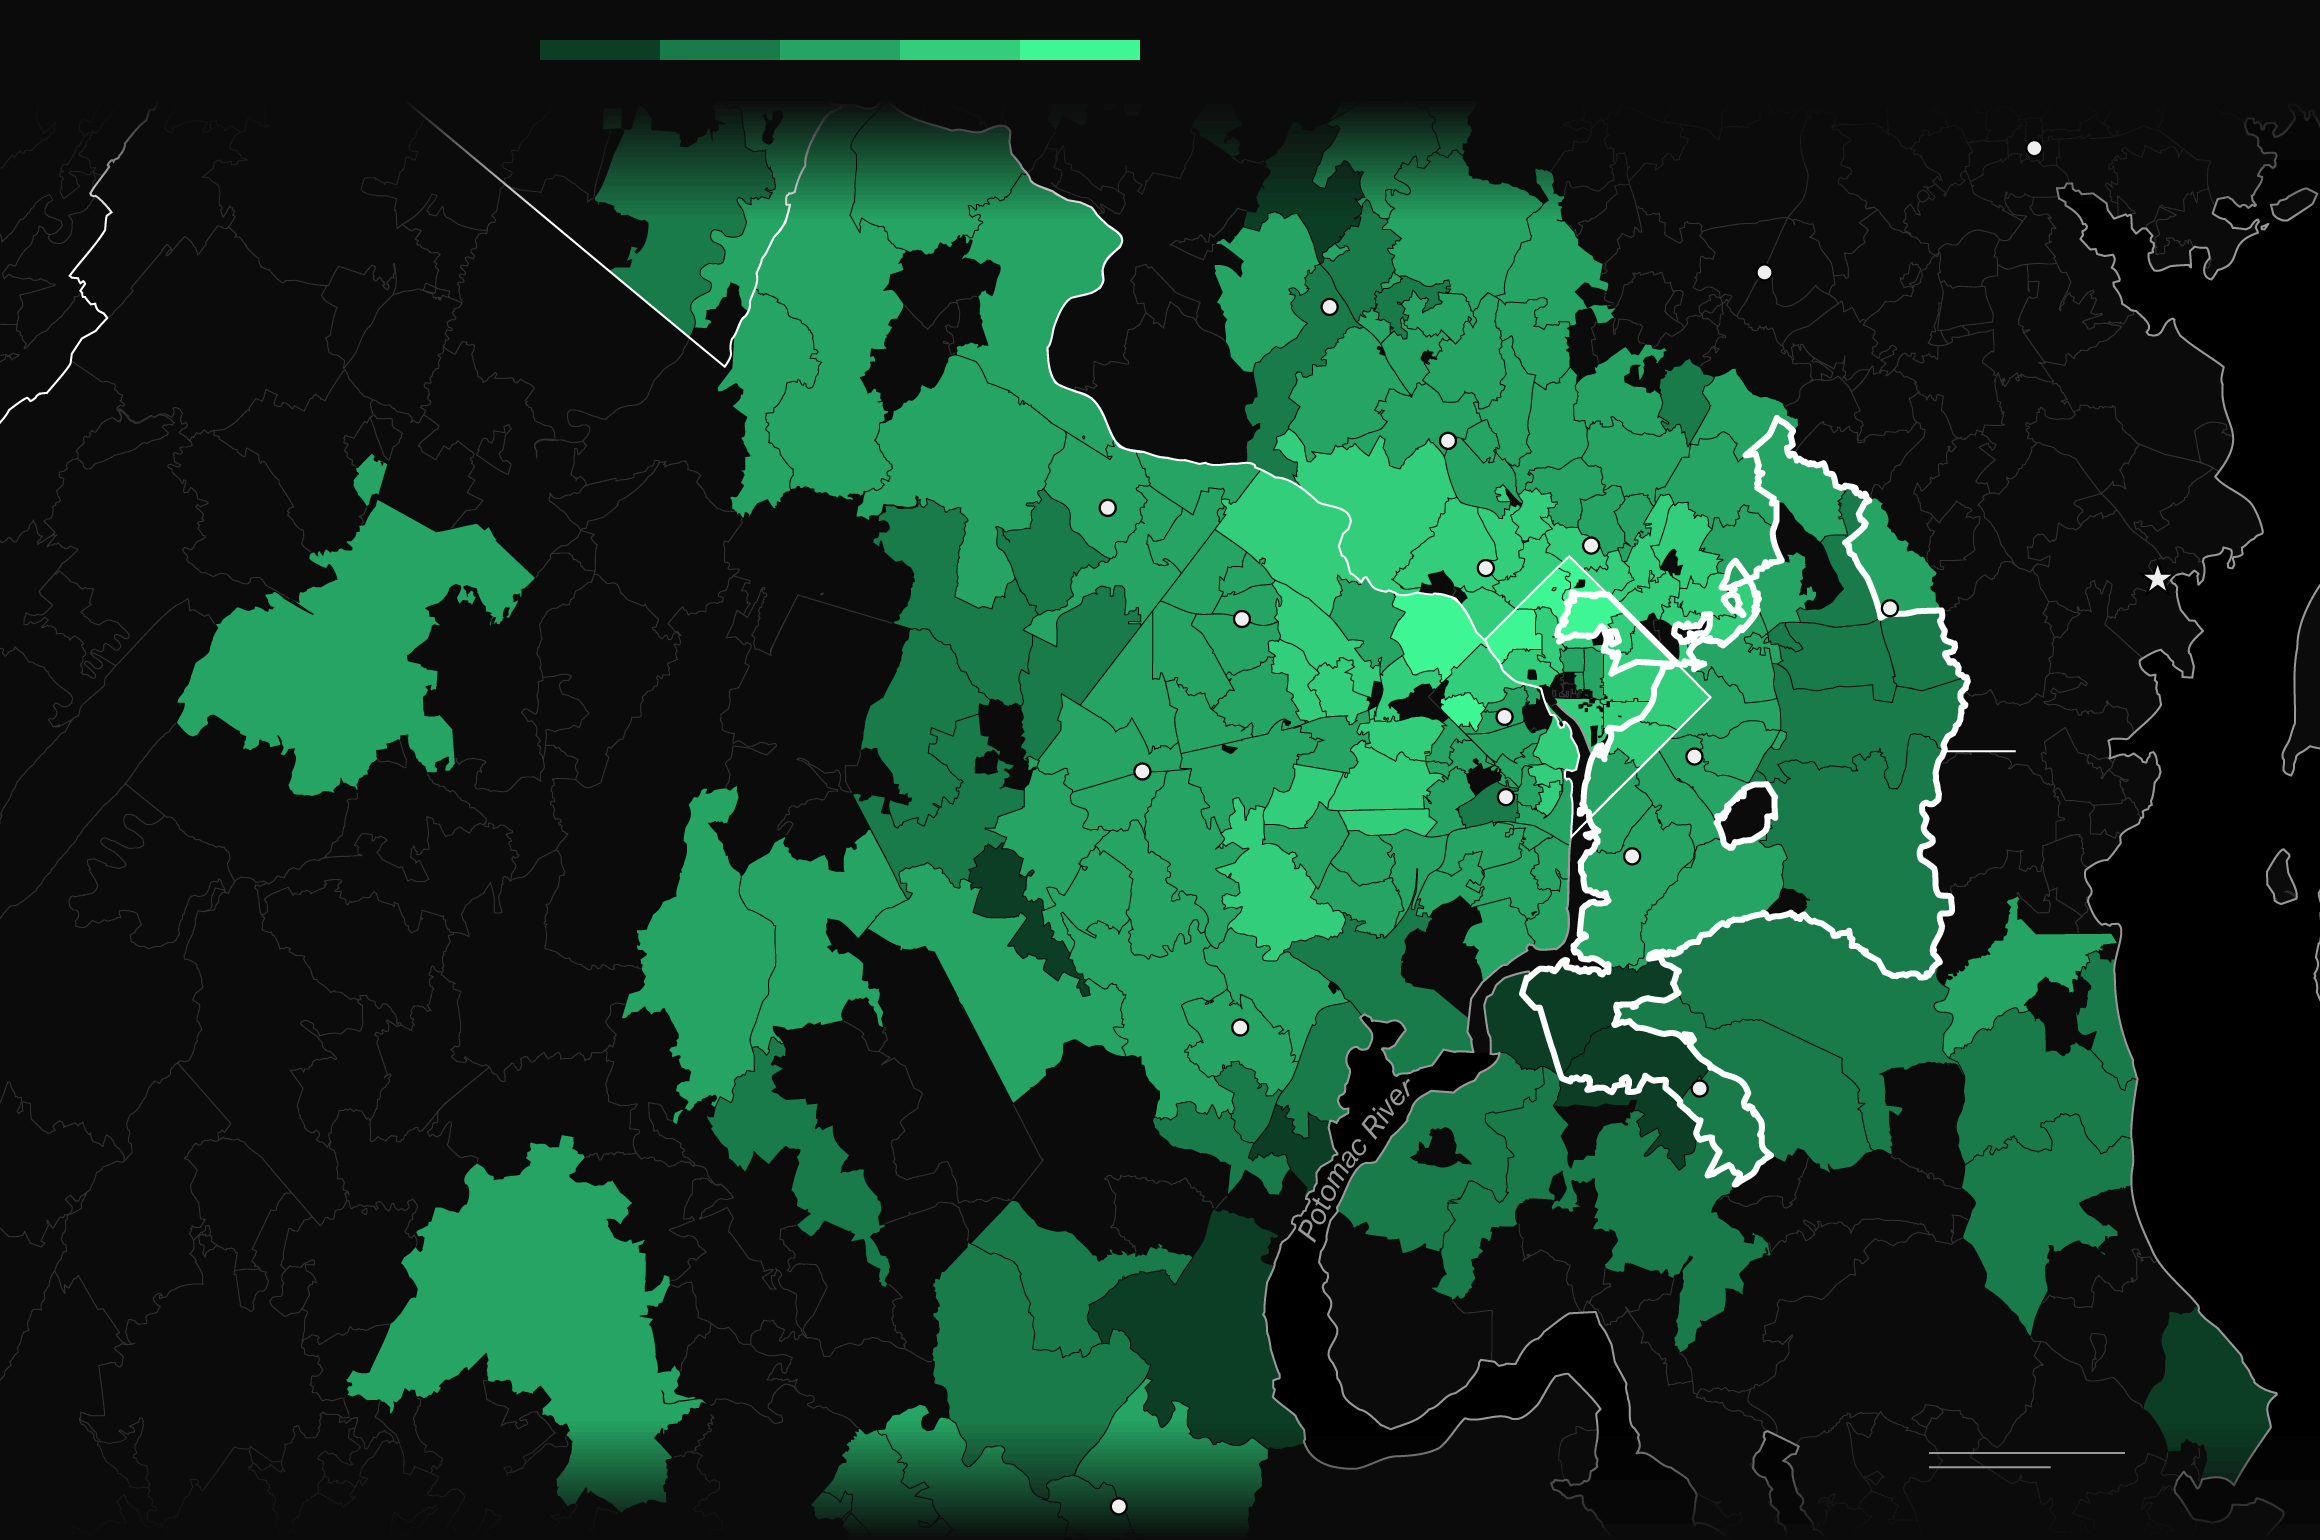
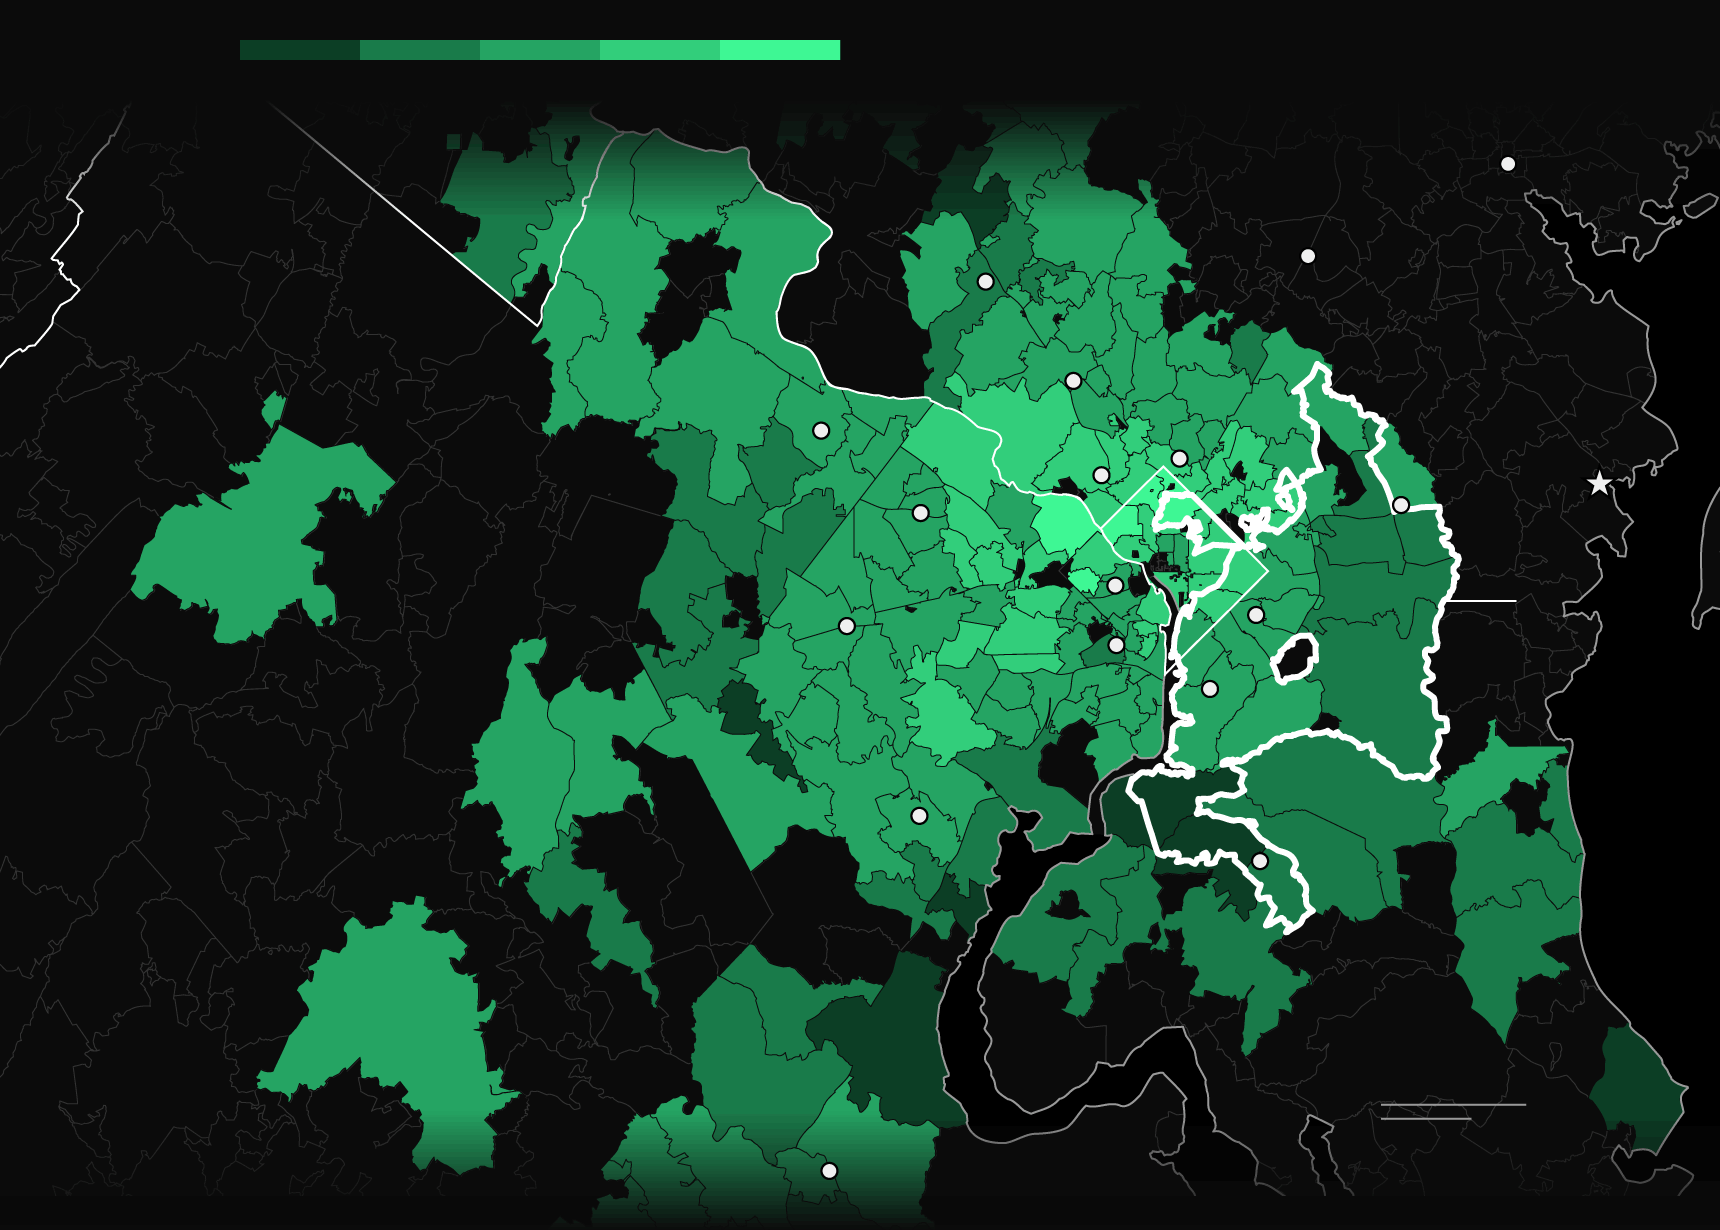
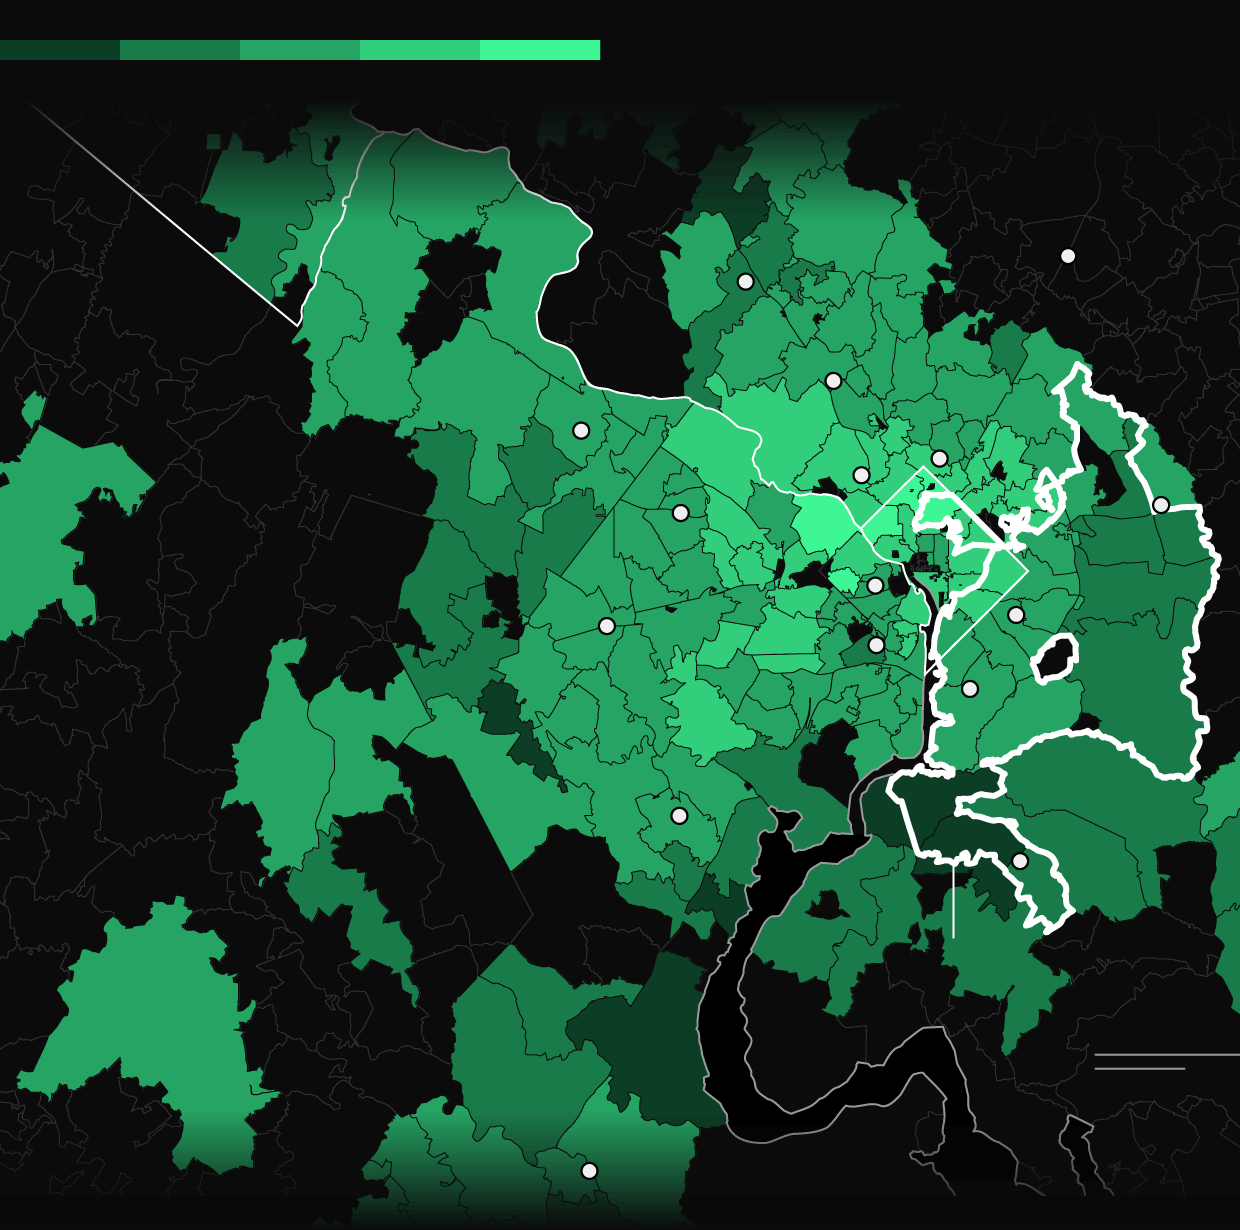
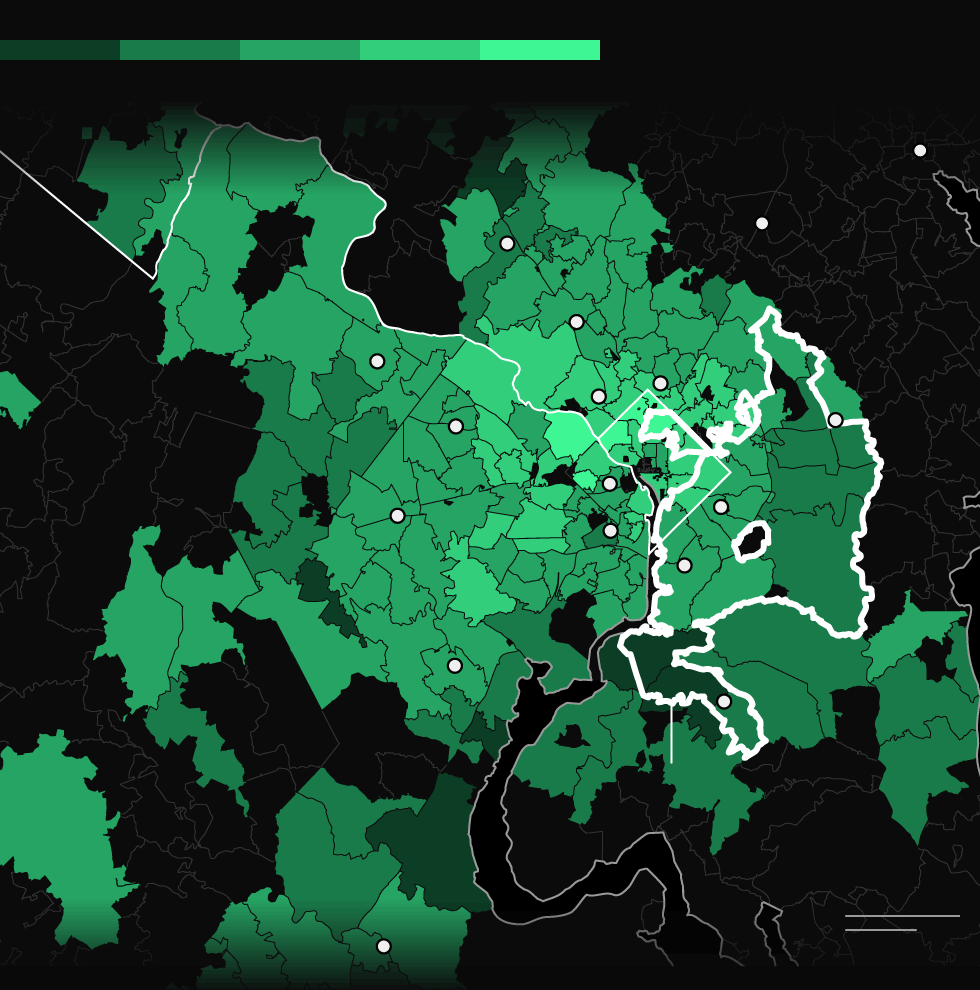
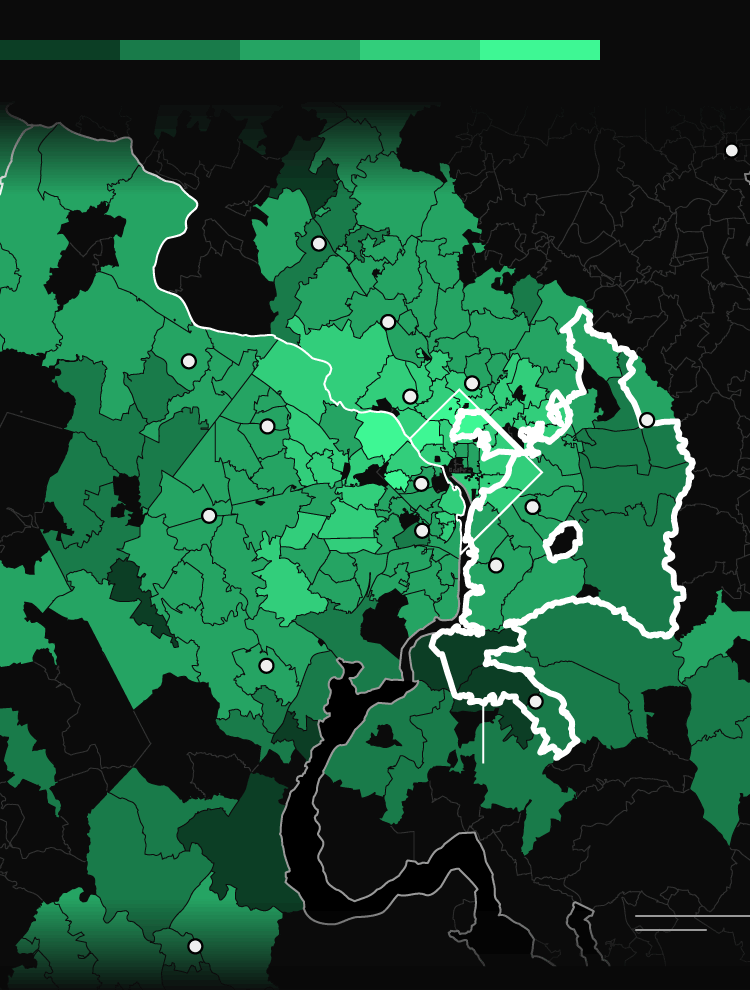
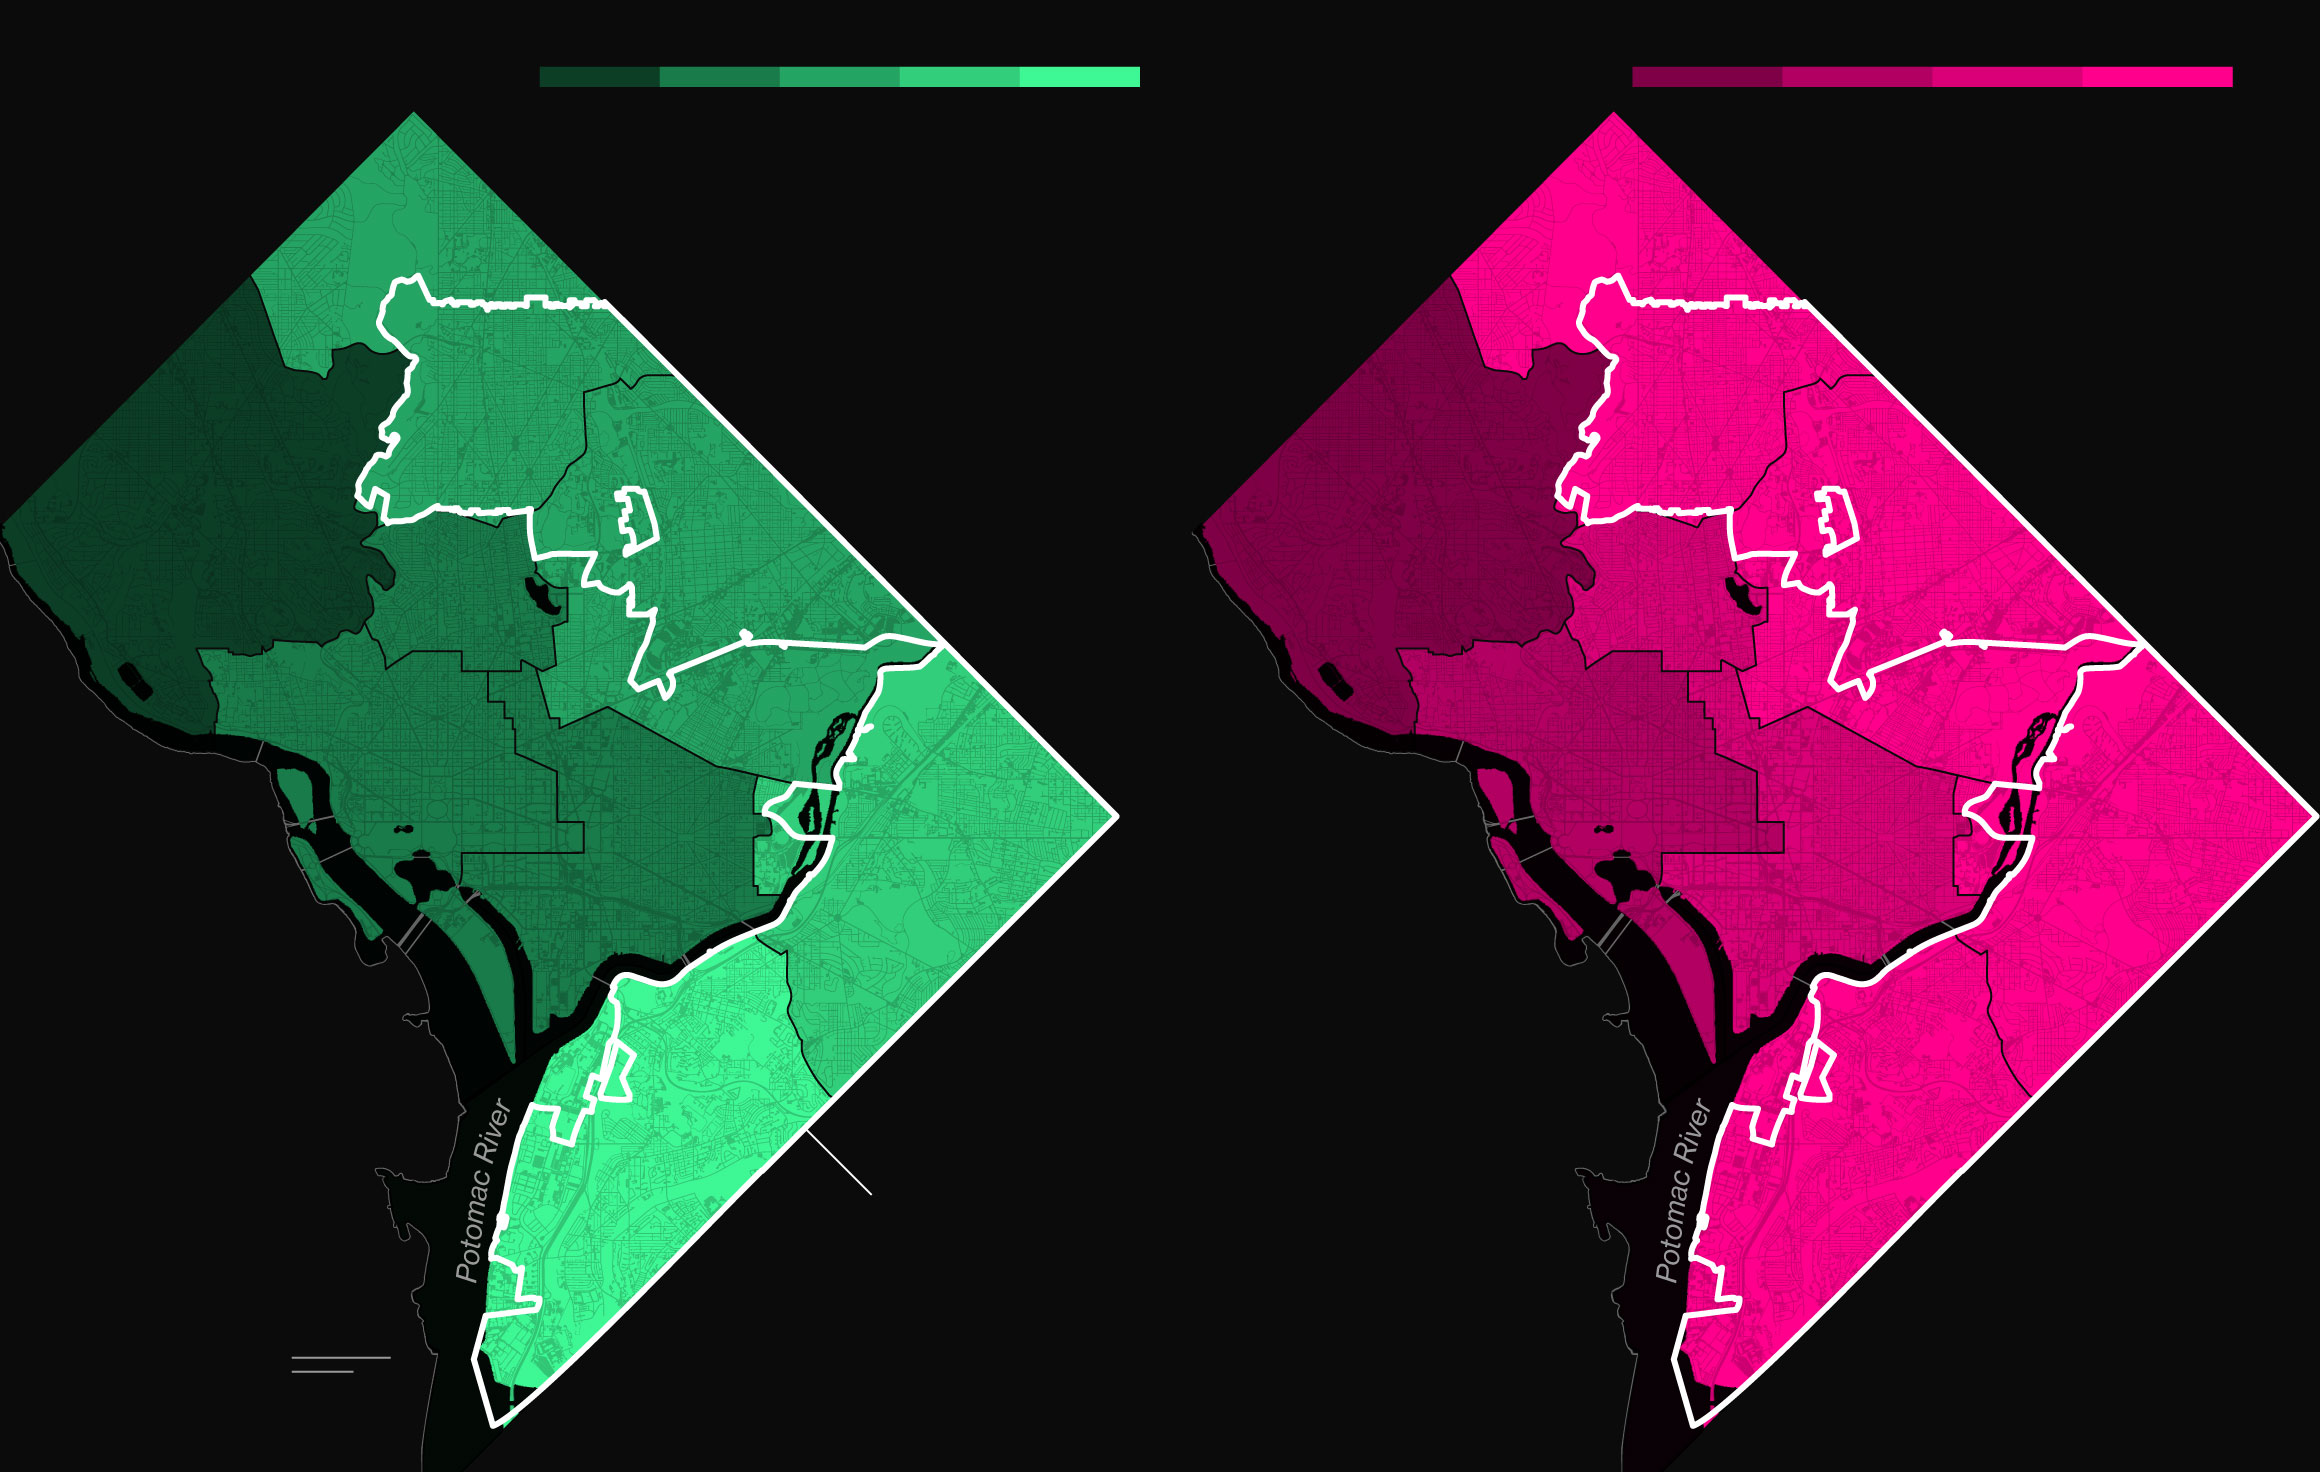
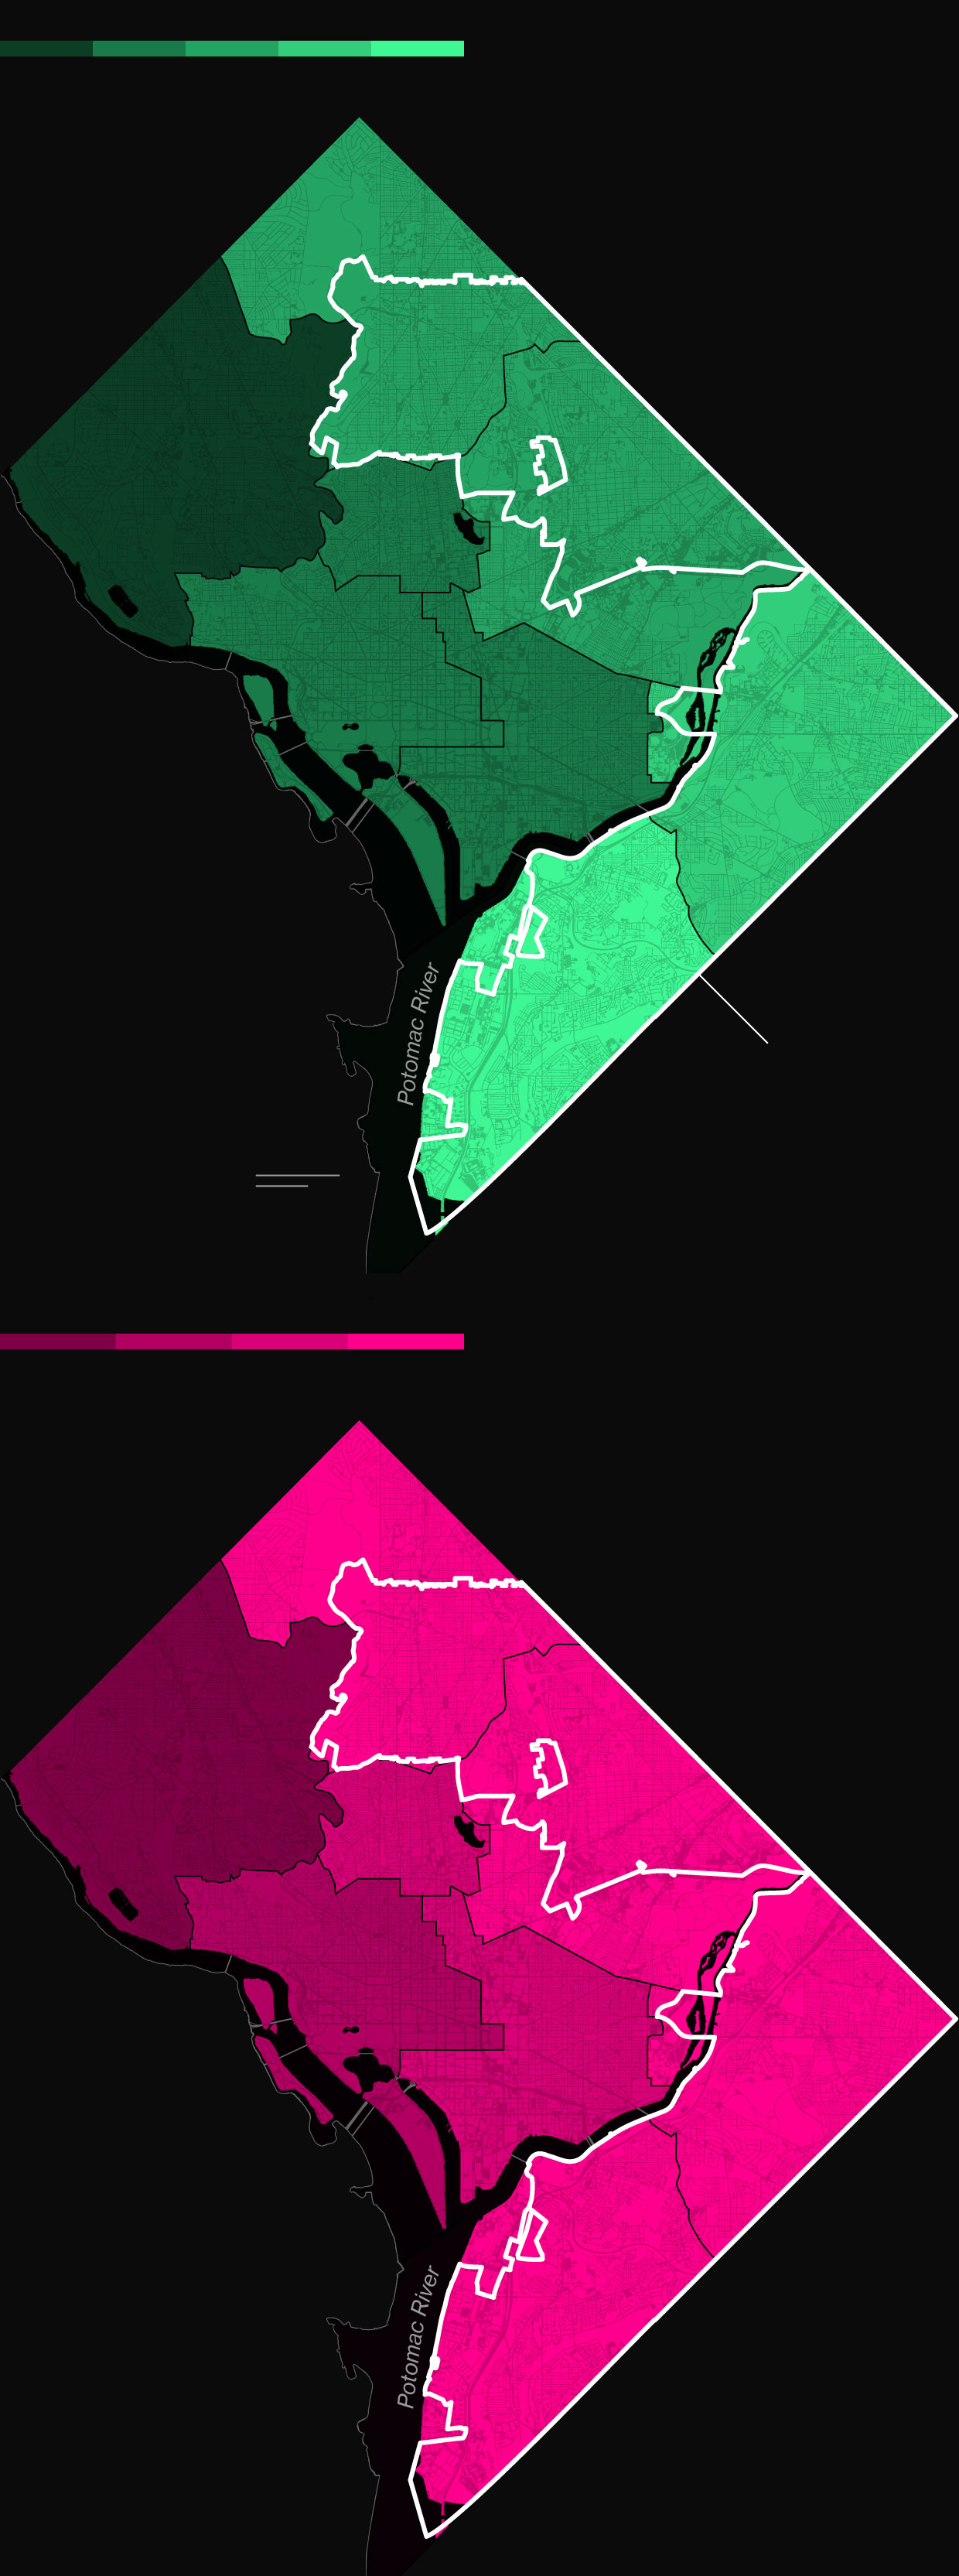
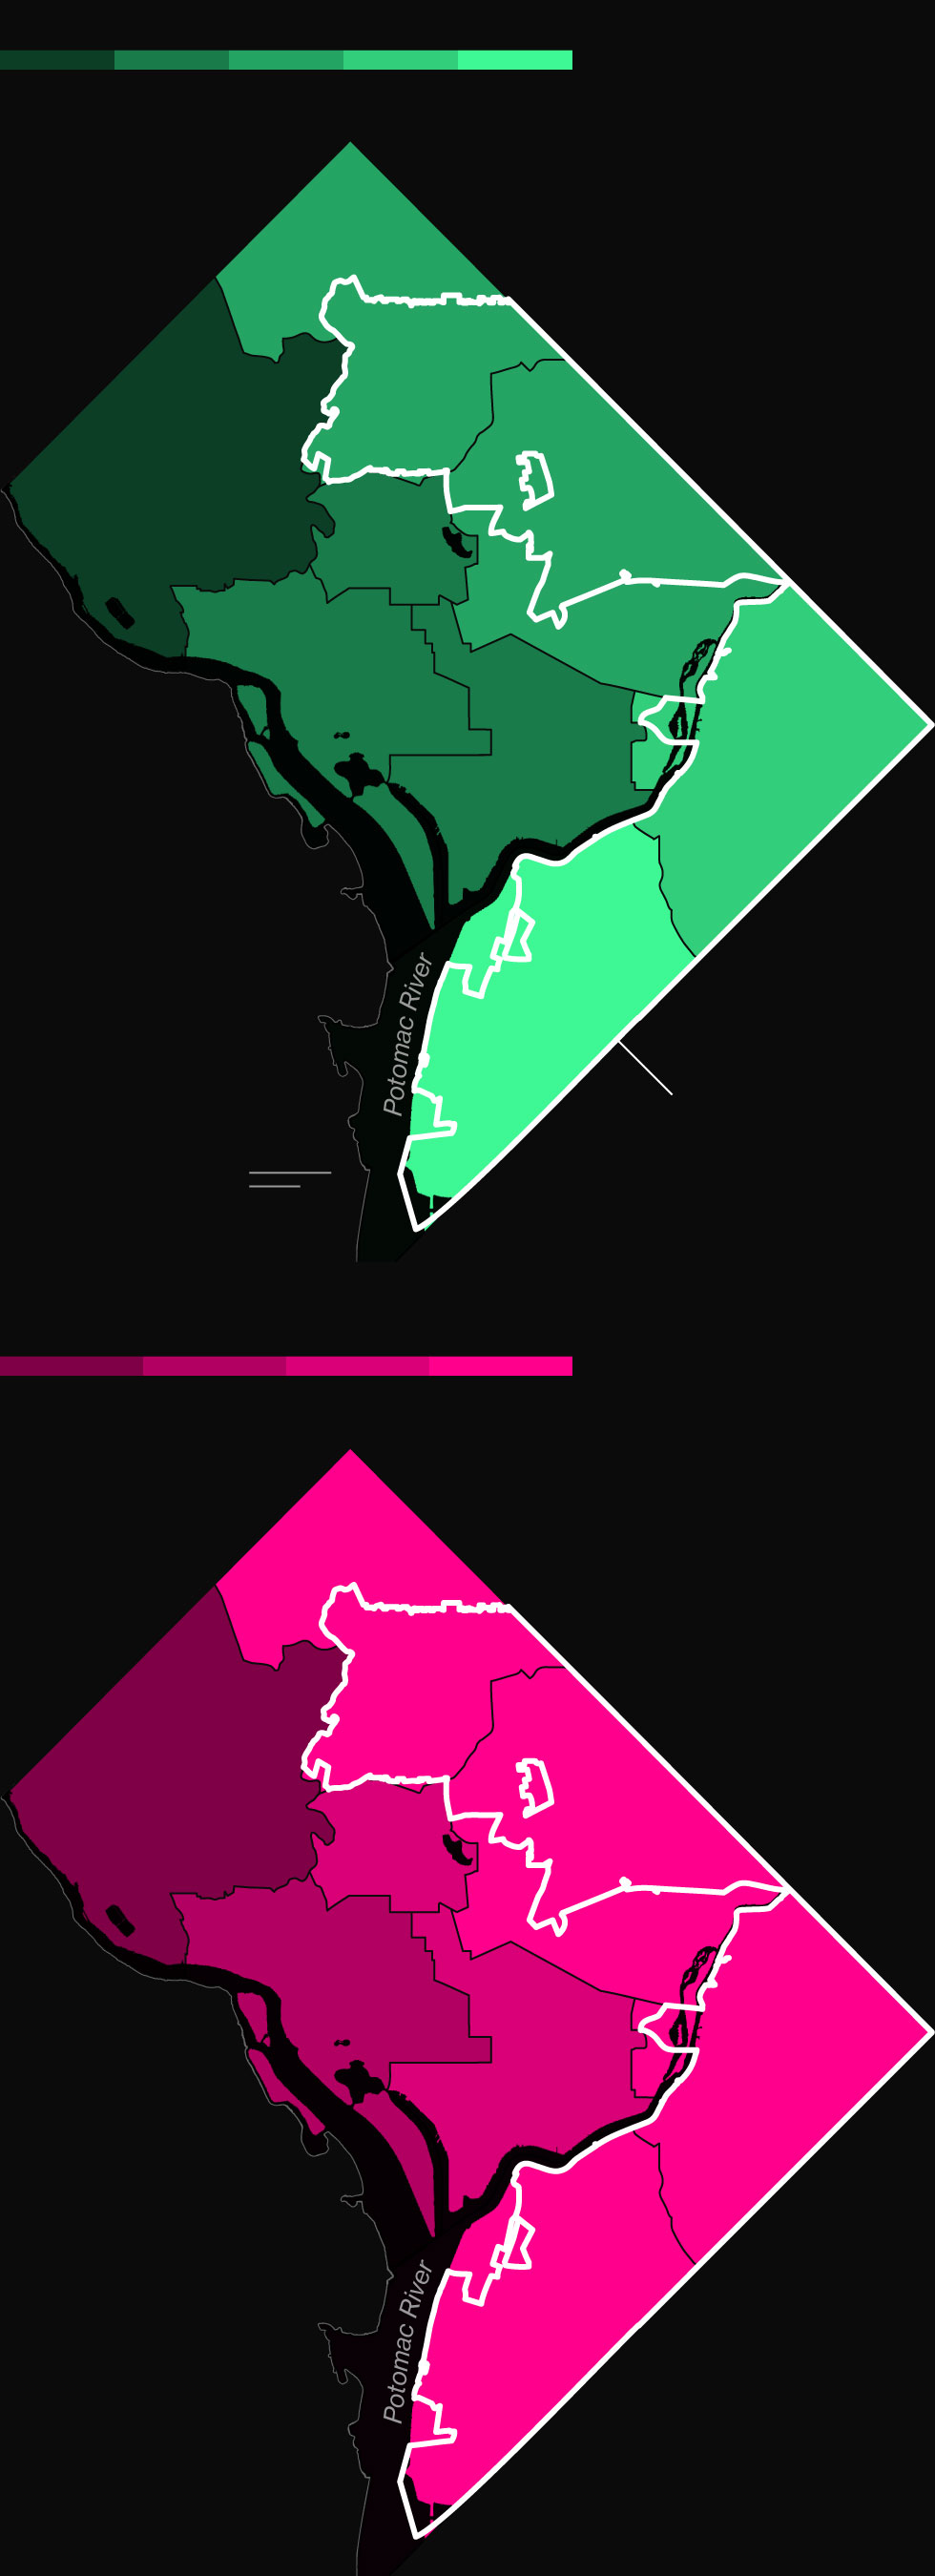
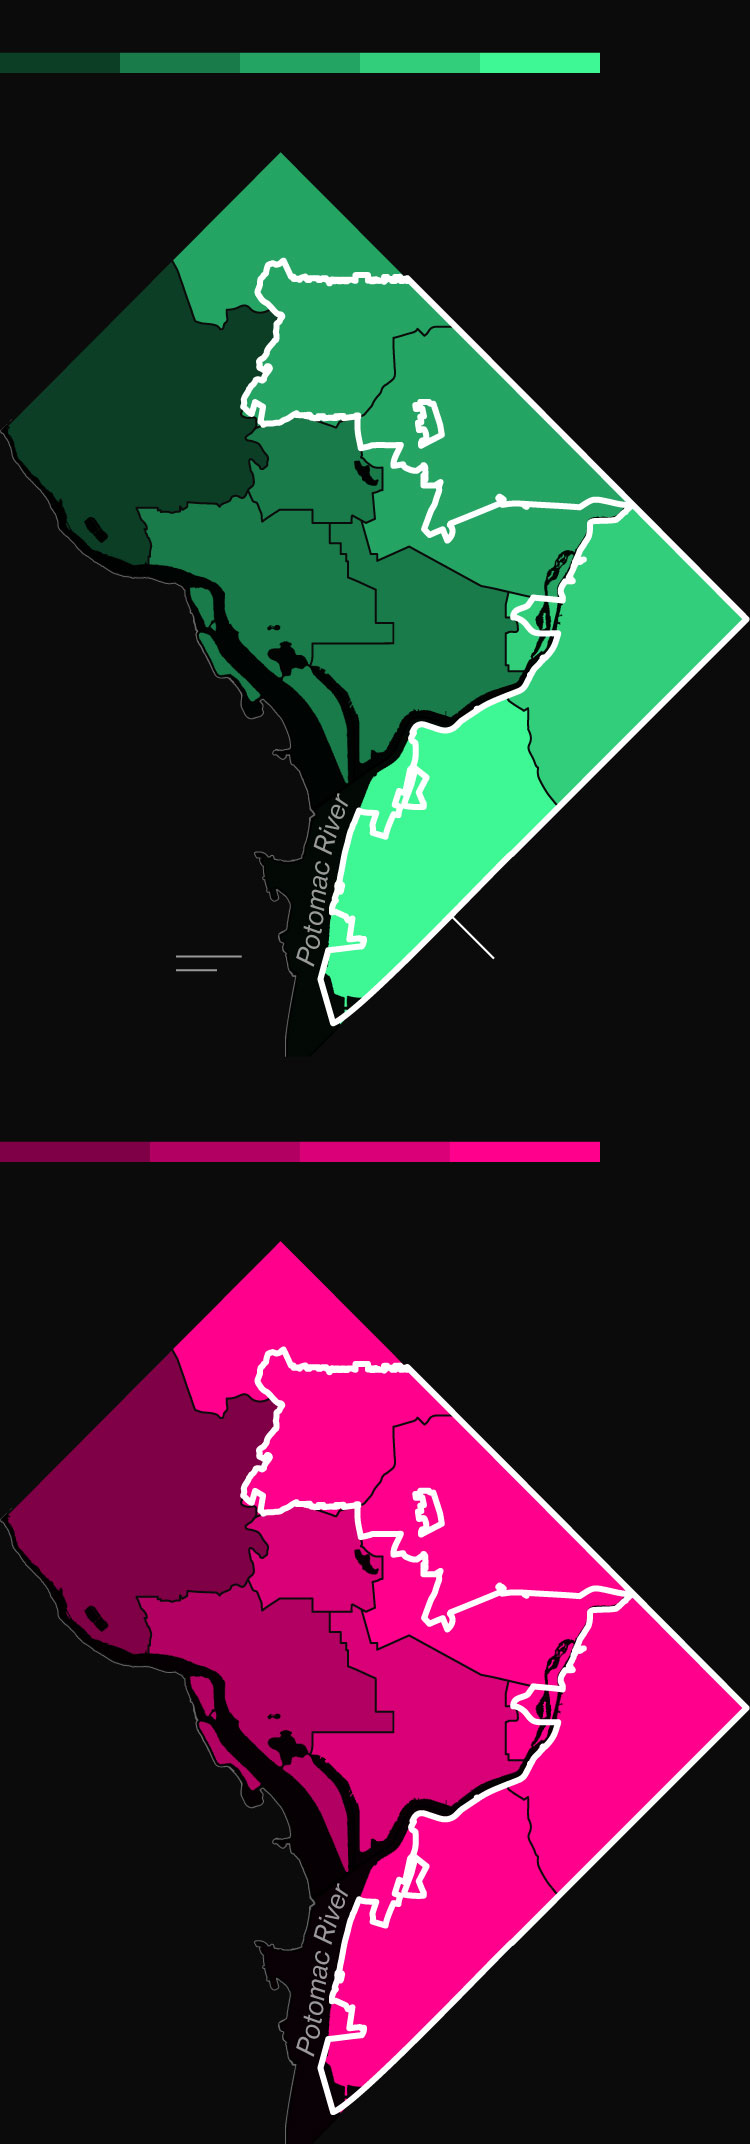
A Divided Capital
Washington, D.C. is increasingly split in two, with its large Black population clustered in the city’s less-affluent eastern wards, which were hit hardest by Covid-19.
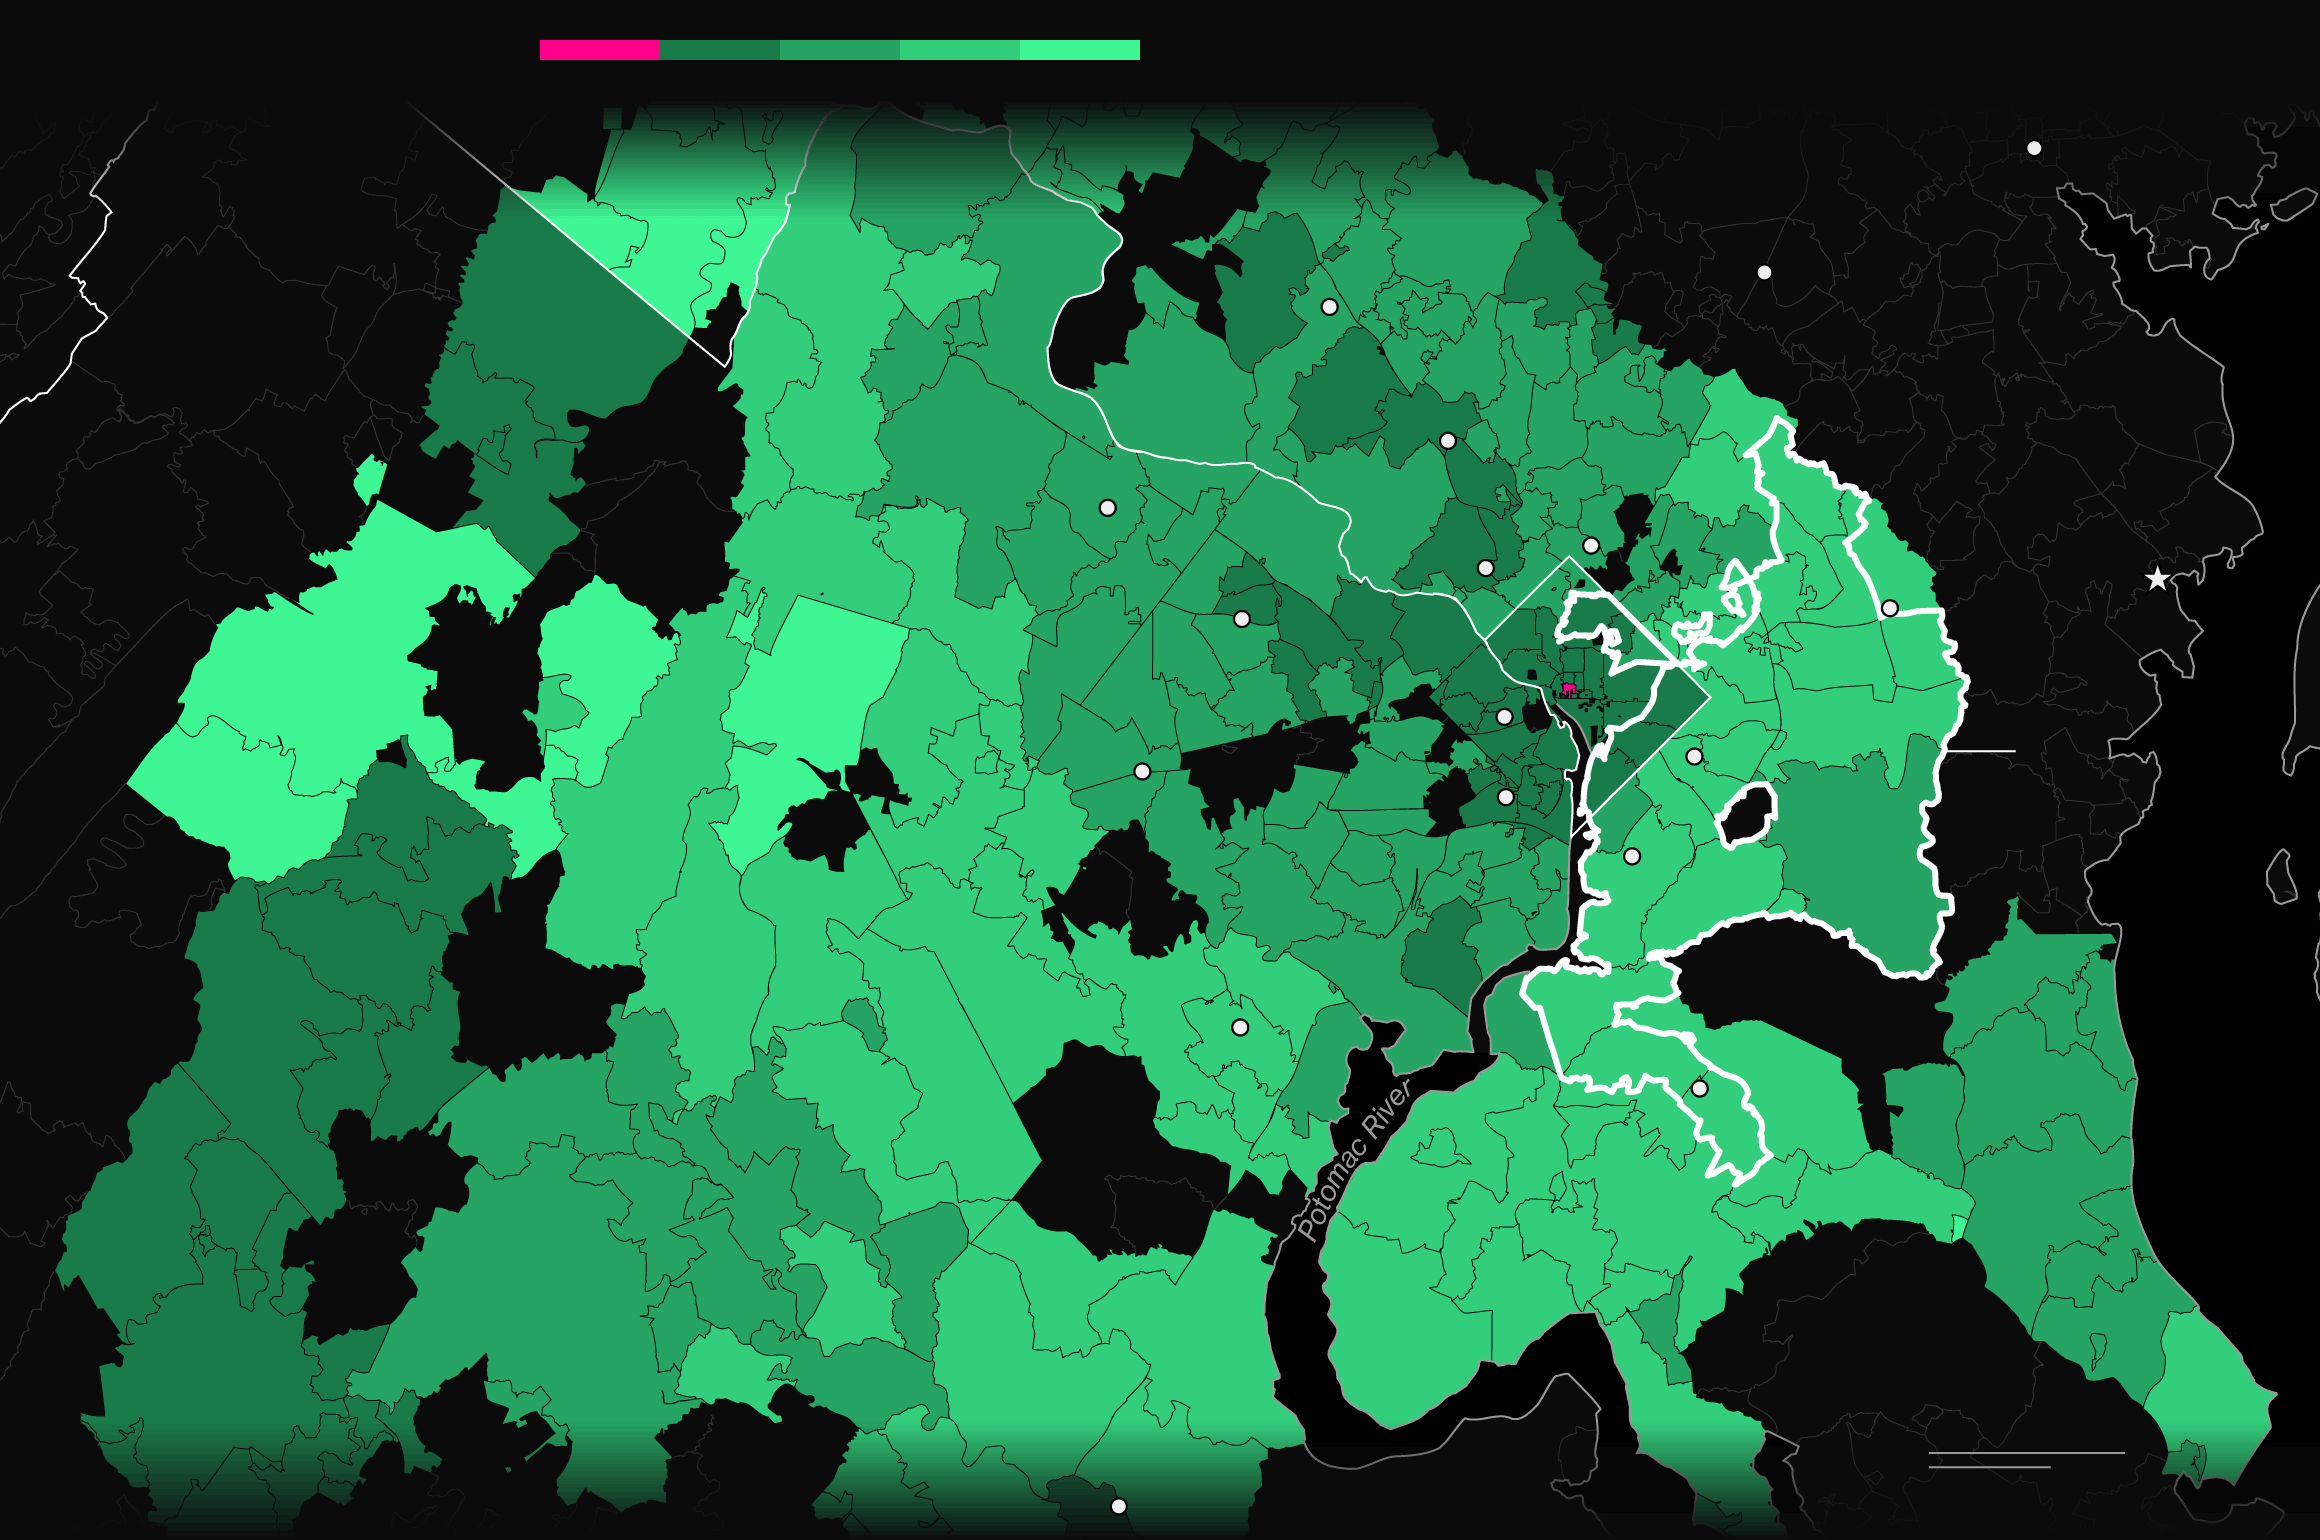
The Income Gap
Majority-Black areas tend to have lower median household incomes than more White areas, though there are a few pockets of Black wealth, including neighborhoods to the south and east of the city.
The Wealth Gap
There are now 16 zip codes where the typical home is worth at least $1 million, most of which are predominantly White, up from 11 before the pandemic and just one a decade ago. Meanwhile, the majority-Black zip code with the most expensive residential real estate tops out at $763,587.
A Housing Boom
As the economic recovery takes hold, Black neighborhoods are seeing home prices rise by around 14% from a year ago, on average, compared to 11.9% for majority-White areas. They’re also seeing more new businesses open per capita than the metro area overall.
Home Equity
Rising home prices mean hundreds of thousands of homeowners will see gains in the equity stakes they own, including in the District’s majority-Black wards, improving their financial resilience.
“The question about displacement is real in D.C.,” Mayor Bowser said in an interview with Bloomberg Tuesday.
While the share of Black and White people in the city is about equal—at 46% each in 2019, according to Census data—that compares to 51% Black and 42% White in 2010.
More people have moved into the city limits in recent years as Washington’s economy has diversified, drawing industries such as technology—including Amazon’s HQ2 headquarters in neighboring Virginia—biotech, data centers and a burgeoning lobbying business.
“Where we see the job growth is the private sector,” Bowser said.
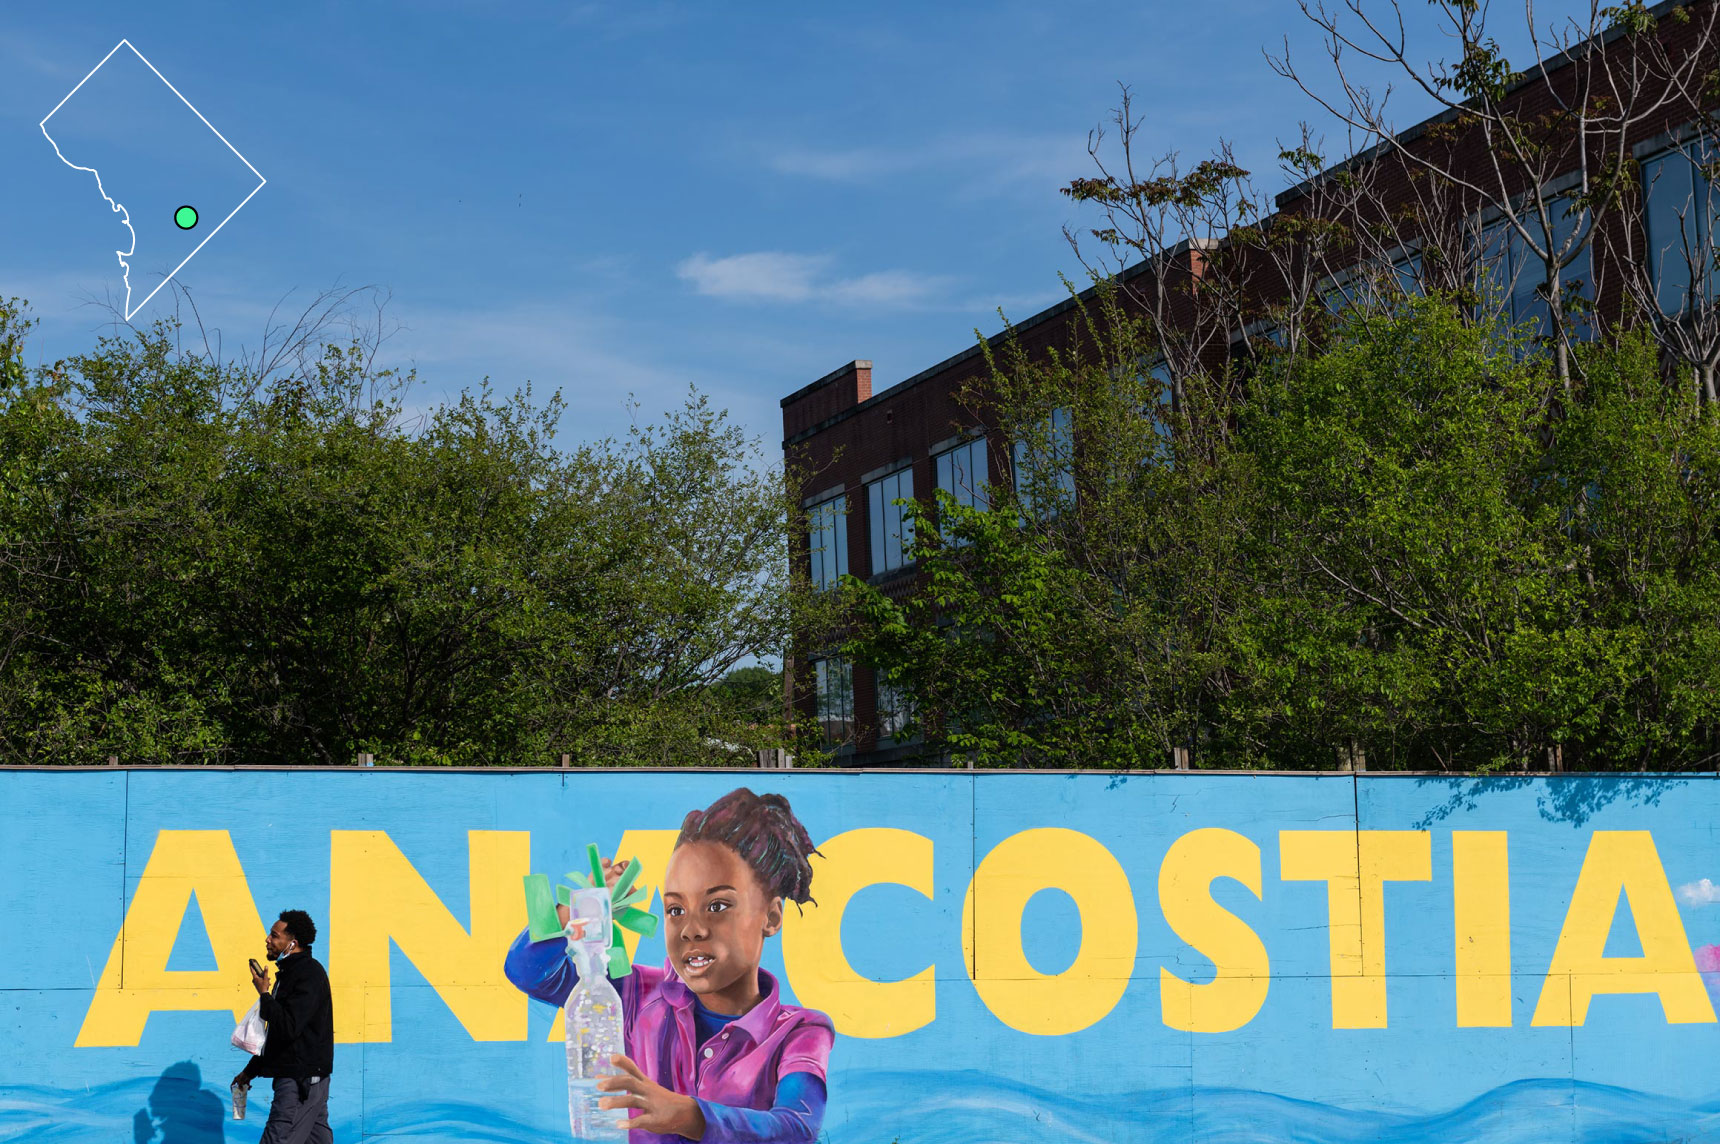
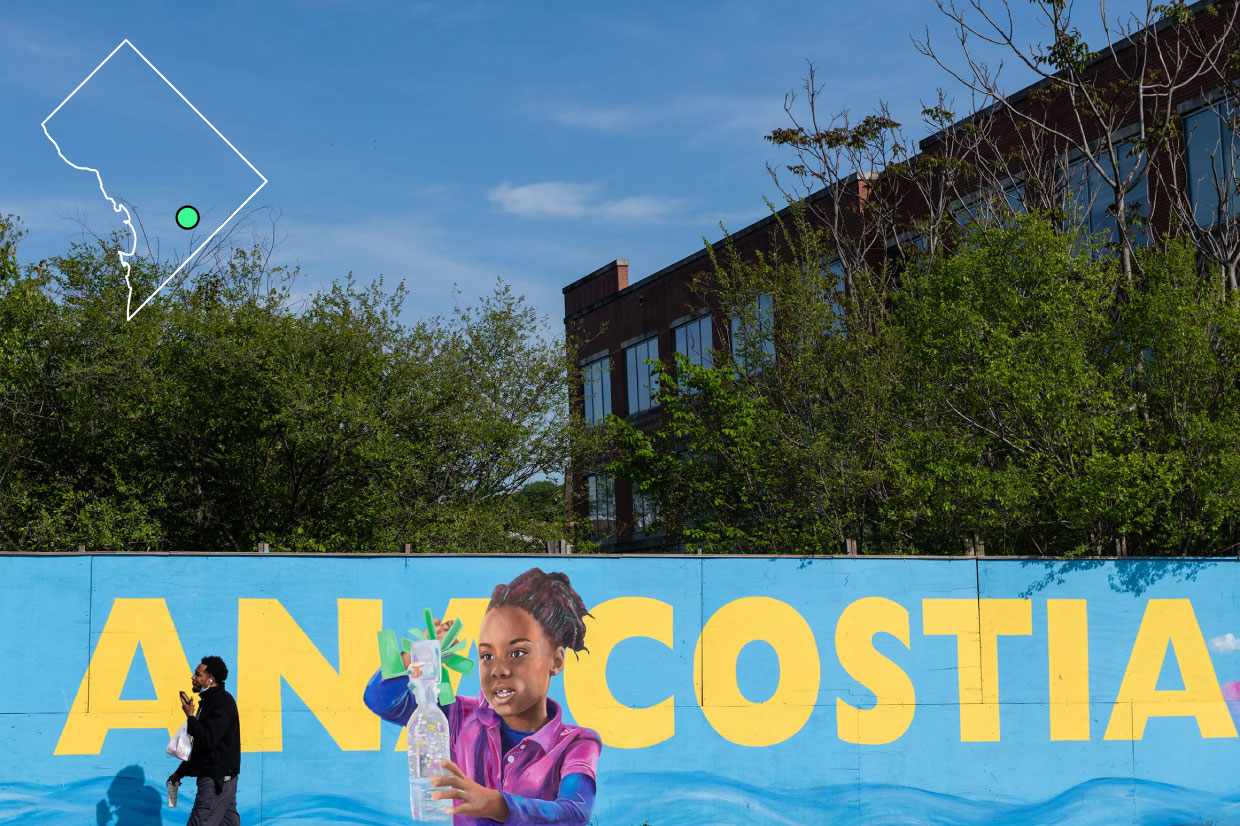
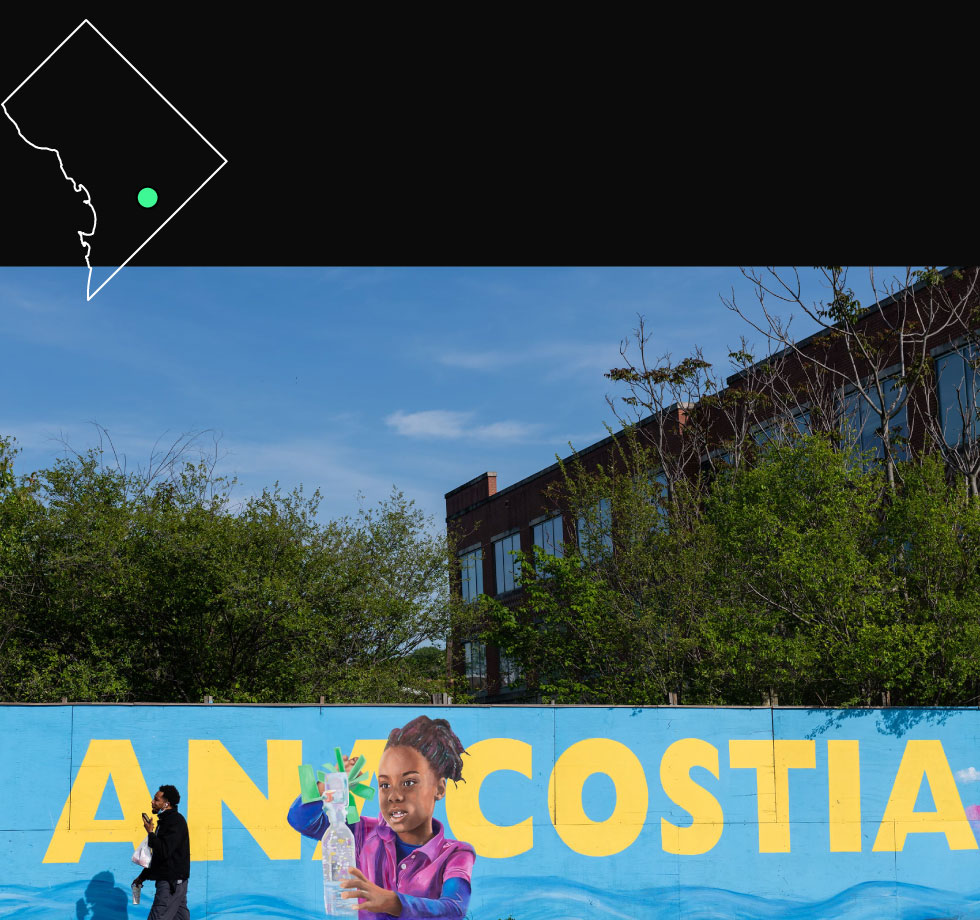
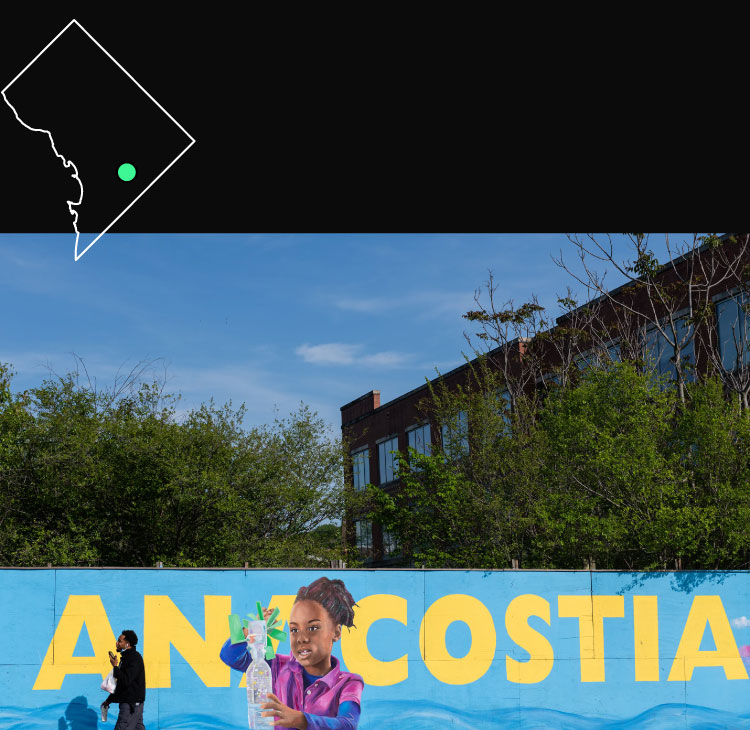
On a recent summer day in June, the Anacostia region of D.C.—which has a concentration of Black households—is teeming with people as activity resumes after pandemic restrictions.
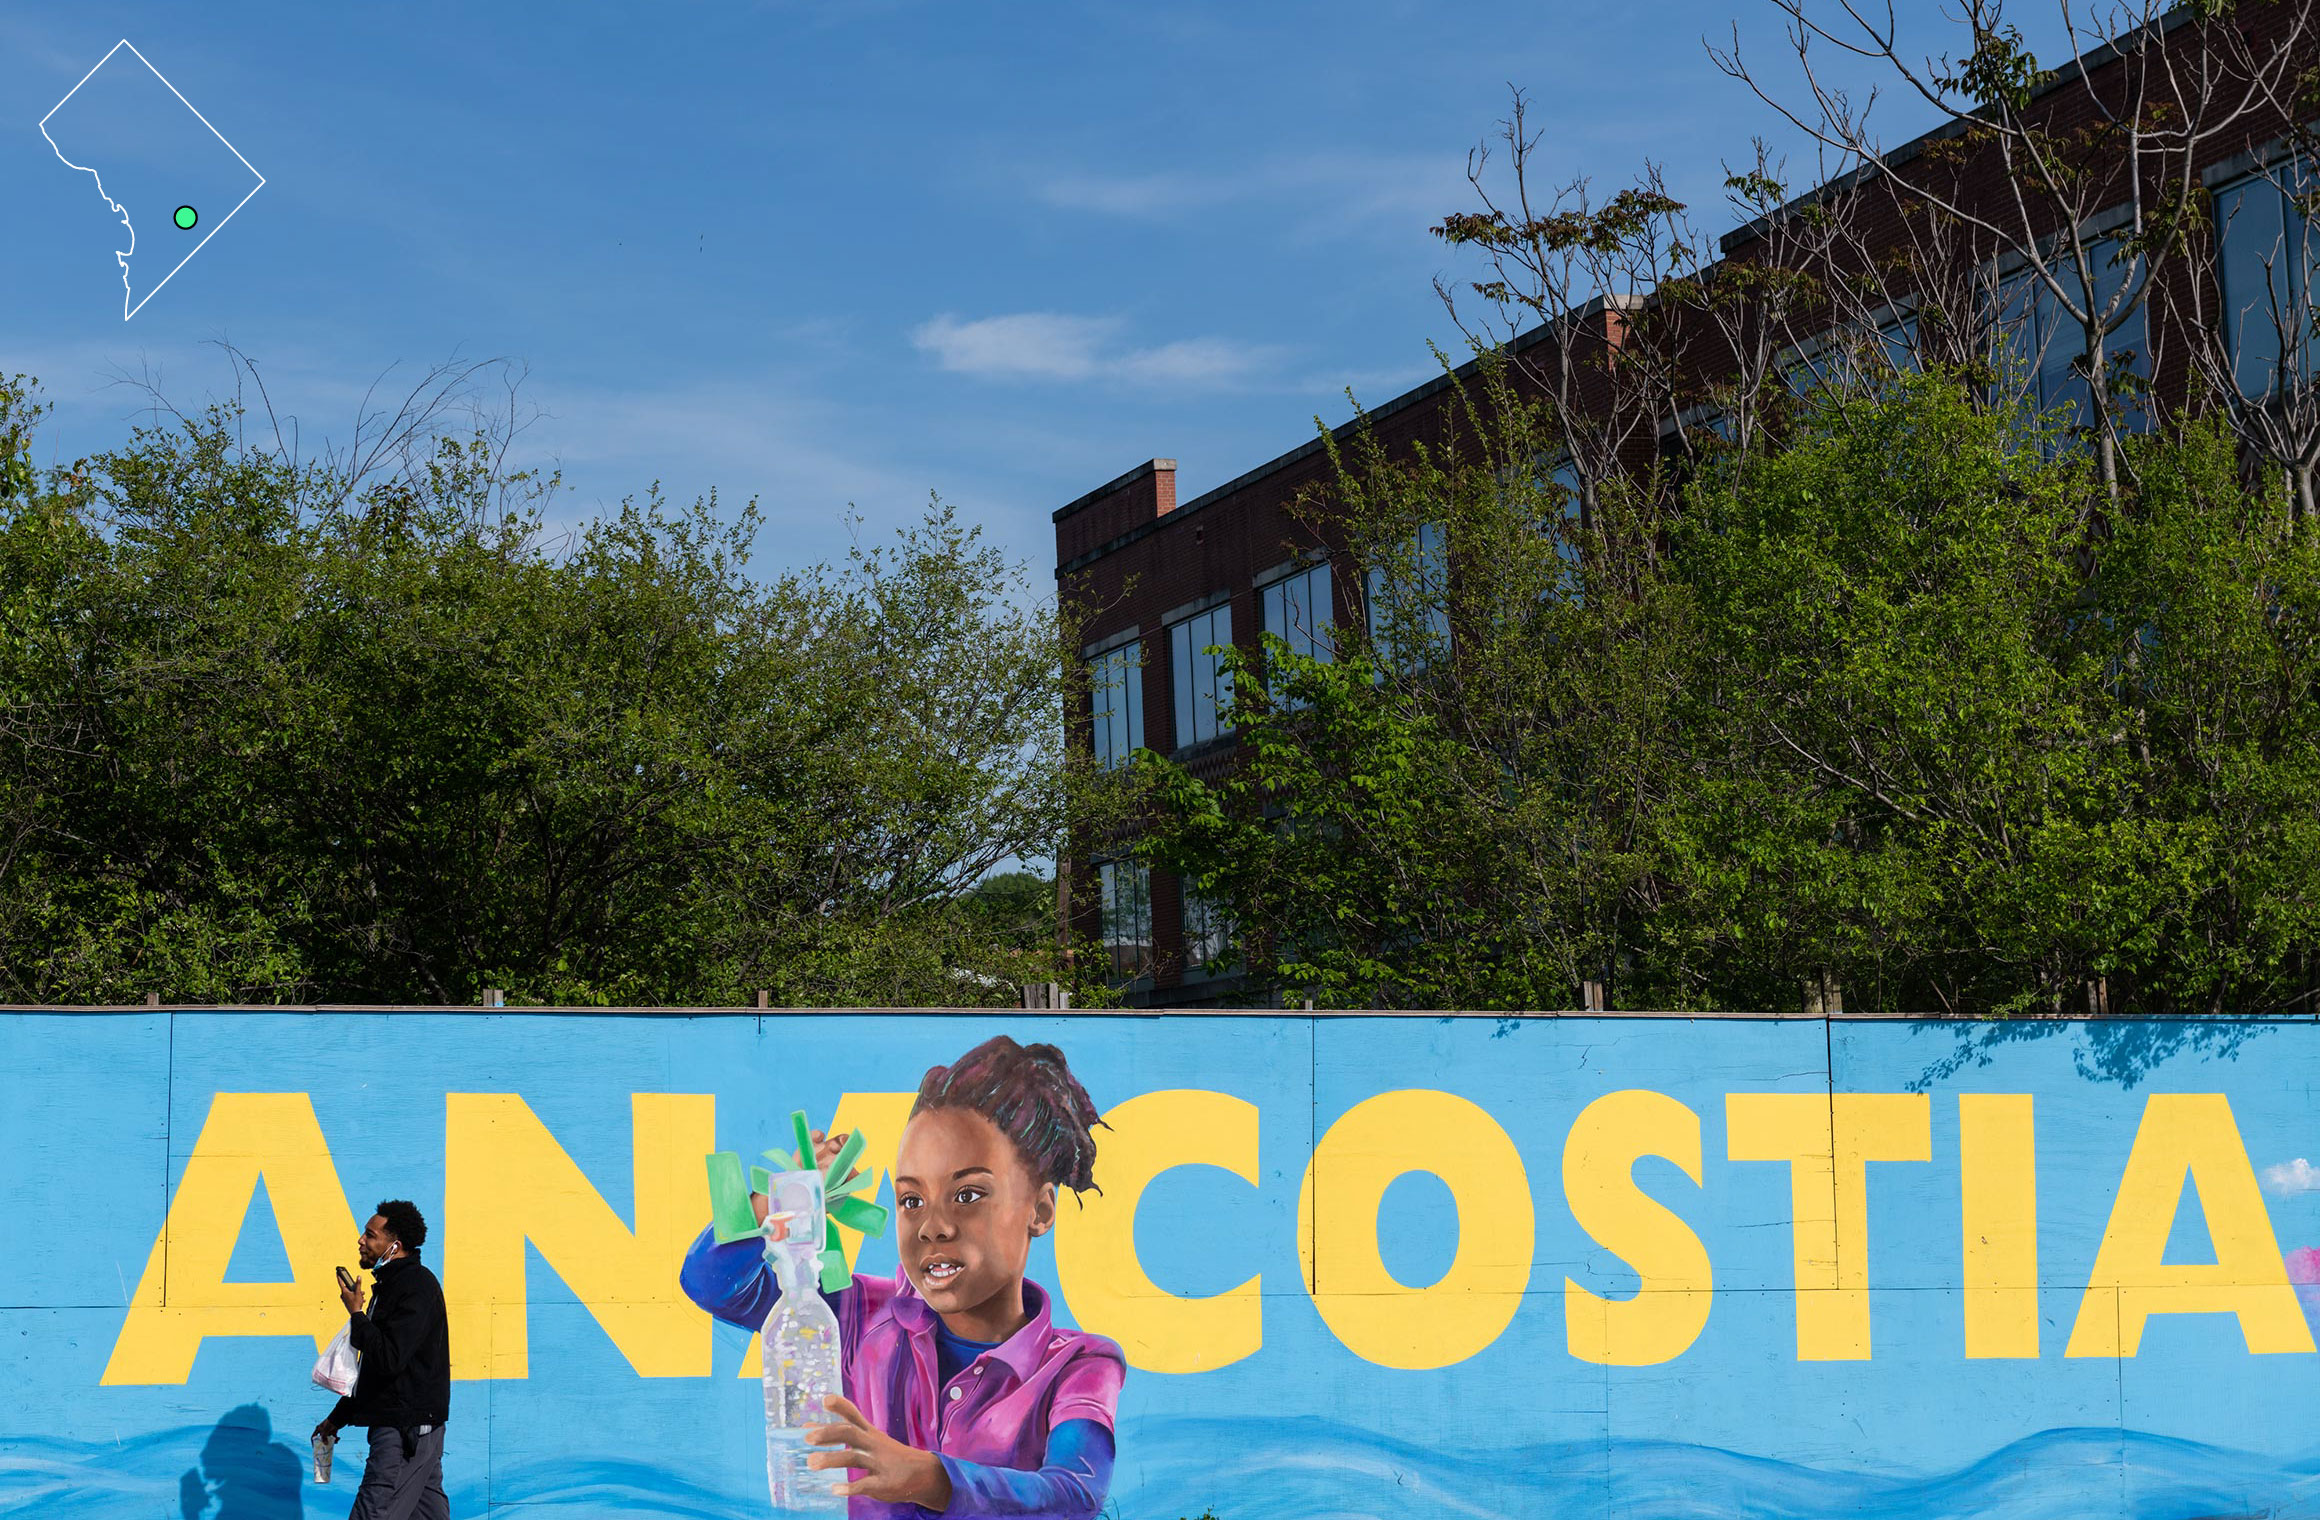
A colorful mural in Anacostia, which is at least 84% Black.
A colorful mural in Anacostia, which is at least 84% Black.
A colorful mural in Anacostia, which is at least 84% Black.
A colorful mural in Anacostia, which is at least 84% Black.
A colorful mural in Anacostia, which is at least 84% Black.
The new Starbucks in the area—the neighborhood’s first standalone store—has a steady flow of customers as an Earth, Wind & Fire song plays in the background. An apartment building on the block is actively trying to sign people up to lease a unit.
There’s been a steady uptick in Paycheck Protection Program loans going to Black D.C. neighborhoods in recent months, with April being the first month when they received more than White areas. But overall, those areas have received relatively less loan money compared with majority-White neighborhoods as well as many other cities, according to data through May 2021 compiled by Bloomberg.
Even still, majority-Black areas of the District have actually seen a faster pace of new businesses opening since March 2020, according to Yelp data.
David Boyd, whose family has owned a tavern near the Maryland border for decades called Takoma Station, received money after his business closed for three months during the pandemic and racial protests in the city last year.
“There are many different folks that are starting to move into the neighborhood because it’s expanding, because of building more apartments, building more town homes,” he said.
The lack of activity in the center of D.C.—around the White House and National Mall— during the pandemic has also changed the economy for neighborhoods like Boyd’s.
“We’re starting to get more businesses, more nightlife and people are coming to the areas that are on the outskirts of D.C.,” he said. “It’s kind of doing a flip because there is no reason to be downtown.”
Downtown and Northwest D.C. have lower unemployment rates than the poorer, majority-Black wards across the Anacostia River, which were hit particularly hard by the Covid-19 pandemic.
Where the Pandemic Hit Hardest
Unemployment rate by ward (April 2021)
Covid cases per 100K people by ward (as of June 18)
3
6
9
12%
4,000
6,000
8,000
Shepherd
Park
Shepherd
Park
maryland
maryland
4
4
Tenleytown
Tenleytown
16th St.
Heights
16th St.
Heights
Woodridge
Woodridge
3
3
Mount
Pleasant
Mount
Pleasant
5
5
Palisades
Palisades
1
1
Fort Lincoln
Fort Lincoln
Shaw
Shaw
Georgetown
Georgetown
Trinidad
Trinidad
2
2
6
6
National Mall
National Mall
Capitol View
Capitol View
Capitol
Hill
Capitol
Hill
7
7
Virginia
Virginia
Anacostia
Anacostia
8
8
Congress
Heights
Congress
Heights
Majority-Black
zipcodes
1 mile
1 km
Unemployment rate by ward (April 2021)
3
6
9
12%
Shepherd
Park
maryland
4
Tenleytown
16th St.
Heights
Woodridge
3
Mount
Pleasant
5
Palisades
1
Fort Lincoln
Shaw
Georgetown
Trinidad
2
6
National Mall
Capitol View
Capitol
Hill
7
Virginia
Anacostia
8
Congress
Heights
Majority-Black
zipcodes
1 mile
1 km
Covid cases per 100K people by ward (as of June 18)
4,000
6,000
8,000
Shepherd
Park
maryland
4
Tenleytown
16th St.
Heights
Woodridge
3
Mount
Pleasant
5
Palisades
1
Fort Lincoln
Shaw
Georgetown
Trinidad
2
6
National Mall
Capitol View
Capitol
Hill
7
Virginia
Anacostia
8
Congress
Heights
Unemployment rate by ward (April 2021)
3
6
9
12%
Shepherd
Park
maryland
4
Tenleytown
16th St.
Heights
Woodridge
3
Mount
Pleasant
5
Fort
Lincoln
Palisades
1
Shaw
Georgetown
Trinidad
2
6
National Mall
Capitol View
Capitol
Hill
7
Virginia
Anacostia
8
Congress
Heights
Majority-Black
zipcodes
1 mile
1 km
Covid cases per 100K people by ward (as of June 18)
4,000
6,000
8,000
Shepherd
Park
maryland
4
Tenleytown
16th St.
Heights
Woodridge
3
Mount
Pleasant
5
Fort
Lincoln
Palisades
1
Shaw
Georgetown
Trinidad
2
6
National Mall
Capitol View
Capitol
Hill
7
Virginia
Anacostia
8
Congress
Heights
Unemployment rate by ward (April 2021)
3
6
9
12%
Shepherd
Park
maryland
4
Tenleytown
Woodridge
3
Mount
Pleasant
5
Fort
Lincoln
Palisades
1
Shaw
Georgetown
Trinidad
2
Capitol
View
6
National Mall
Capitol
Hill
7
Virginia
Anacostia
8
Congress
Heights
1 mile
Majority-Black
zipcodes
1 km
Covid cases per 100K people by ward (as of June 18)
4,000
6,000
8,000
Shepherd
Park
maryland
4
Tenleytown
Woodridge
3
Mount
Pleasant
5
Fort
Lincoln
Palisades
1
Shaw
Georgetown
Trinidad
2
Capitol
View
6
National Mall
Capitol
Hill
7
Virginia
Anacostia
8
Congress
Heights
The Mayor pointed to incentives for vaccinations at centers in wards 7 and 8, as well as funding to support increased homeownership where it’s low, as policies aimed at closing some of these gaps.
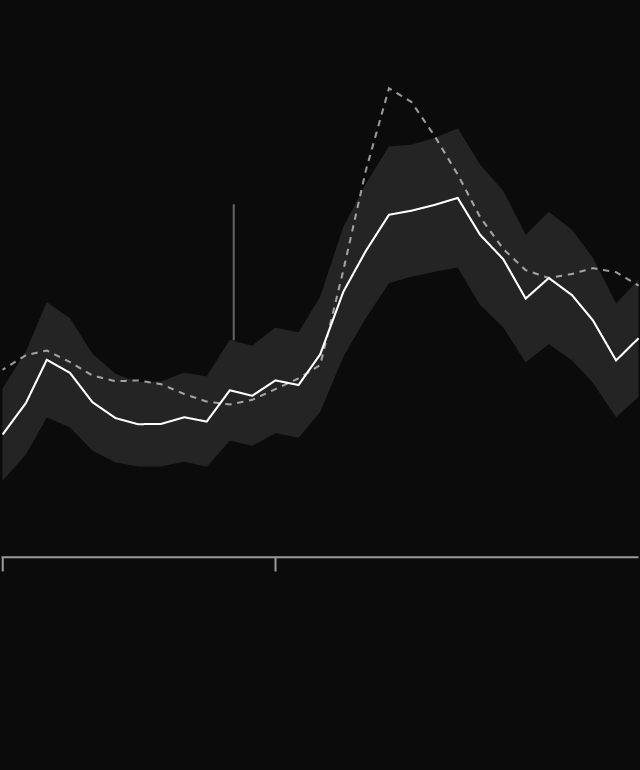
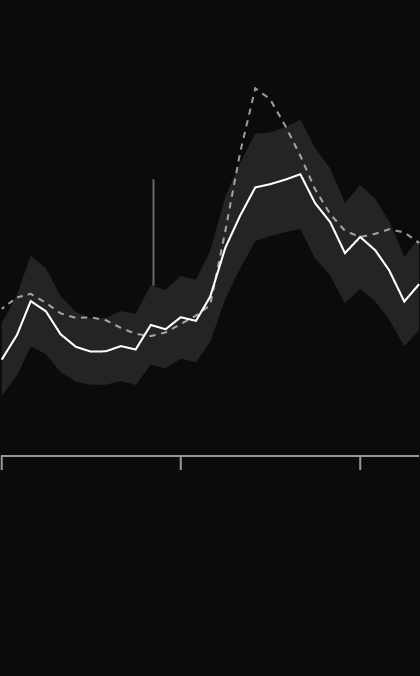
Black D.C. metro area vs Black national unemployment rate
Margin
of error
7.5%
4.2%
2019
2020
2021
–3 points
Estimated jobless rate decrease since May 2020
Black D.C. metro area vs Black national unemployment rate
Margin
of error
7.5%
4.2%
2019
2020
2021
–3 points
Estimated jobless rate decrease
since May 2020
The unemployment rate for Black people in the D.C. metro area was estimated at 7.5% on average in the three months ending in May—close to pre-pandemic levels—according to local unemployment rates calculated using the monthly Current Population Survey. That compares with 9.4% for the group nationwide and an overall unemployment rate in the U.S. of 5.8% in the same period.
Bloomberg has calculated local unemployment rates by race and ethnicity for more than a dozen U.S. metro areas and will be updating those monthly throughout 2021—as well as analyzing data on housing, PPP loans, business openings, spending patterns and job postings—to track the country’s multi-speed recovery.
The jobless rates across these metro areas range from 4.2% or lower for White people in Atlanta and Washington, D.C., to more than 12% for Black people in Chicago and Houston.
While some groups are roughly back to March 2020 levels, like White San Antonians and Hispanic Chicagoans, others continue to face significantly tougher labor markets, such as Hispanic workers in the LA metro area, White people around Las Vegas, and Black New Yorkers.
Average annual pay, D.C. metro area (Q4 2020)
Federal government: $120K
Private: $83K
$2,404
Increase in average federal pay since Q4 2019
Average annual pay, D.C. metro area (Q4 2020)
Federal govt: $120K
Private: $83K
$2,404
Increase in average federal pay
since Q4 2019
The stability of government jobs appears to have played a big role in holding up the labor market in D.C., and Black workers have been heavily represented in the federal labor force.
Government jobs account for a significant share of the wages and salaries in the District. And that doesn’t count the additional roles that spin off from the nation’s agencies such as contractors, consultants, lawyers and lobbyists.
Many of those workers were able to work from home during the pandemic. Roughly half of adults in the D.C. region were working remotely at the end of May, according to the Census Household Pulse Survey, more than any other metro area. While the good-paying jobs went virtual, Mayor Bowser said, getting back hospitality jobs is a priority now.

Federal jobs as a share of employment
(Q4 2020)
D.C. metro area: 12.4%
U.S.
2.1%
6,707
New D.C.-area federal jobs since Q4 2019

Federal jobs as a share of employment (Q4 2020)
D.C. metro area
12.4%
U.S.
2.1%
6,707
New D.C.-area federal jobs since
Q4 2019
That goal may not come easily, said Mike Curtin, chief executive officer of D.C. Central Kitchen, which serves meals around the city to those in need. During the pandemic, many hospitality workers left the area or the industry for places with a lower cost of living or they found work outside of the city, he said.
While D.C. is outpacing many metro areas analyzed by Bloomberg, the tale of two recoveries even here is apparent.
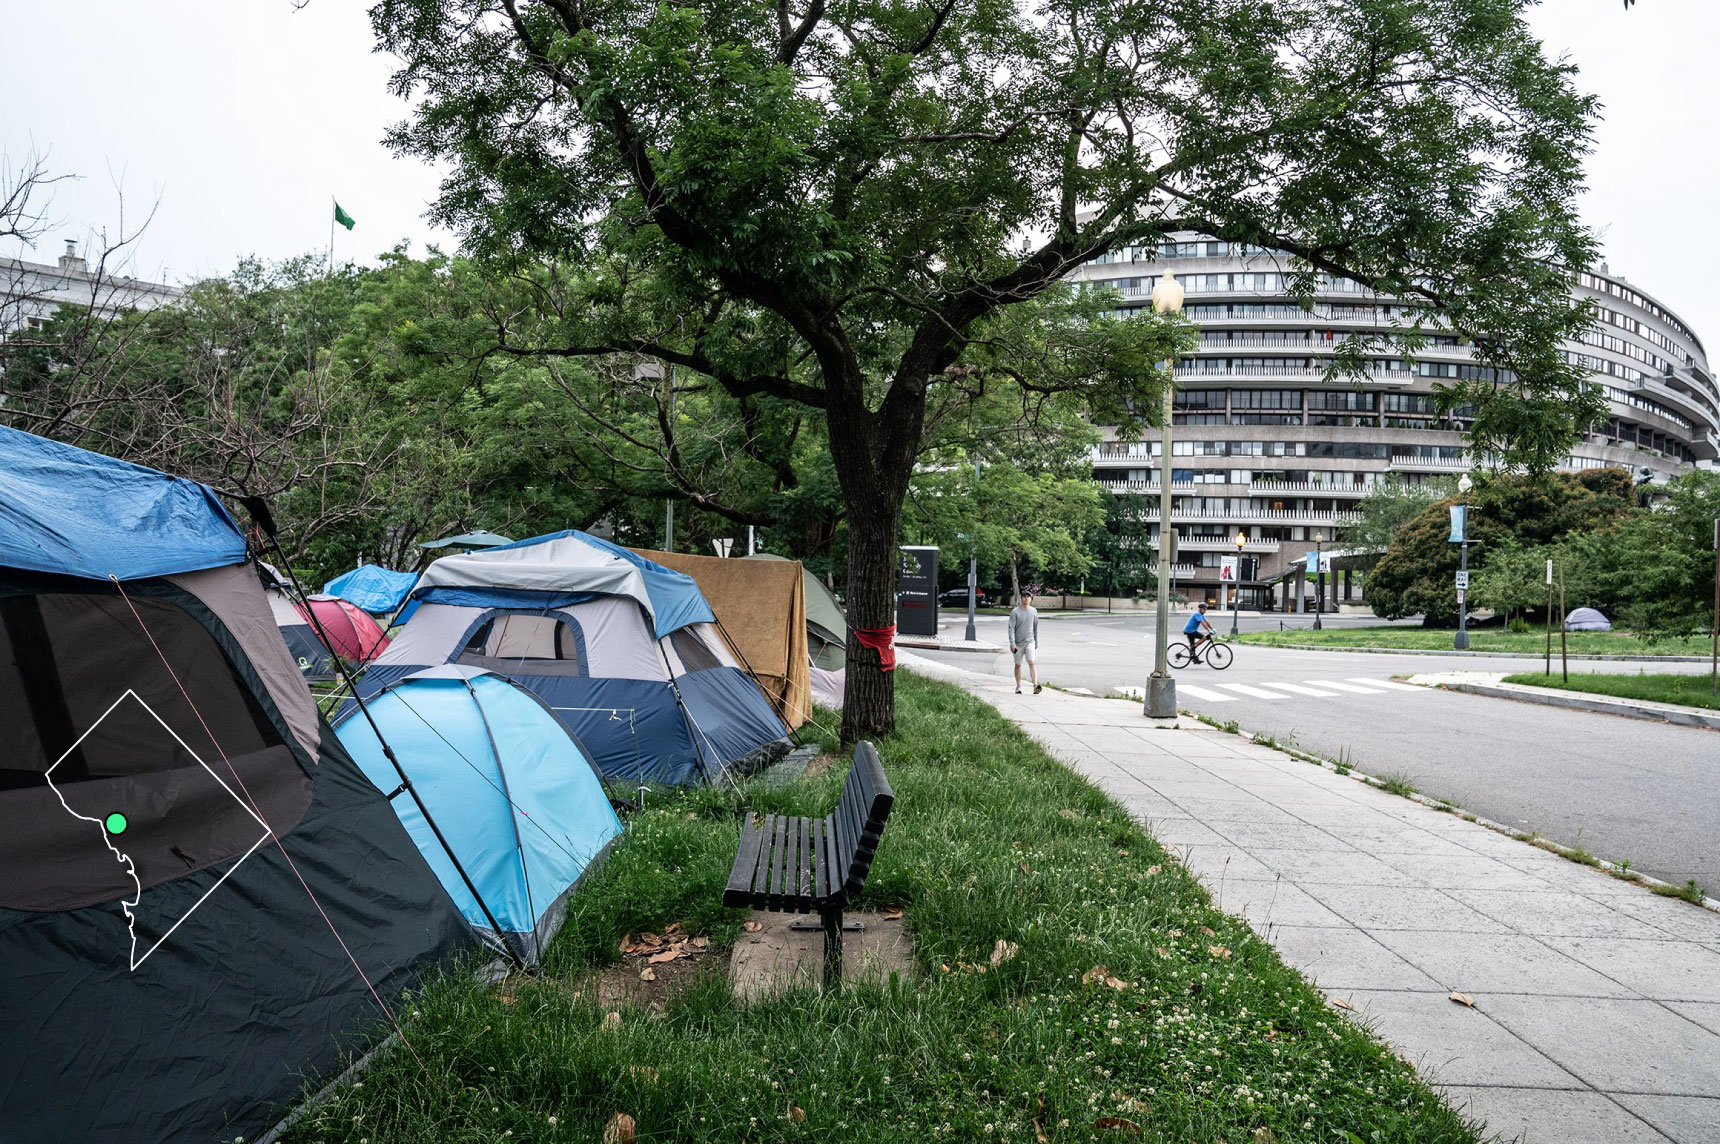
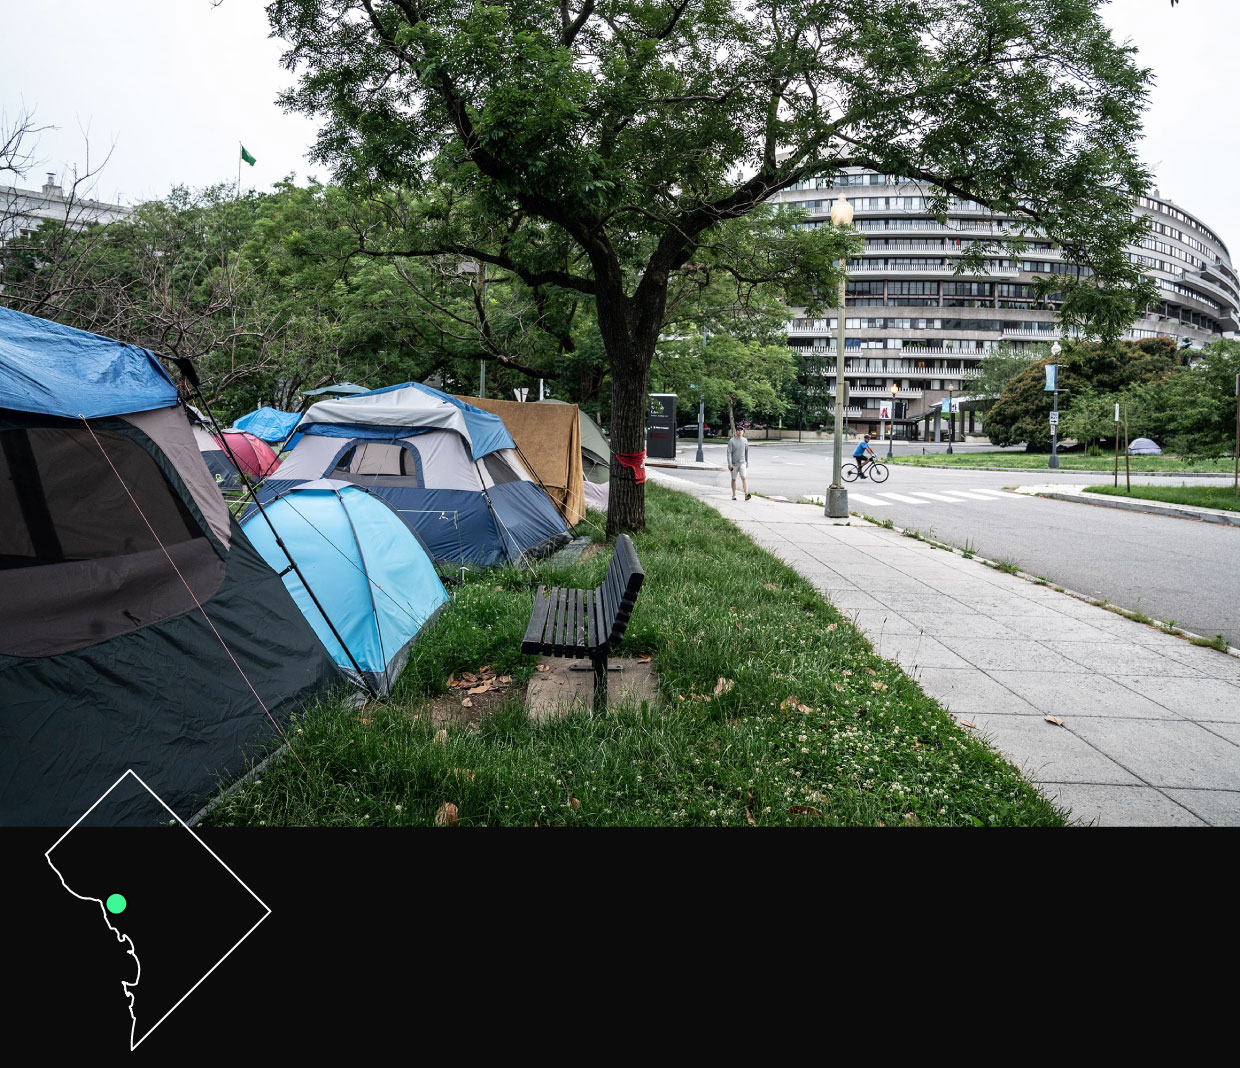
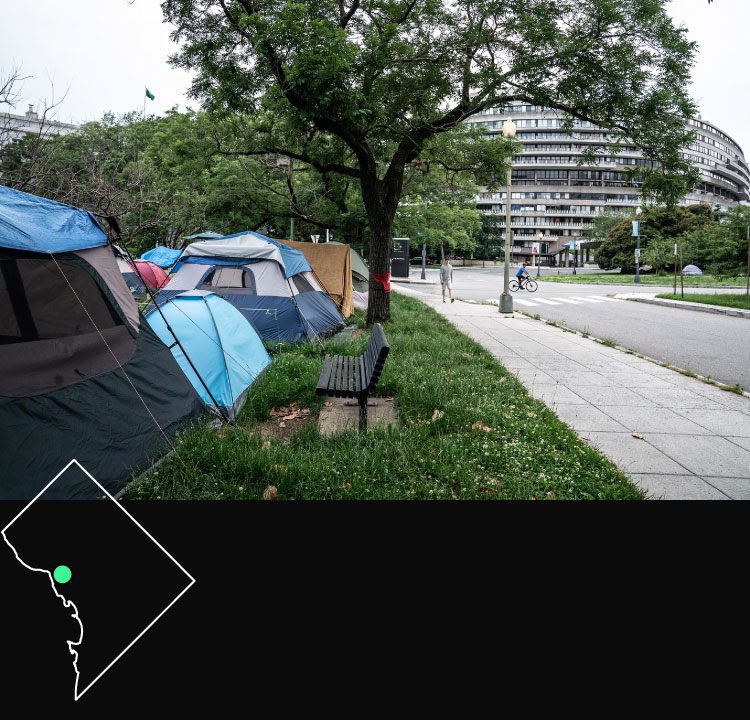
Tent cities have proliferated as Covid-19 ravaged communities and shut down businesses. Federal Reserve Chairman Jerome Powell in April pointed to one on his commute home from the city center as a barometer of leaving no one behind in the recovery.
Part of the struggle for many is tied to the city’s growth. The minimum wage in D.C. is $15 an hour, and scheduled to increase to $15.20 in July. “But how are you going to get an apartment and support yourself and live in the Washington area on $15?” Curtin said.
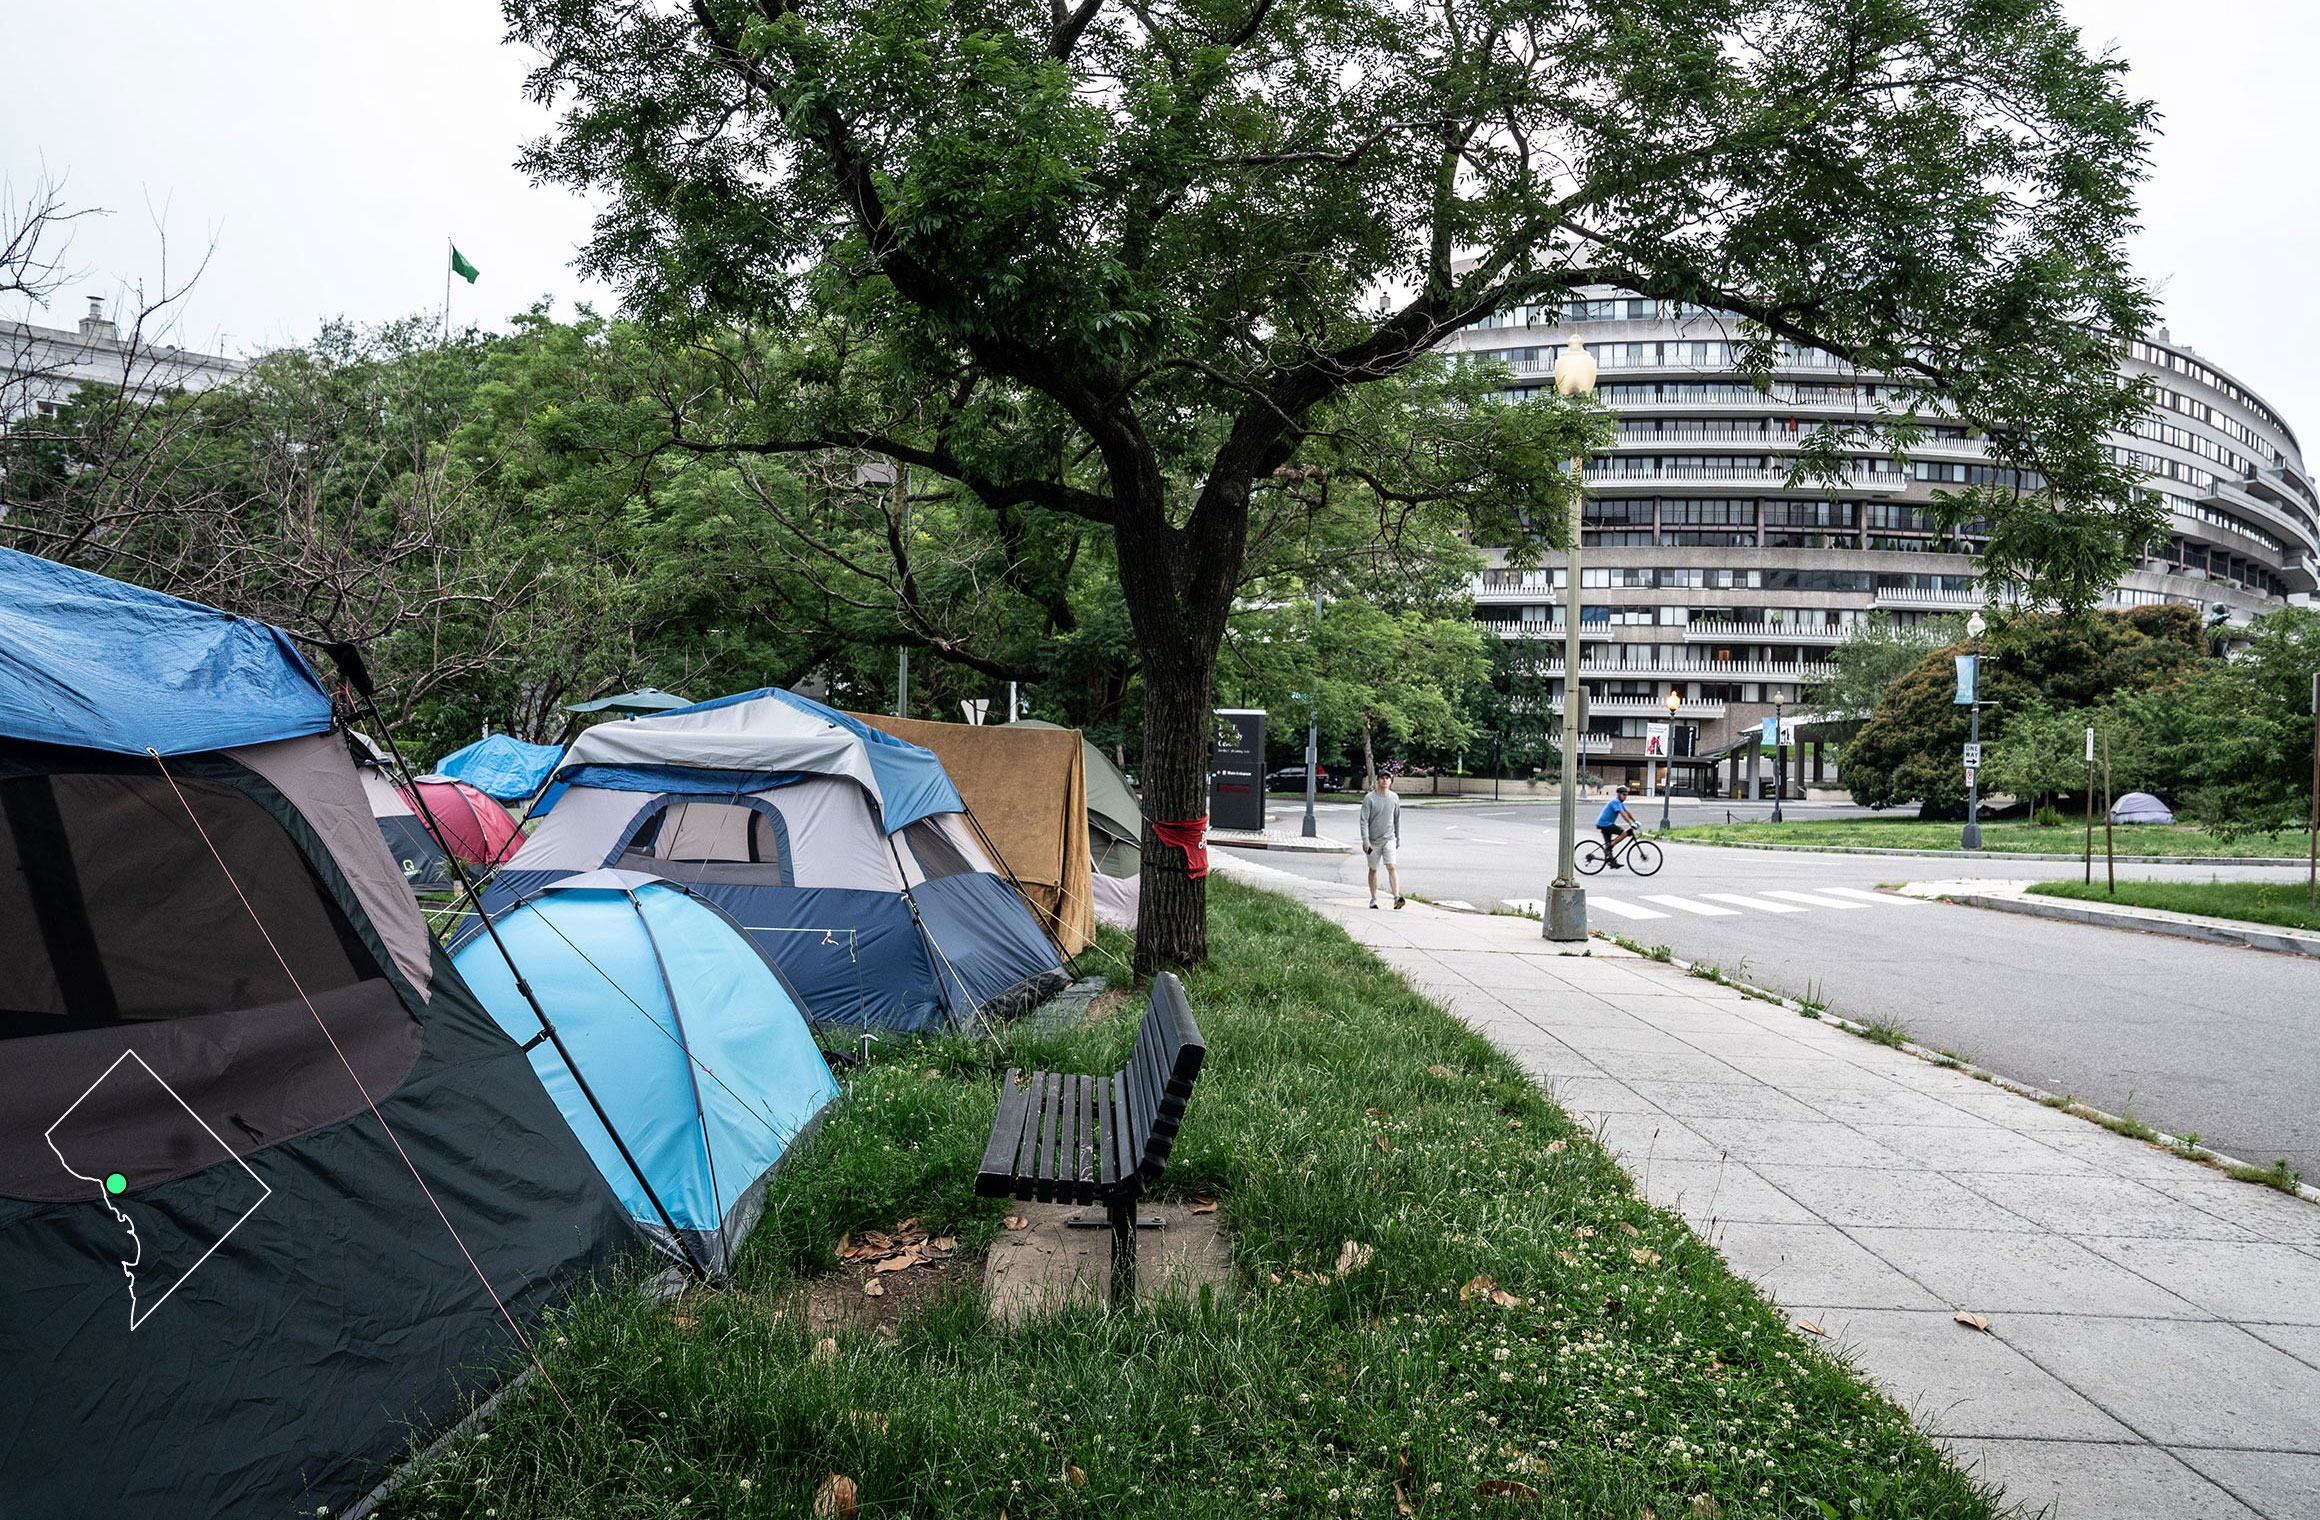
Tents across the street from the Watergate Hotel in Foggy Bottom.
Tents across the street from the Watergate Hotel in Foggy Bottom.
Tents across the street from the Watergate Hotel in Foggy Bottom.

Tents across the street from the Watergate Hotel in Foggy Bottom.
Tents across the street from the Watergate Hotel in Foggy Bottom.
As housing prices rise and some emergency-aid programs are set to expire, those who work with the most vulnerable in the city worry about what comes next.
“We’re all afraid of when the eviction moratorium will finally end,” said Stuart Allen, chief development officer at N Street Village, a shelter for women in the District. “That’s a very big concern we have for the fall.”
Mayor Bowser said Tuesday that the city has enough pandemic-relief funding to take care of the debt for those behind on their rent. The hurdle may be connecting the money to people who need it.
“There could be a sticky few months,” she said.