Climate Disasters Drain US Emergency Fund, Adding to Government Shutdown Risk
Devastating fires in Maui and the fierce winds and rain of Hurricane Idalia are just two of the record 23 billion-dollar weather disasters the US has experienced so far this year, leaving little left in the primary government relief fund. Diminished resources combined with a potential shutdown of the federal government could hamper the response to any new disasters later this year.
Due in part to a warming climate, major disasters are increasing in frequency and cost, and federal spending on recovery has grown in step. The principal source of direct federal aid is the Disaster Relief Fund. This major source of individual and public aid managed by the Federal Emergency Management Agency is expected to be exhausted by the end of the fiscal year in September.
Between 1992 and 1999, FEMA spent an average of $4 billion 2022 inflation-adjusted dollars annually on disaster aid. Even excluding outlier years following massive disasters like 2005’s Hurricane Katrina and the response to Covid-19, average FEMA spending since 2000 jumped to more than $10 billion annually.
Some of that money goes directly to individuals whose homes or livelihoods have been destroyed. When extreme weather decimates an area, many people have home insurance to cover costs. But for those who are uninsured or underinsured, the DRF is a piggy bank that can be used for temporary housing or even food. It is not as good as insurance, but it is a safety net for those with no other option.
In total, FEMA and the US Small Business Administration have already approved over $65 million in aid related to the wildfire in Maui. FEMA has also committed over $200 million for public recovery from Hurricane Idalia and around $60 million to individuals and households.
The US is hurtling to a near-certain government shutdown beginning Oct. 1 as Congress remains divided over spending levels and border and asylum policies. That could put further strain on FEMA.
FEMA Administrator Deanne Criswell recently testified that she has instituted an “immediate needs funding” mandate, which limits spending — this means funding for ongoing recovery and aid for previous disasters may be cut off as funds are routed to emergencies.
Disaster Relief Fund for Major Disasters Depleted in September
The DRF budget and spending varies year-to-year as funding for major disasters is made available after the fact. The last time there was an “immediate needs funding” mandate was 2017, a year with multiple devastating hurricanes, including Irma, Maria and Harvey. Funds in the DRF vary year-to-year, as major disasters are hard to predict and spending can vary greatly. Last year, the DRF ended September with around a $9 billion balance leftover for major disasters.
Shana Udvardy, who studies climate resilience for the Union of Concerned Scientists, a nonprofit science advocacy organization, says Congress almost always comes through on the DRF because it serves both red and blue states. But this time, she said, she fears it is being caught up in the battle over government funding that has the government on the verge of a shut down.
She points out that even FEMA funding has become more partisan in recent years. Sam Graves, a Republican representative from Missouri who chairs the House Transportation Committee, for example, said FEMA was running out of money because it was wasteful. “The Biden Administration is pushing an agenda focused on climate change and equity, diverting away from FEMA’s core mission,” he complained at a recent oversight hearing.
Although it is likely that the DRF will be bailed out, many argue that this is a broken cycle and more money needs to be spent on hardening infrastructure and towns before storms, not waiting to clean up the mess afterwards. This is especially true as storms and wildfires become more frequent and fierce and as more Americans move to areas at risk of hurricanes and wildfires.
An analysis by the Brookings Institution found that less than 14% of FEMA’s major disaster funding between 2005 and 2021 has gone towards disaster preparedness projects. A separate report from the US Government Accountability Office found that of more than $11 billion that went into making communities better-equipped to resist natural disasters between 2010–2018, 88% was awarded after disasters struck.
“Increased disaster spending is as much a reflection of underinvestment in resilience as a failure to appropriate adequate disaster recovery funds,” said Daniel Kaniewski, who was in charge of resilience for FEMA from 2017 to 2020.
The Biden administration has acknowledged the problem and pushed up climate resilience funding. Around $2.3 billion in grants was made available for communities grants towards resiliency projects via the Building Resilient Infrastructure and Communities program in 2022, but that represents less than 10% of overall federal funding through the DRF.
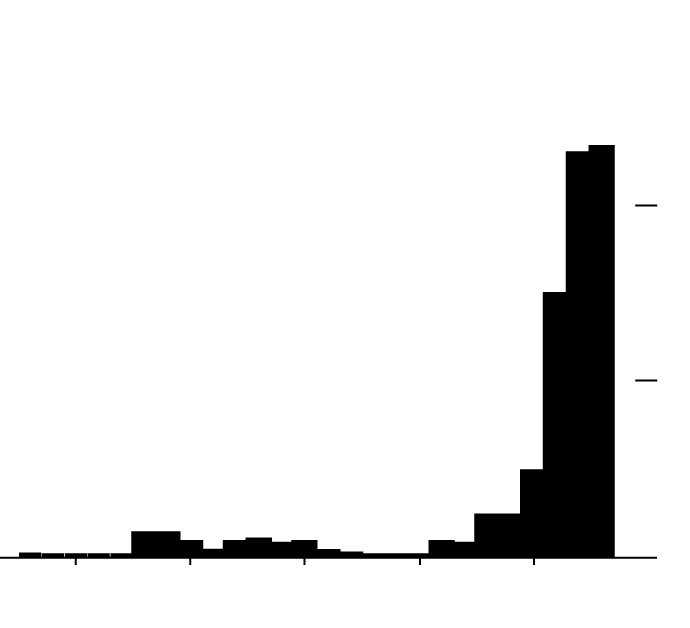
More Pre-Disaster Money in Disaster Relief Fund

In 2020, a new grant program called Building Resilient Infrastructure and Communities (BRIC) set aside more funds for pre-disaster projects.
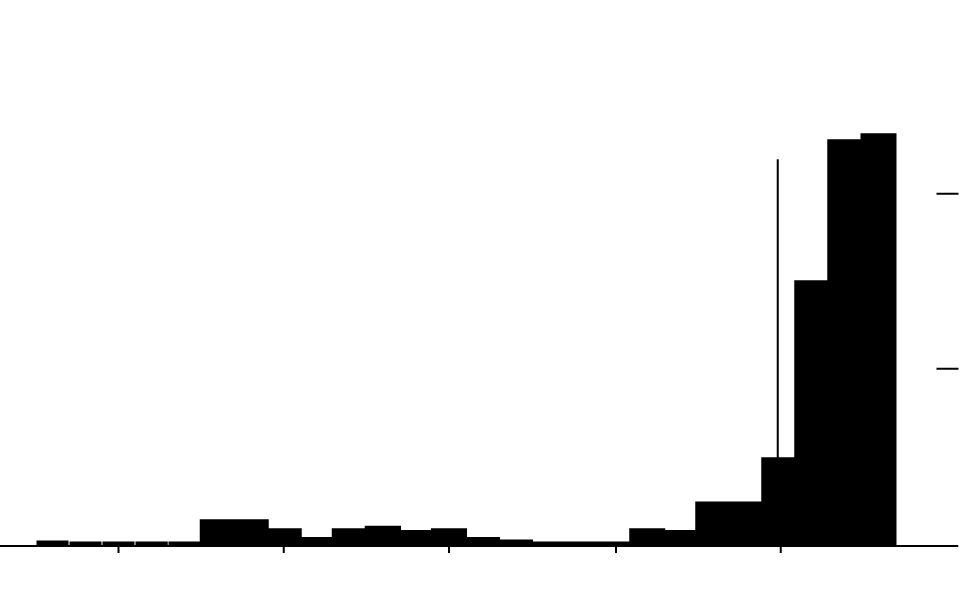
In 2020, a new grant program called Building Resilient Infrastructure and Communities (BRIC) set aside more funds for pre-disaster projects.
$2B
1
0
2000
2005
2010
2015
2020
In 2020, a new grant program called Building Resilient Infrastructure and Communities (BRIC) set aside more funds for pre-disaster projects.
$2B
1
0
2000
2005
2010
2015
2020
Preparation for future disasters is increasingly important. The US has seen more billion-dollar weather disasters in 2023 than any previous year on record, according to data from the National Oceanic and Atmospheric Administration. While past years have seen more costly destruction from disasters — Hurricanes Maria, Irma and Harvey caused around $329 billion in damage six years ago — the total number of billion-dollar disasters has increased over time. That includes a rapid acceleration in the last decade.
Billion-Dollar Disasters of All Kinds Are More Frequent

Tropical cyclone
Severe storm
Drought
Wildfire
Winter storm
Flooding
Freeze
$383.5B
$181.9B
2017 was a record year for natural disasters
2022 saw the third-most total cost of damage by billion-dollar disasters
$260.2B
Estimated costs in 2005 including damage by Hurricanes Katrina and Rita
Total estimated cost by type of disaster
$21.8B
Total cost of damage in 1985
2000
2005
2010
2015
2020
1985
1980
1990
1995
5
10
Number of billion-dollar disasters
15
20 events
Includes billion-dollar disasters through September

Tropical cyclone
Severe storm
Drought
Wildfire
Winter storm
Flooding
Freeze
Number of billion-dollar disasters
Total estimated cost by type of disaster
20 events
15
10
5
1980
$21.8B
1985
Total cost of damage in 1985
1990
1995
2000
$260.2B
Estimated costs in 2005 including damage by Hurricanes Katrina and Rita
2005
2010
$383.5B
2017 was a record year for natural disasters
2015
2020
$181.9B
2022 saw the third-most total cost of damage by billion-dollar disasters
Includes billion-dollar disasters through September

Tropical cyclone
Severe storm
Drought
Wildfire
Winter storm
Flooding
Freeze
Total estimated cost by type of disaster
Number of billion-dollar disasters
15
5
10
20 events
1980
$21.8B
1985
Total cost of damage in 1985
1990
1995
$260.2B
2000
Estimated costs in 2005 including damage by Hurricanes Katrina and Rita
2005
2010
$383.5B
2017 was a record year for natural disasters
2015
2020
$181.9B
2022 saw the third-most total cost of damage by billion-dollar disasters
Includes billion-dollar disasters through September

Tropical cyclone
Severe storm
Wildfire
Drought
Winter storm
Freeze
Flooding
Total estimated cost by type of disaster
Number of billion-dollar disasters
20 events
10
$21.8B
1985
Total cost of damage in 1985
1990
1995
$260.2B
Estimated costs in 2005 including damage by Hurricanes Katrina and Rita
2000
2005
2010
$383.5B
2017 was a record year for natural disasters
2015
$181.9B
2022 saw the third-most total cost of damage by billion-dollar disasters
2023
Includes billion-dollar disasters through September
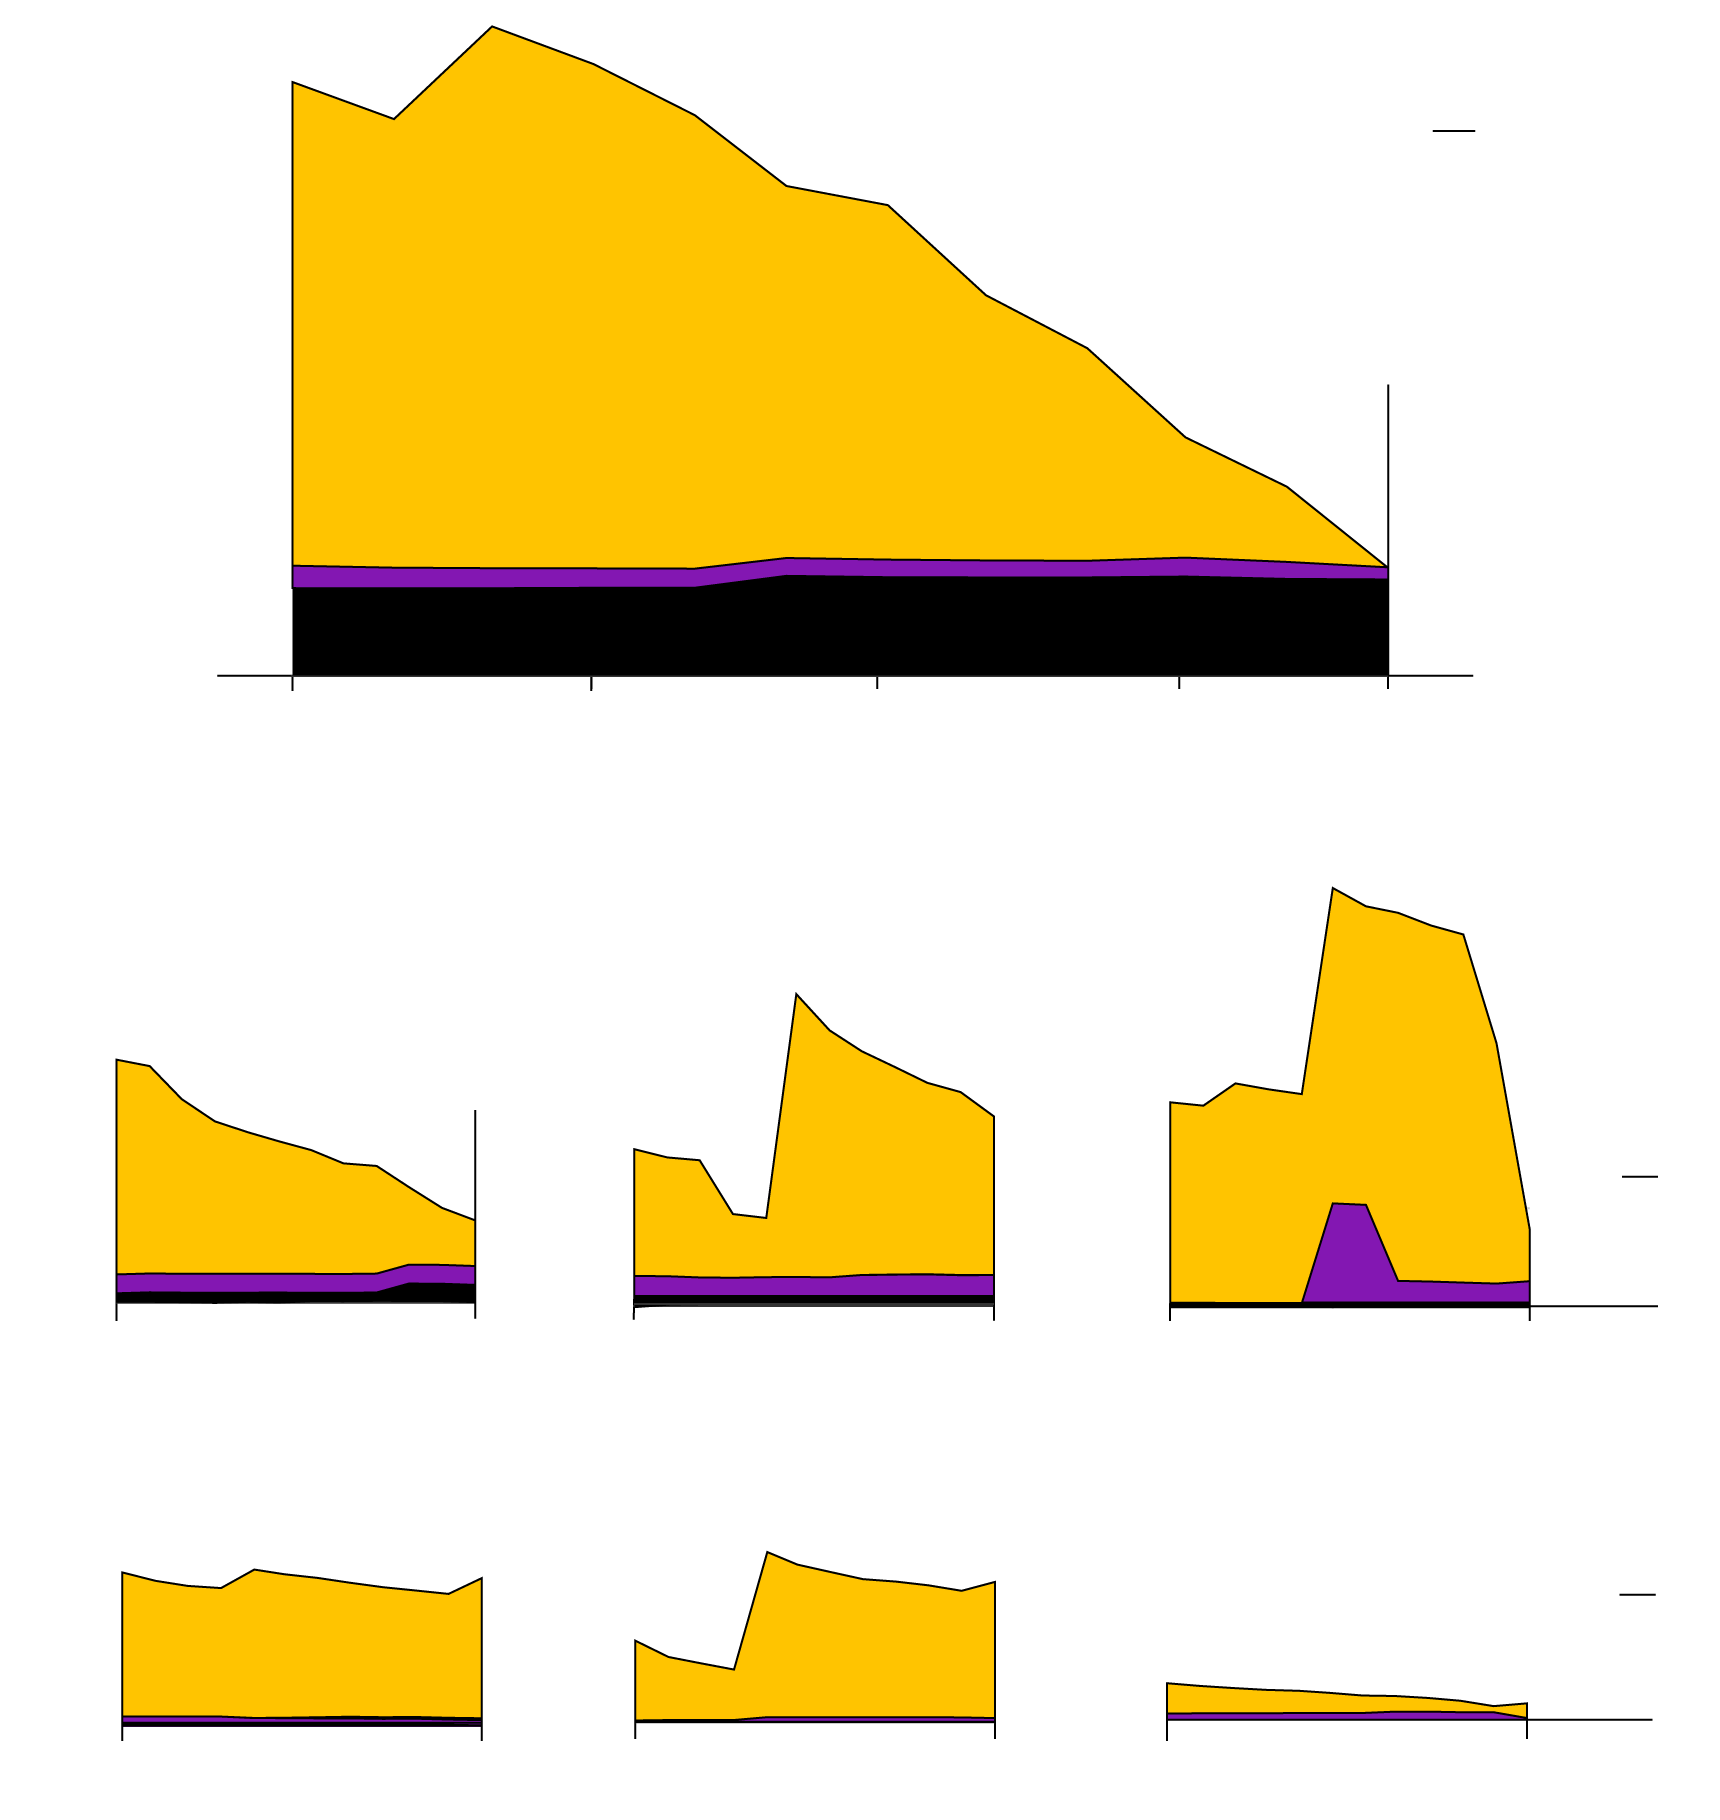
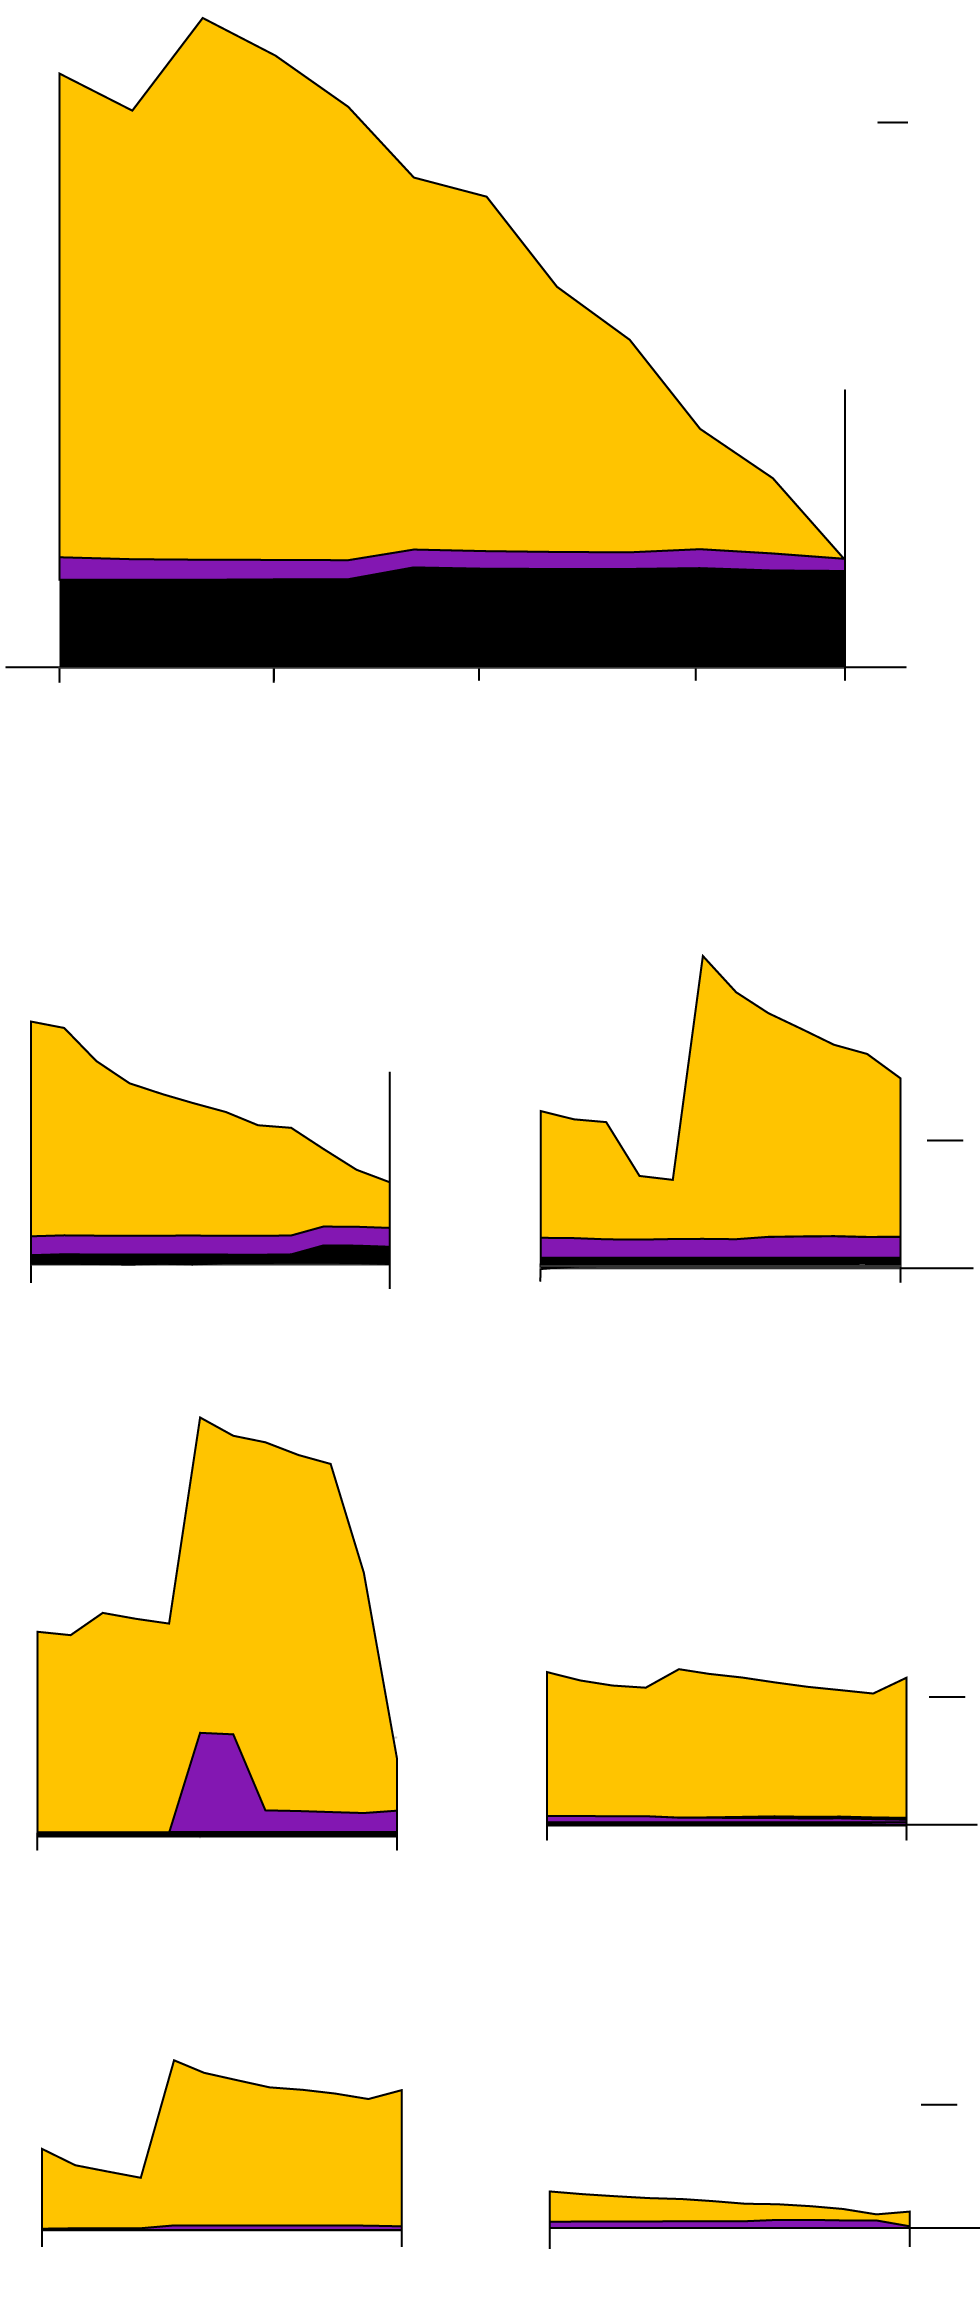
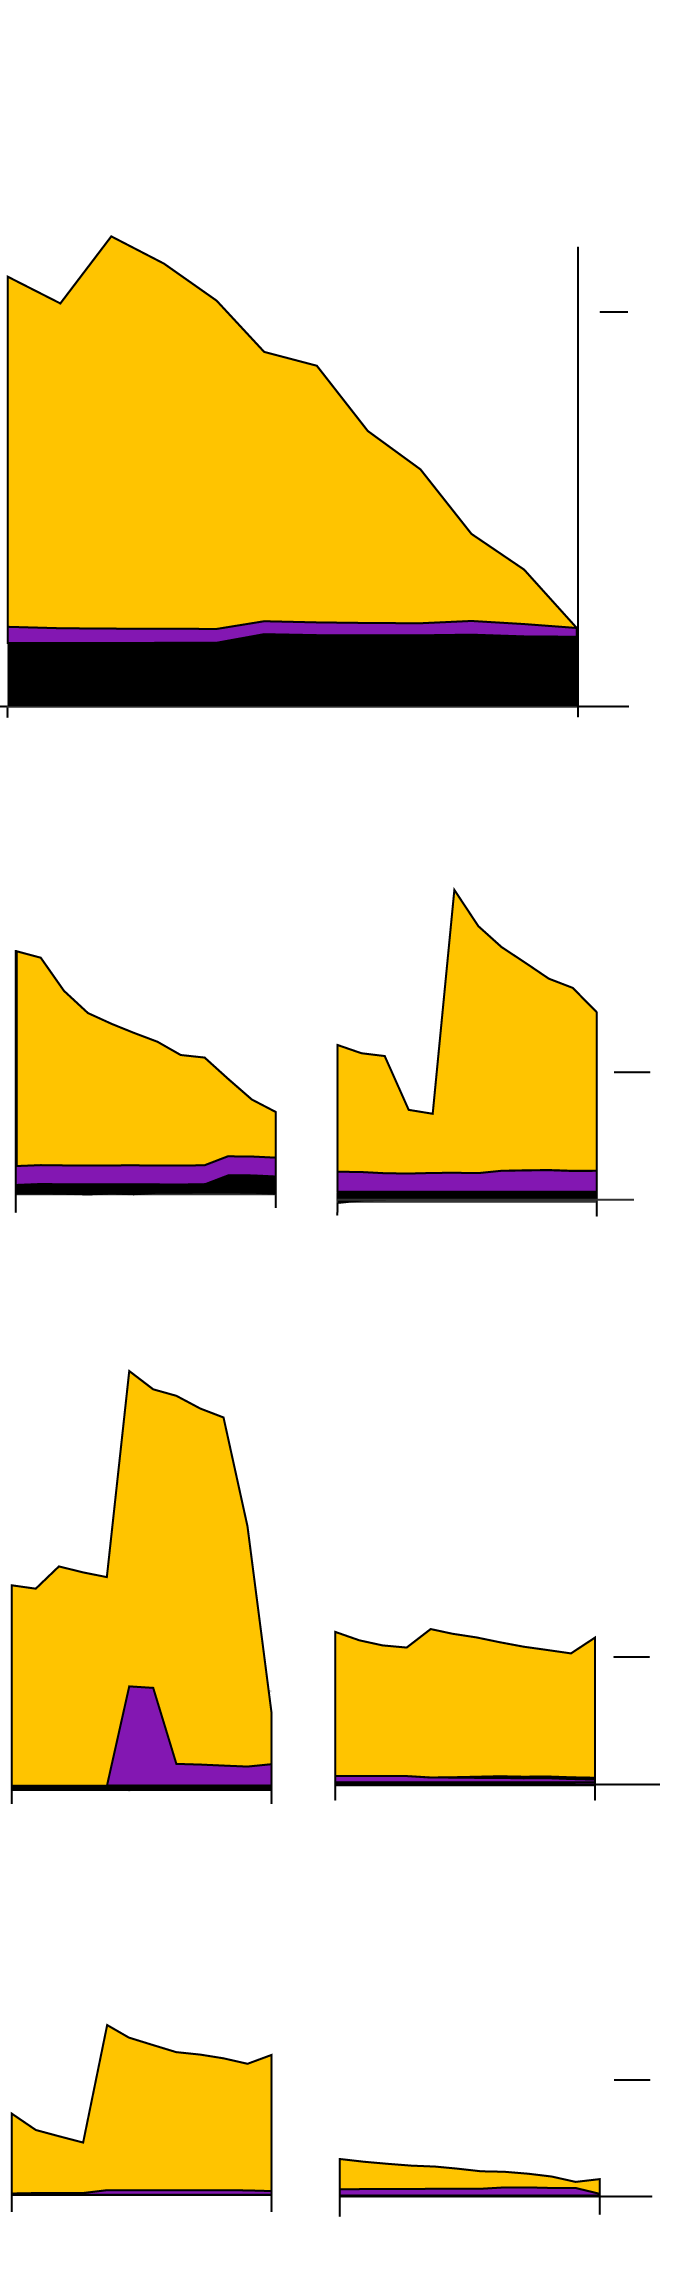
Data from FEMA shows that over 267,000 individuals and households have successfully registered for assistance through the Individual and Household Program run through the DRF for disasters declared this year. More than 2 million registered for assistance for disasters declared in 2022, including 1.2 million households in Puerto Rico following last year’s Category 4 Hurricane Fiona. Of the 1.2 million that registered, around 740,000 households were found eligible and received some immediate emergency assistance.
Millions in Aid to Disaster Victims

Tropical cyclone
Severe storm
Wildfire
Winter storm
Flooding
$100M
$25M
$5M
Flooding
California
Hurricane Fiona
Puerto Rico
2022
Hurricane Ian
Florida
Typhoon
Mawar
Guam
Severe storm
Illinois
2023
Hurricane Idalia
Florida
January
April
July
October
January

Tropical cyclone
Severe storm
Wildfire
Winter storm
Flooding
$100M
$25M
$5M
Flooding
California
Hurricane Fiona
Puerto Rico
2022
Hurricane Ian
Florida
Typhoon
Mawar
Guam
Severe storm
Illinois
2023
Hurricane Idalia
Florida
January
April
July
October
January

Tropical cyclone
Severe storm
Wildfire
Winter storm
Flooding
$100M
$25M
$5M
2022
Hurricane Fiona
Puerto Rico
Hurricane Ian
Florida
2023
Hurricane Idalia
Florida
January
April
July
October
January

Tropical cyclone
Severe storm
Wildfire
Winter storm
Flooding
$100M
$25M
$5M
Hurricane Fiona
Puerto Rico
2022
Hurricane Ian
Florida
Typhoon
Mawar
Guam
Severe storm
Illinois
2023
Hurricane Idalia
Florida
January
April
July
October
January
Over 57,000 households registered for some assistance for damage caused recently by Hurricane Idalia, though less than half were found to be eligible, according to preliminary FEMA data. FEMA has previously acknowledged inequities in its assistance programs with funds benefiting more affluent, whiter communities. Research shows that white Americans and communities they live in receive more aid than Black, Hispanic and Native American communities, for both pre-disaster projects and post-disaster recovery. That’s in part because whiter, more affluent communities tend to have more resources and better records needed to apply for funding
Disaster recovery itself can take years, and the DRF is still issuing funds for some extreme events that hit more than a decade ago. This year has seen $147 million in aid disbursed for assistance related to 2012’s Hurricane Sandy, $177 million for 2017’s Hurricane Harvey and over $5 billion in aid related to recovery from 2017’s Hurricane Maria.
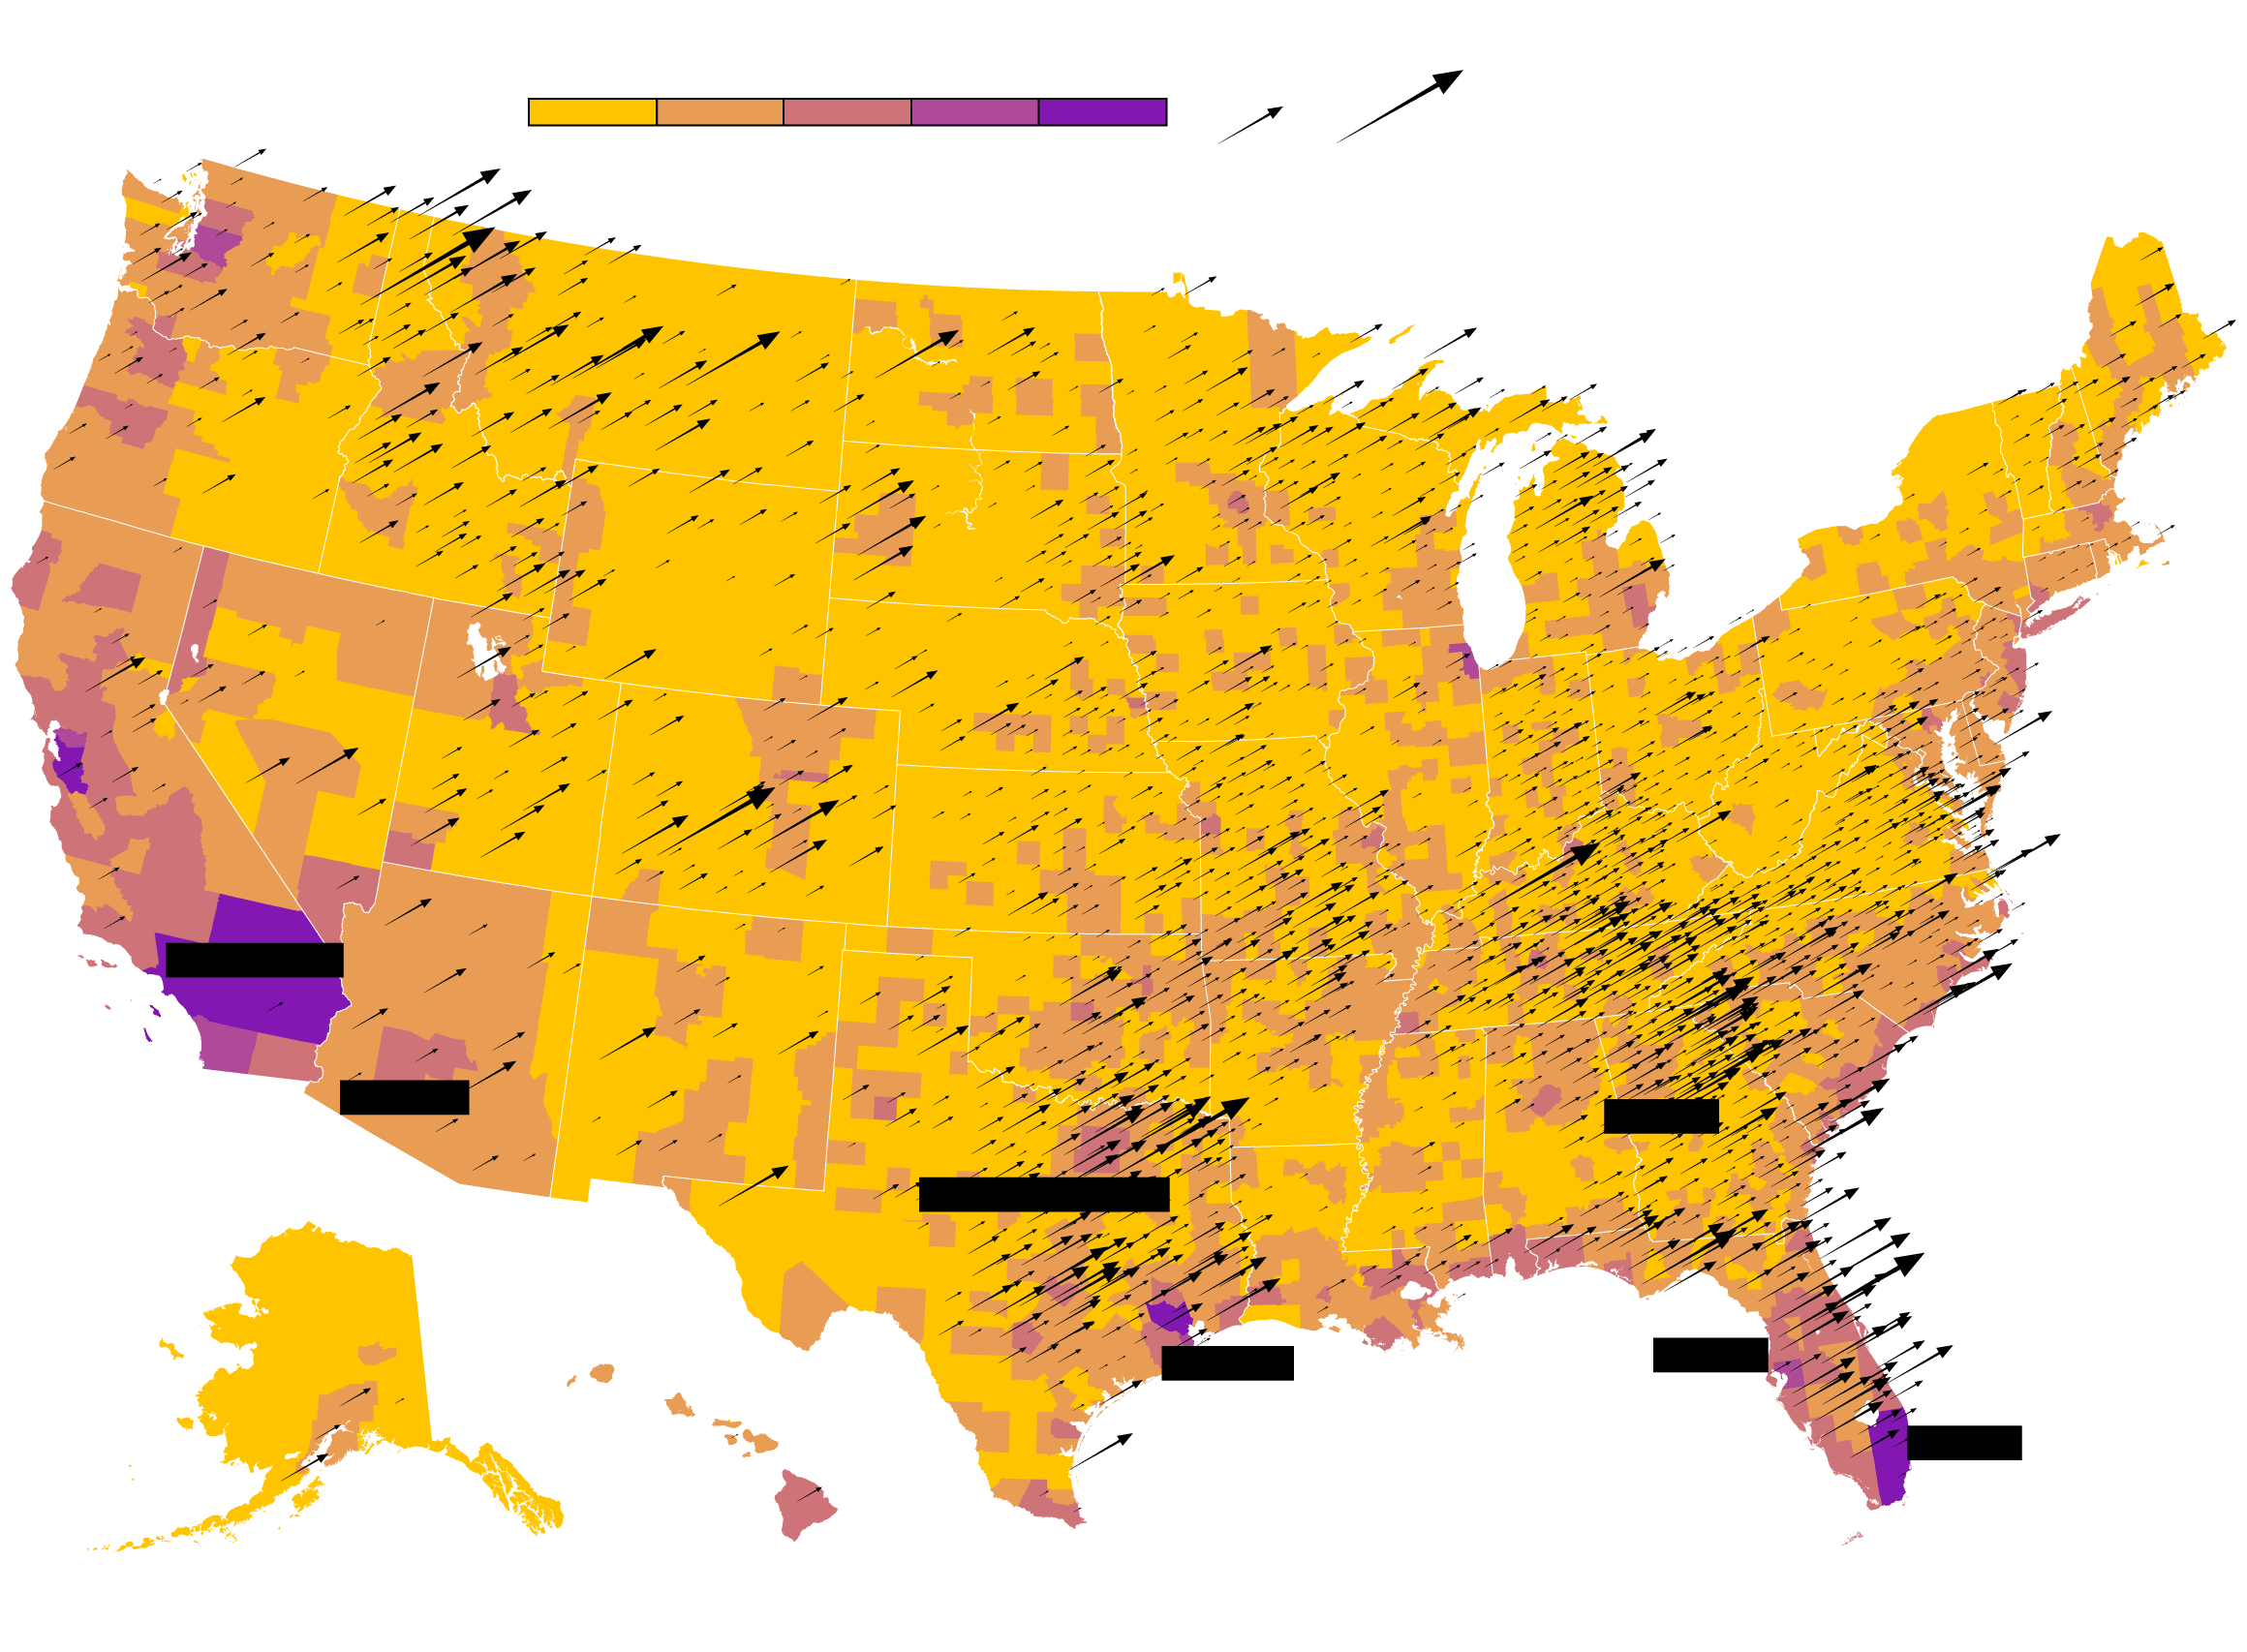
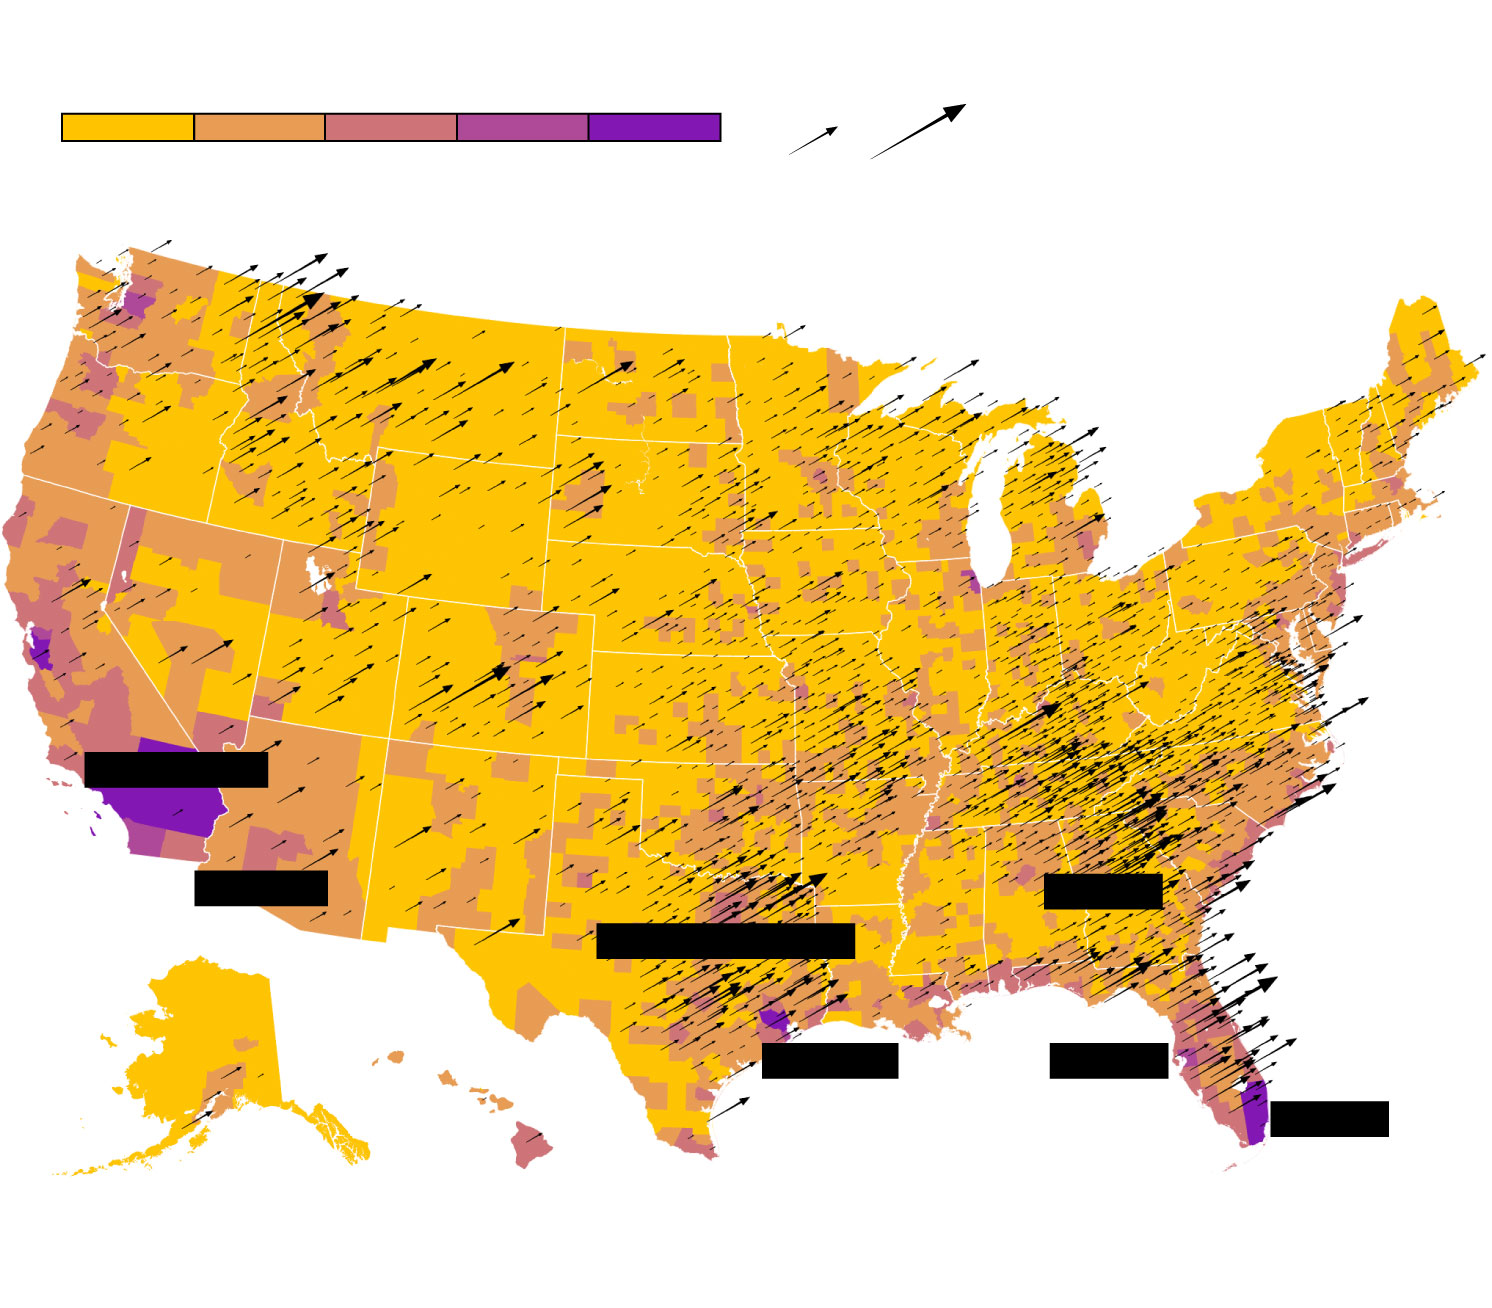
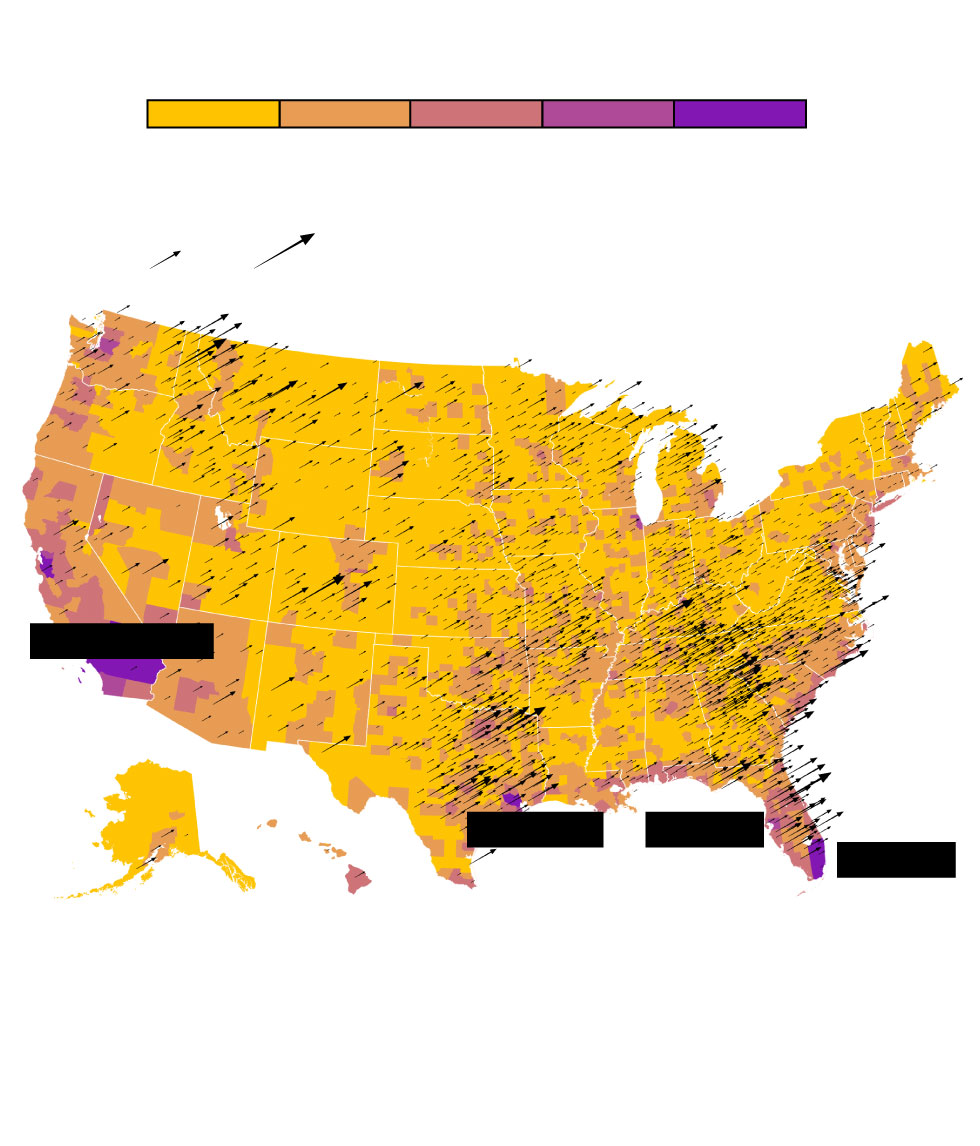
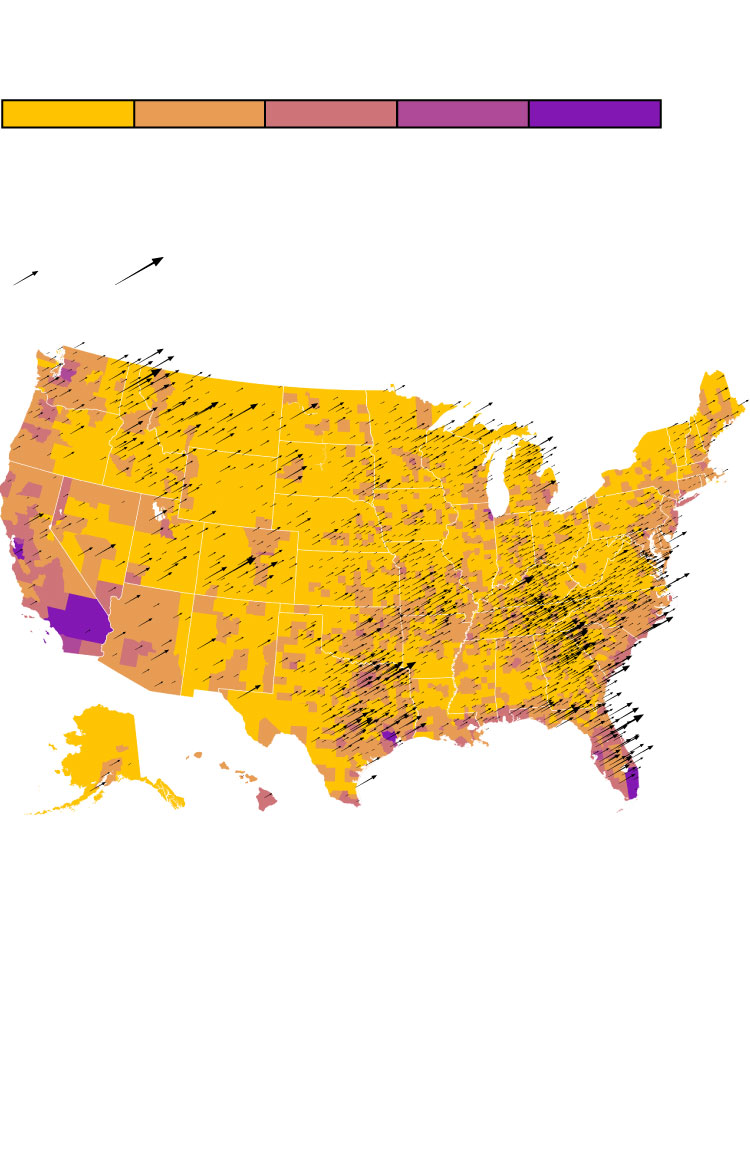
The rising cost of disasters is driven in part by more Americans moving into disaster-prone areas, and new developments are increasing the costs of recovery. Twenty-two of the 50 counties with the highest net migration rate between 2021 and 2022 were in Florida and Texas, according to data from the US Census Bureau. Some of these counties are in the most disaster-prone regions of the country along the coast and in well trodden hurricane paths.
According to FEMA’s National Risk Index — developed as a baseline measurement of natural disaster risk across the country — 28 out of Florida’s 67 counties have a relatively or very high natural disaster risk rating. The state’s total expected annual economic losses are over $9 billion. Estimated annual losses from natural disasters for Texas are around $8 billion, though both Florida and Texas are eclipsed by California, where estimated losses exceed $16 billion.
Growing Areas Are Also Some of the Most Vulnerable
Estimated overall risk in dollars
Net migration per 1,000 people 2021-2022
10M
100M
500M
1B
$6B
+40
+80
Los Angeles
Phoenix
Atlanta
Dallas–Fort Worth
Tampa
Houston
Twenty-two of the top 50 counties with the largest net migration rates between 2021 and 2022 are in Florida and Texas — including counties near Tampa and Houston.
Miami
Estimated overall risk in dollars
Net migration per 1,000 people 2021-2022
+80
10M
100M
500M
1B
$6B
+40
Los Angeles
Phoenix
Atlanta
Dallas–Fort Worth
Houston
Tampa
Miami
Twenty-two of the top 50 counties with the largest net migration rates between 2021 and 2022 are in Florida and Texas — including counties near Tampa and Houston.
Estimated overall risk in dollars
10M
100M
500M
1B
$6B
Net migration per 1,000 people 2021-2022
+40
+80
Los Angeles
Houston
Tampa
Miami
Twenty-two of the top 50 counties with the largest net migration rates between 2021 and 2022 are in Florida and Texas — including counties near Tampa and Houston.
Estimated overall risk in dollars
10M
100M
500M
1B
$6B
Net migration per 1,000 people 2021-2022
+40
+80
Houston
Tampa
Miami
Twenty-two of the top 50 counties with the largest net migration rates between 2021 and 2022 are in Florida and Texas — including counties near Tampa and Houston.
To make matters worse, insurance prices are rising dramatically in places that have been hard hit by disasters. In some areas— notably Florida, Louisiana and California — private insurers are significantly reducing coverage, leaving federal and state governments to step in and offer plans of last resort.
The danger is that homeowners will skip insurance or under-insure to lower costs, making them more likely to turn to the DRF. Thirty-four percent of homeowners who applied and found eligible for assistance for all types of disasters this year do not have homeowner’s insurance, according to FEMA data, while 94% of those homeowners do not have flood insurance. (Flood insurance is only required for people with federally backed mortgages in FEMA-designated severe flood zones.)
While FEMA’s DRF individual assistance is a lifeline, it covers only a small portion of steep costs homeowners face. This means that, especially for poorer individuals and communities, recovery may never be fully possible after a severe disaster.
For the DRF, it means that funding crises — like the storms they follow — are likely to become a more frequent and urgent occurrence.