How Fixes to the $800 Billion Covid Relief Program Got Money to More Small Businesses
Policy changes to the Paycheck Protection Program, one of the largest in US history, redirected loans to the neediest communities. An analysis of 2020 and 2021 lending data shows what happened.
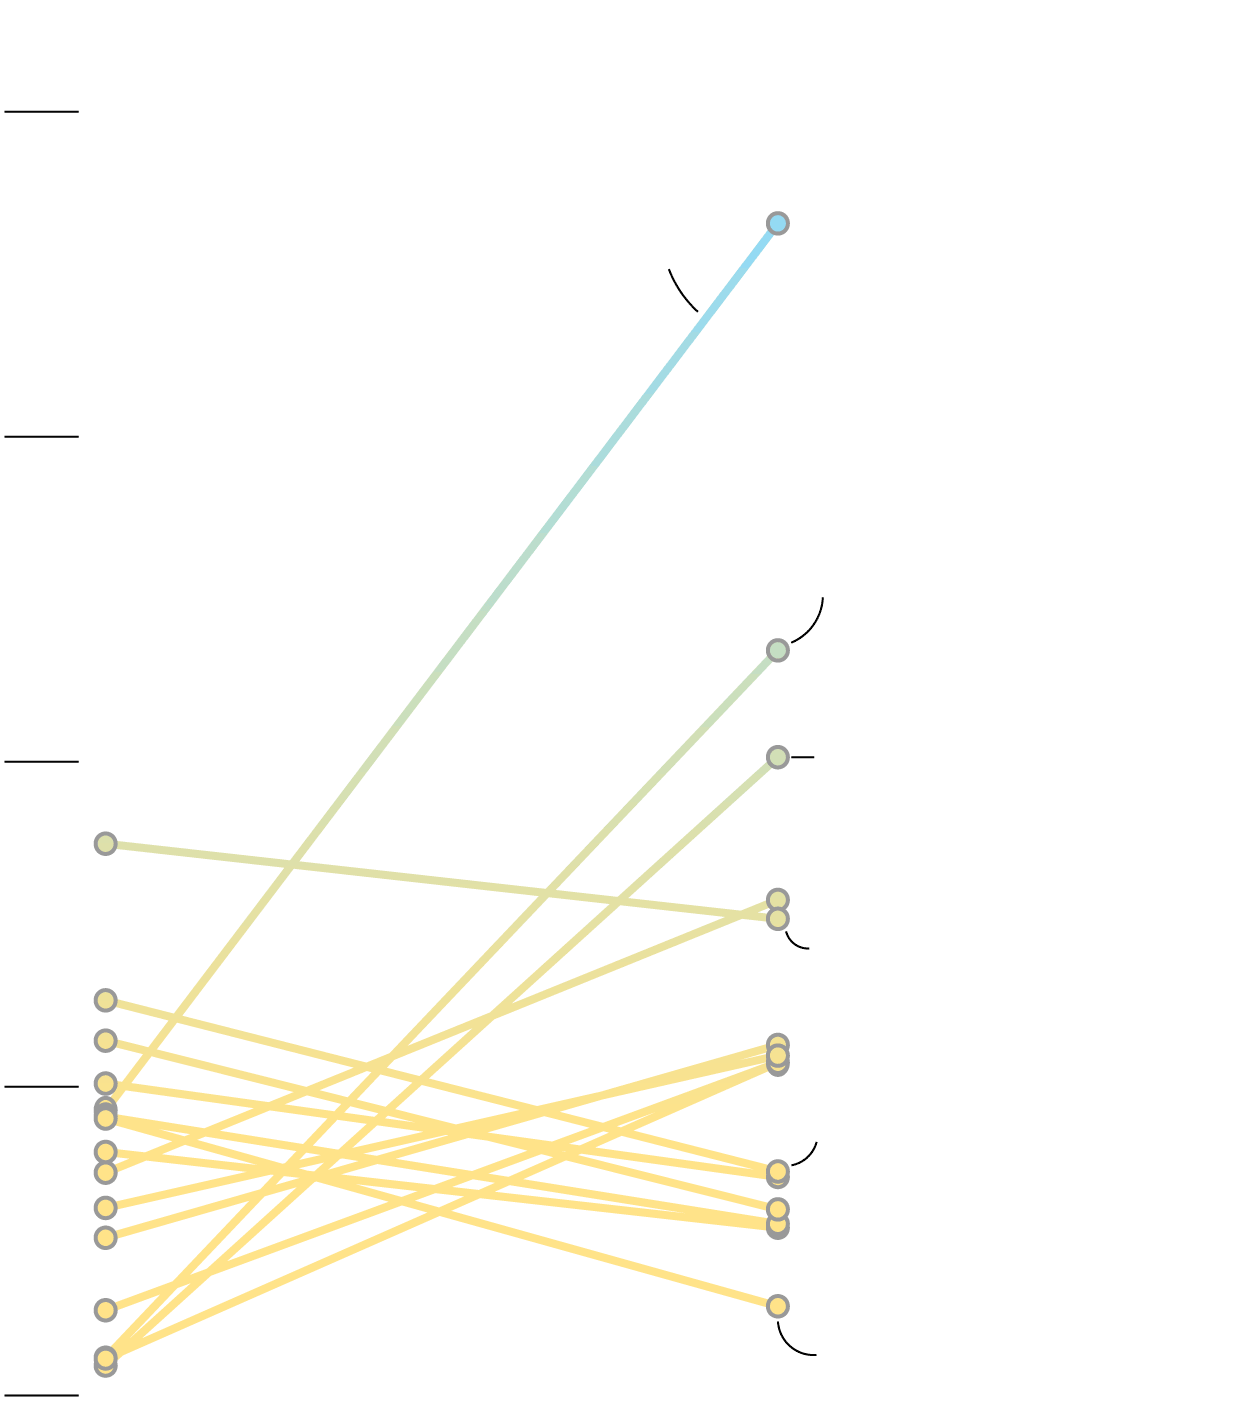
To see the difference between year one and year two of the US Paycheck Protection Program, just look to Baton Rouge, Louisiana.
In 2020, when the US announced emergency loans to help small businesses struggling under Covid-19 shutdowns, funding went disproportionately to the higher-income zip codes of Louisiana’s capital. Better-resourced firms such as medical and legal offices collected most of the relief aid. But in 2021, more loans went to lower-income neighborhoods of the city—to beauty salons, barber shops, day care centers and other more vulnerable enterprises, according to a Bloomberg analysis of Small Business Administration data updated last month.
Local Loans to Lower-Income Neighborhoods


So, what changed? By 2021, the Small Business Administration, the program’s administrator, had admitted about 600 new lenders, including small community banks that serve minorities, and allowed more sole proprietors and self-employed people to participate. The SBA also kicked off its later round of lending in 2021 by prioritizing applications from businesses with fewer than 20 employees during the first two weeks.
In communities across the country, these changes resulted in smaller-sized loans going to a much larger number of smaller businesses, many of whom didn’t have established ties to the big banks that dominated the early part of PPP. In total, businesses have received 11.5 million loans through the $800 billion aid program, which is one of the biggest in US history. Data about the program also provides unprecedented insight into small business lending, particularly into racial demographic data not previously collected on a large scale.
In Baton Rouge, the average loan size shrunk to about $32,000 in 2021 from nearly $110,000 in 2020. More than 3,600 beauty salons and barbershops in the metro area received loans in the program’s second year, compared with about 300 in 2020. One of those early recipients was Lux Salon, owned by Greg Metzler and his husband Nathan Matticks. They had a record year in 2019 with $1.1 million in sales and 13 stylists. Then Covid hit.
“I freaked out,” Metzler said. “When the doors were shut, and there was no money coming in, I had a complete meltdown of just stress, and I thought ‘I’m 55, this is my entire future, this is everything I’ve built.’”

After Congress passed the CARES Act in March 2020 to provide a range of relief aid to businesses and individuals, Metzler was able to secure a $100,000 forgivable, low-interest and uncollateralized PPP loan, money he used to pay staff and catch up on rent. “It helped me to not fall behind” in the pandemic’s early stages, he said.
But it’s a second loan of a similar amount that Metzler managed to secure in 2021 that made the biggest impact. “Round two of PPP was truly a savior,” he said. Because of the greater flexibility in how to spend the money, Metzler was able to put some of it away, and pay off remaining debt. The original 2020 loan came with a major obligation attached: Burn through the money in eight weeks.
In its first year, PPP lending faced a considerable amount of backlash. In order to deploy funds as fast as possible, the US enrolled big banks to distribute the loans, citing the pre-existing relationships banks had with businesses across the country. The ripple effect was that the distribution of these loans was skewed, with many smaller businesses shut out of the first tranche of loans in April 2020, which was depleted within two weeks.
It later emerged that some recipients of those initial loans weren’t exactly among the most needy. Kanye West and football player Tom Brady notoriously got relief aid, as did fast food chain Shake Shack, which returned its loan after a public outcry.
“The flow of PPP dollars followed the path of pre-existing inequities within the financial system,” according to a blog post from advocacy group Hope Policy Institute in Mississippi. “The smallest businesses and businesses owned by people of color were largely ignored by large and regional banks.”
By PPP’s later phase in 2021, dozens of new lenders joined the program. They included smaller ones such as community development financial institutions (CDFIs), whose mission is to serve lower-income communities, as well as online “fintech” lenders.
By early 2021, loan data from the program’s second phase showed “a step in the right direction for our agency-wide mission to support the smallest of small businesses—mom-and-pop, women-and minority-owned businesses,” said Patrick Kelley, associate administrator for SBA.
The data from Baton Rouge exemplifies this shift. In 2020, CDFIs originated 16% of all PPP loans in the city and its metro area, with their share rising to nearly 40% in the program’s later phase. That’s in line with their increase nationally.
Across the US, those CDFIs, plus fintech lenders, helped get PPP loans to businesses with fewer employees. In the case of self-employed people, their share of loans grew from 9% in the program’s first phase to 86% in 2021, according to the Government Accountability Office.
That also meant more money for Black-owned businesses, since they are more likely to be sole proprietors and have relationships with non-traditional banks, according to Andrew Fitzgerald, vice president of the Baton Rouge Area Chamber. “And so they’re the highest propensity to not have access to that first batch of money,” he said.
Policymakers at a US Congressional hearing in March 2022 sought to understand whether smaller businesses in more need benefited from PPP loans as intended. The GAO found that revisions to the program’s guidelines helped reach more smaller businesses, minority enterprises and lower-income areas. Robert Fairlie, an economist at University of California, Santa Cruz, said during the hearing that “the rebooted program in 2021 appears to have been disbursed to communities of color as intended.”
Nearly 40% of PPP loans made by CDFIs were in low- and moderate-income areas compared to the program’s average of 28%, the SBA reported in 2021.
“With established relationships in lower-income communities, CDFIs were prepositioned to extend PPP loans to smaller businesses with smaller credit needs,” said Robert Barnes, president of PriorityOne Bank, a CDFI in Mississippi, during Congressional testimony this year.
In Mississippi, community banks made nearly 72% of the PPP loans to minority-owned small businesses, he said. Mississippi, one of the poorest US states, is home to 50 of the nation’s 68 CDFI banks. The state had the lowest average PPP loan size of about $43,000, still higher than PriorityOne Bank’s average PPP loan of $32,500, said Barnes, who is also a committee chair at the Independent Community Bankers of America, an industry association.
Across the US, average PPP loan sizes in 2020 were greater than $100,000, but by 2021 the profiles of PPP borrowers had shifted. Average loan sizes dropped to around $43,000, with more businesses such as beauty salons and taxi drivers getting aid, rather than car dealers and law firms, according to Bloomberg’s analysis.
Who Received PPP Loans
Tammy Critney is one of the three employees and transportation director of Louisiana Corporate and Executive Transport, a company whose primary business is airport transportation. When Covid started, she was hit hard, due to the almost complete shutdown of air travel.
Critney managed to secure a $8,500 PPP loan in 2020 and another for about $3,200 in 2021. Some later 2021 applicants were able to get more than $10,000 because of a rule change to the program in March, but she says the funding she got made a difference regardless.
“It helped, it helped, trust me,” she said. “When you’re not getting any money and you actually get money, it helps. If there was more, it could have helped more so. But it helped, and we couldn’t say that it didn’t.”

Another revelation from the PPP loans is the data itself. Banks are normally not required or allowed to collect racial or ethnic data on small business borrowers, unlike with mortgage borrowers where that information is collected under federal law. But CDFIs have a special mandate to serve underserved communities and often gather such data. And because so many CDFIs were involved in the program, the loans offer unprecedented granularity into borrower demographics, instead of using zip codes as proxies for race or ethnicity.
In 2021, CDFIs provided race data on 64% of PPP loans, ethnicity data on 66% and gender data on 74%. In contrast, large commercial banks (those with $10 billion or more in domestic assets) reported such data on fewer than 40% of their PPP loans in 2021.
Measuring Accountability
Better, more consistent data is needed to determine if small business loans are generally reaching minority owners who often have more barriers to accessing credit. To that end, the Consumer Financial Protection Bureau is working on a new regulation that will require lenders to collect racial demographic data on small business loan borrowers. Those rules under Section 1071 of the Dodd-Frank Act will be finalized next year after the CFPB considers some 2,100 comments from stakeholders. This coming finance regulation could be a game-changer for helping close racial inequities in lending.
But banks, especially independent and rural ones, are concerned about privacy issues for borrowers, additional costs and red tape. “This is entirely new territory. No one really knows what a compliance system will look like,” said Michael Emancipator, regulatory counsel at the Independent Community Bankers of America.
The CFPB contends that better data on small business loans will ease access to capital by allowing policymakers to more effectively target aid programs. The hope is that with transparency, more small businesses and local economies will prosper—and in a more equitable society.