
$30b
Annual flood damages, 2050
$18.8b
Annual flood damages, today
$4.2b
Total federal premium coverage, today
Most Americans Don’t Have Enough Flood Insurance for Climate Change
U.S. homeowners face $18.8 billion in flood damage annually. Insurance premiums set by the federal government for those homes would cover less than one quarter of that potential damage.
And the worst part? Nobody knew it until today.
These numbers come from a new report by First Street Foundation, a nonprofit dedicated to making climate risk more transparent. It’s the first public attempt to apply property-level flood risk data to individual home values, offering almost every homeowner in the U.S. an estimate of its actual monetary risk from flood damage.
Nearly four-and-a-half million homes have severe risk of flooding, according to First Street’s data, including many in wealthy enclaves such as ritzy Miami Beach and exclusive Bainbridge Island off the coast of Washington. “The pricing for these high-risk homes is not commensurate for the risk they carry,” said Matthew Eby, executive director of First Street. “Our data shows exactly where the price of insurance needs to be dramatically increased to cover the economic risk that flooding poses today, and into the future.”
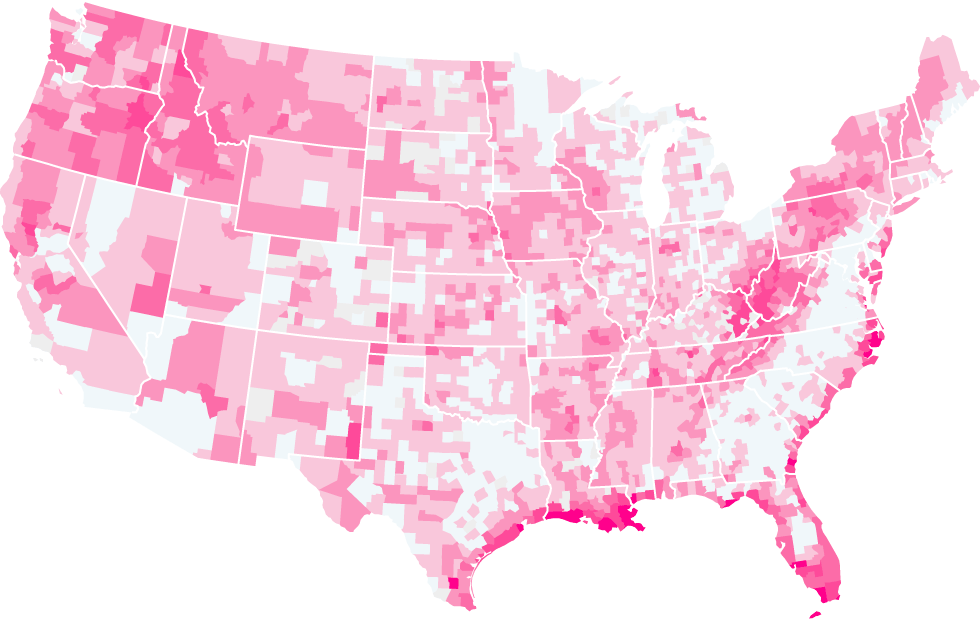
The Flood Risk Americans Face...

Average expected annual loss per property with substantial flood risk, 2021
0
$1k
$2k
$4k
$8k and up

Average annual loss per property ($250k cap)
0
$1k
$2k
$4k
$8k and up

Average annual loss per property ($250k cap)
0
$1k
$2k
$4k
$8k and up
Land subsidence, frequent storms, and sea-level rise have combined to make the risk particularly acute along the Eastern seaboard and Gulf Coast.
Seven of the 10 municipalities with the greatest flood risk are along the coast of Florida, including Miami Beach, St. Petersburg, and Cape Coral.
That specificity is a game changer, said Carolyn Kousky, executive director of the Wharton Risk Management and Decision Processes Center at the University of Pennsylvania. Kousky sits on First Street’s advisory board but didn’t participate in the study.
“Historically, the only way homeowners had to understand their risk was entirely based on probability—did their home sit in a flood zone or not,” she said. But calculating what that risk means in practical terms is far more complicated. “This explains, if a flood happens, what does it mean to me?” Kousky said. “It opens up a whole new conversation.”
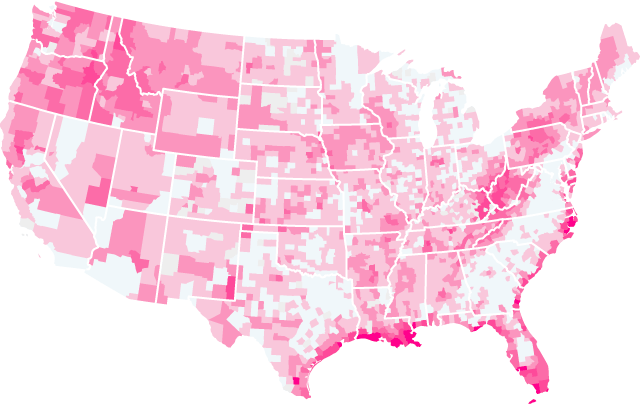
… Is Far Greater Than They’re Paying For

Difference between First Street average expected annual loss
compared to average NFIP premium
–100%
0
+100
+200
+500
+1000
+2000% and up

Difference between First Street average expected annual loss
compared to average NFIP premium
–100%
0
+100
+200
+500
+1000
+2000 and up

Difference between First Street average expected annual loss compared to average NFIP premium
–100%
0
+100
+200
+500
+1000
+2000% and up
Of the 10 municipalities with the greatest gap between premium rates and risk, nine are on the West Coast.
FEMA has wildly underestimated premiums in Appalachia, where homes aren't as fancy but are likely to incur frequent flood damage.
And not a moment too soon. Flooding already costs the U.S. billions of dollars every year, and climate change is making it worse. A recent study by Stanford University found that excess precipitation caused by climate change contributed to a third of flood damages over the last three decades, or about $75 billion worth.
Most private insurers pulled out of the market decades ago, leaving the National Flood Insurance Program, run by the Federal Emergency Management Agency, to manage 95% of residential flood insurance policies. It’s no secret that the program is woefully underfunded. NFIP is currently over $20 billion in debt, largely because it under-charges for premiums. The program has lost $36 billion in total since its inception in 1968; Congress forgave some of the debt in 2017.
FEMA, which breaks out flood risk by zones, knows it needs to update a system largely designed in the 1970s. For years it’s been working on a new system, known as Risk Rating 2.0, that will use moden insurance-industry techniques to evaluate risk at a property level and charge higher premiums when appropriate. Originally intended to go into effect in October of last year, FEMA announced in 2019 that it would delay until 2021. When it does finally roll out, it’s likely to face backlash from homeowners who say they can’t afford the higher cost. Political headwinds will almost certainly follow.
FEMA declined to comment on the timing of Risk Rating 2.0 and cast doubt on the foundation’s critique of its current premium prices.
Understanding specific monetary risk is how private insurers calculate premiums. The most common metric for this is called average annual loss, which is equal to the amount of damage expected, annualized over a period of time. The typical duration is 30 years, the length of the average mortgage. If a property is expected to experience just one flood over that span, and that flood causes $100,000 in damage, the property would have an average annual loss of $3,333. Premiums should cover that amount and then some.
First Street modeled every residential building’s average annual loss by considering value and structural characteristics. Here’s how.
=$500k
=$500k
=$500k
$300k
STRUCTURE
=$500k
$200k
LAND
$300k
STRUCTURE
=$500k
$200k
LAND
$300k
STRUCTURE
=$500k
$200k
LAND
$300k
Water to
building
Flooding
likelihood
36 in
.2%
30 in
1%
25 in
10%
18 in
20%
12 in
50%
$300k
Water to
building
Flooding
likelihood
36 in
.2%
30 in
1%
25 in
10%
18 in
20%
12 in
50%
$300k
Water to
building
Flooding
likelihood
36 in
.2%
30 in
1%
25 in
10%
18 in
20%
12 in
50%
$300k
Water to
building
Flooding
likelihood
36 in
.2%
30 in
1%
25 in
10%
24 in
First floor
elevation
18 in
20%
12 in
50%
$300k
Water to
building
Flooding
likelihood
36 in
.2%
30 in
1%
25 in
10%
24 in
First floor
elevation
18 in
20%
12 in
50%
$300k
Water to
building
Flooding
likelihood
36 in
.2%
30 in
1%
25 in
10%
24 in
First floor
elevation
18 in
20%
12 in
50%

Based on Army
Corps of Engineer
damage estimates
Annualized
costs
$300k
Flood
risk
Cost
.2%
×
$90k
=
$180
1%
×
$30k
=
$300
10%
×
$15k
=
$1,500
24 in
First floor
elevation
20%
×
0
=
0
50%
×
0
=
0
Average annual loss
=
$1,980

Based on Army
Corps of Engineer
damage estimates
Annualized
costs
$300k
Flood
risk
Cost
.2%
×
$90k
=
$180
1%
×
$30k
=
$300
10%
×
$15k
=
$1,500
24 in
First floor
elevation
20%
×
0
=
0
50%
×
0
=
0
Average annual loss
=
$1,980
Based on Army
Corps of Engineer
damage estimates
Annualized
costs
$300k
Flood
risk
Cost
.2%
×
$90k
=
$180
1%
×
$30k
=
$300
10%
×
$15k
=
$1,500
24 in
First floor
elevation
20%
×
0
=
0
50%
×
0
=
0
Average annual loss
=
$1,980

Based on Army
Corps of Engineer
damage estimates
Annualized
costs
$300k
Flood
risk
Cost
.2%
×
$90k
=
$180
1%
×
$30k
=
$300
10%
×
$15k
=
$1,500
24 in
First floor
elevation
20%
×
0
=
0
50%
×
0
=
0
Average annual loss
=
$1,980
Based on Army
Corps of Engineer
damage estimates
Annualized
costs
$300k
Flood
risk
Cost
.2%
×
$90k
=
$180
1%
×
$30k
=
$300
10%
×
$15k
=
$1,500
24 in
First floor
elevation
20%
×
0
=
0
50%
×
0
=
0
Average annual loss
=
$1,980

Based on Army
Corps of Engineer
damage estimates
Annualized
costs
$300k
Flood
risk
Cost
.2%
×
$90k
=
$180
1%
×
$30k
=
$300
10%
×
$15k
=
$1,500
24 in
First floor
elevation
20%
×
0
=
0
50%
×
0
=
0
Average annual loss
=
$1,980
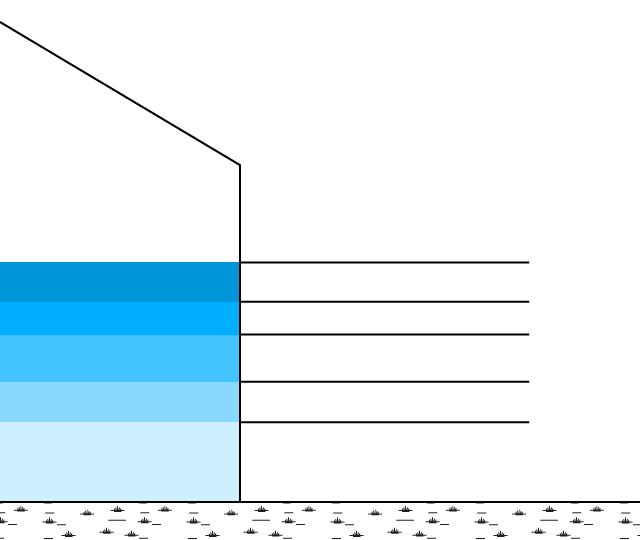
Let’s start with a property worth $500,000
Using an automated model, First Street breaks out how much of that value is the building vs. the land it’s built on. Let’s say this home’s structure is worth $300,000.
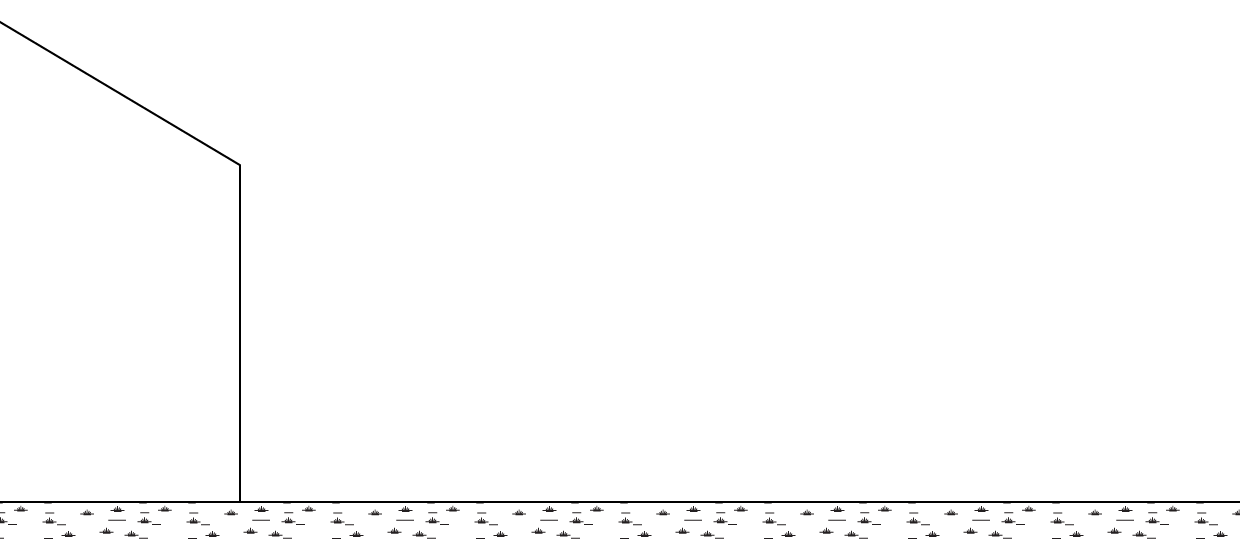
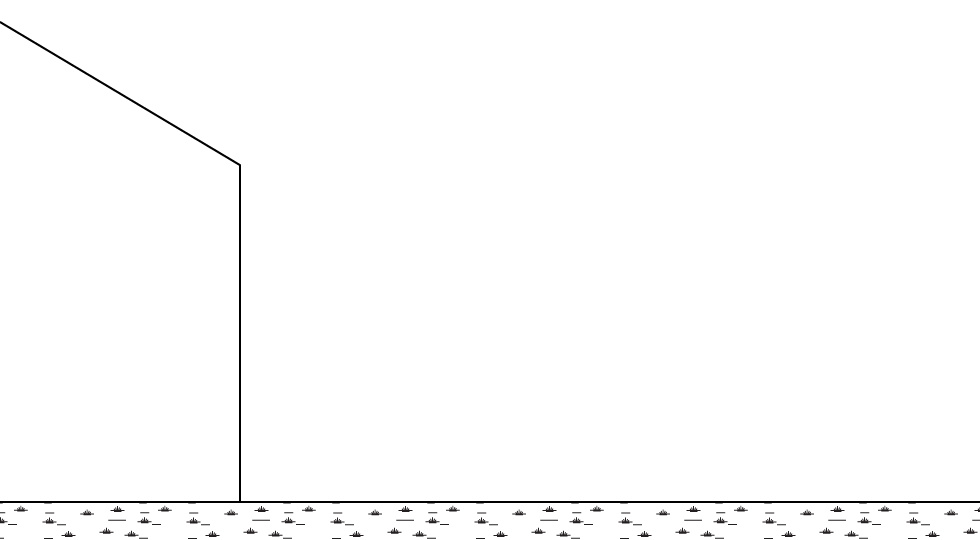
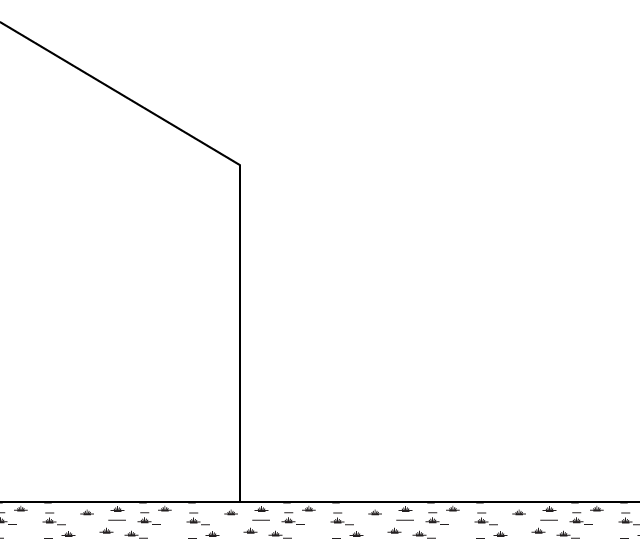
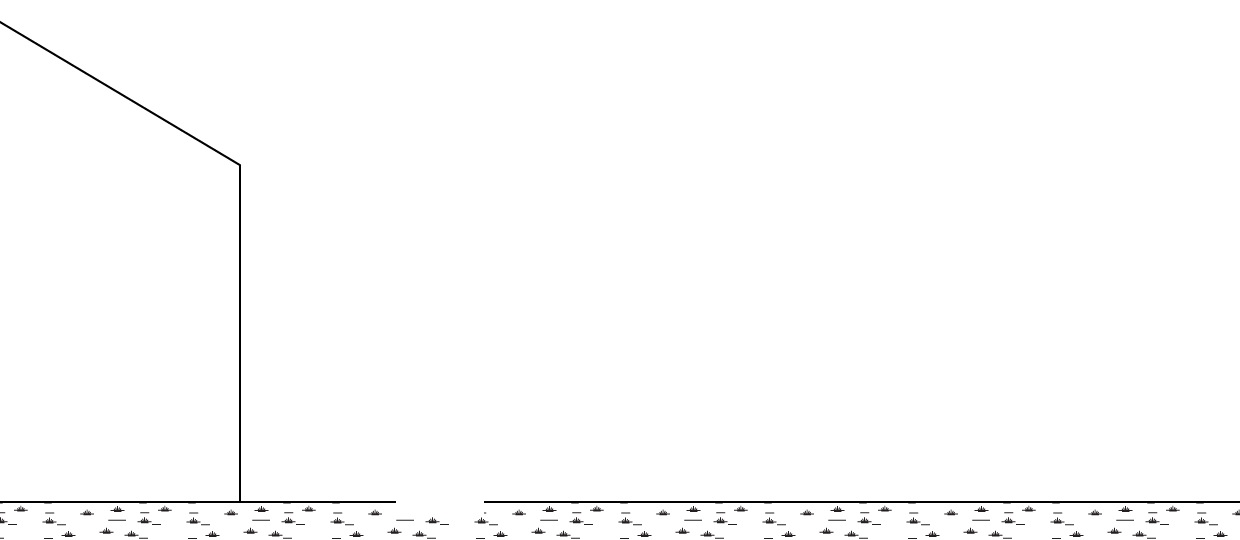
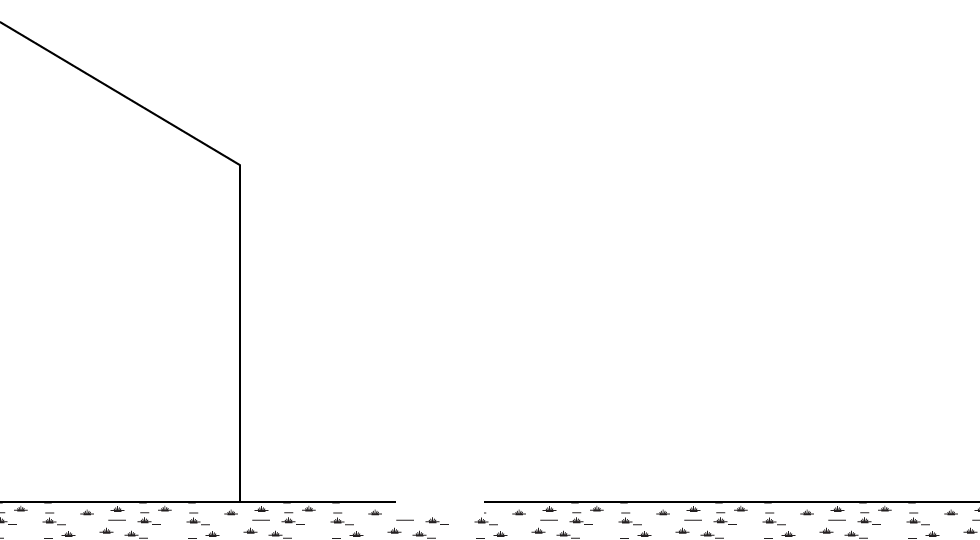
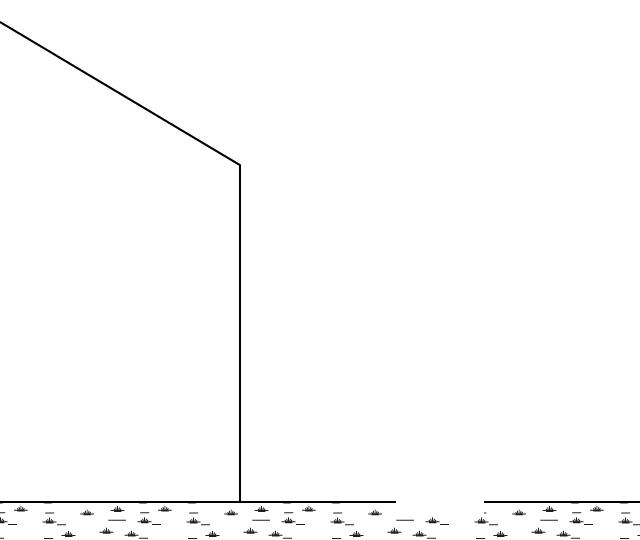
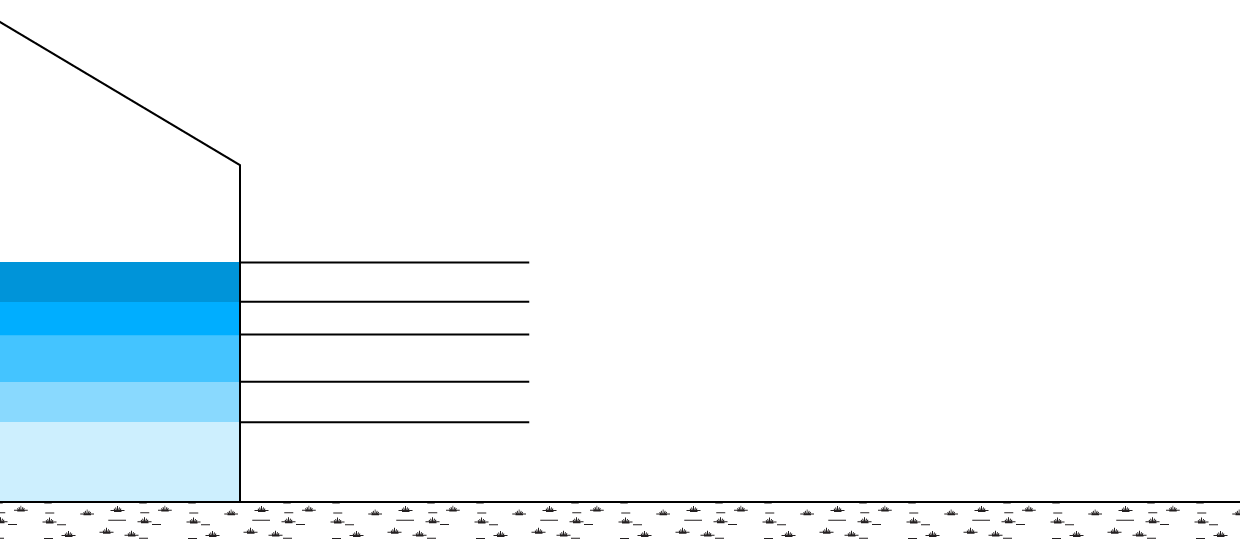
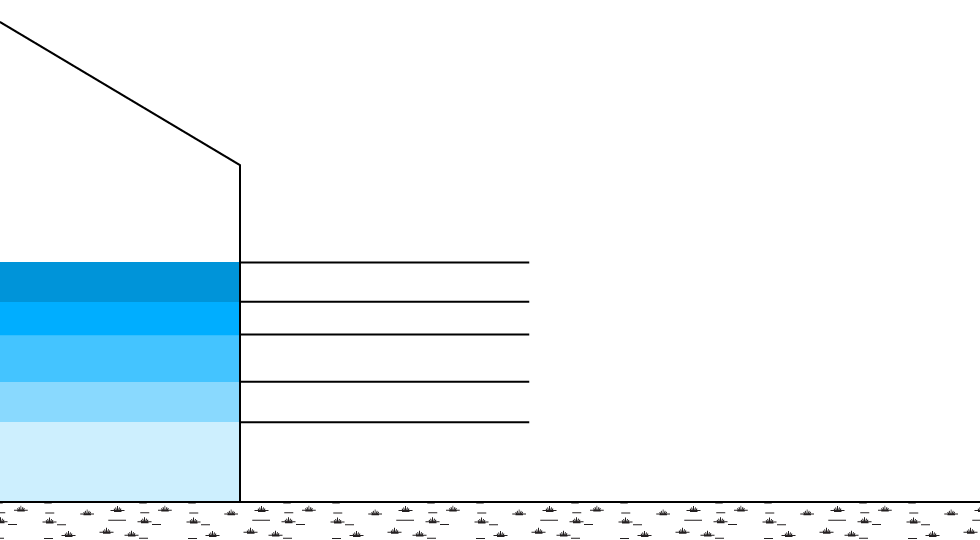
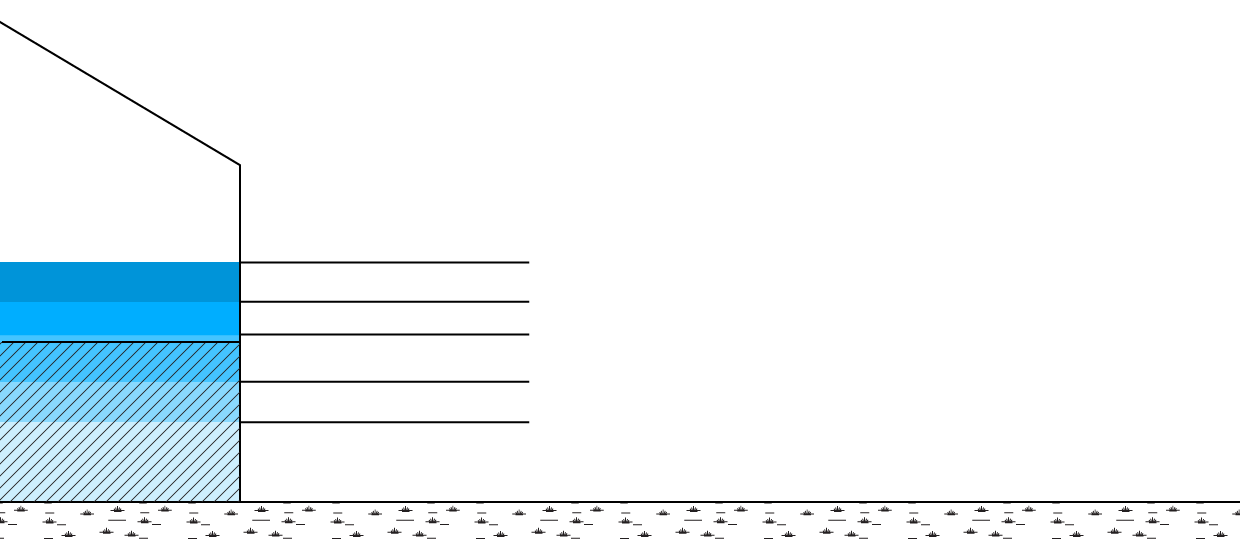
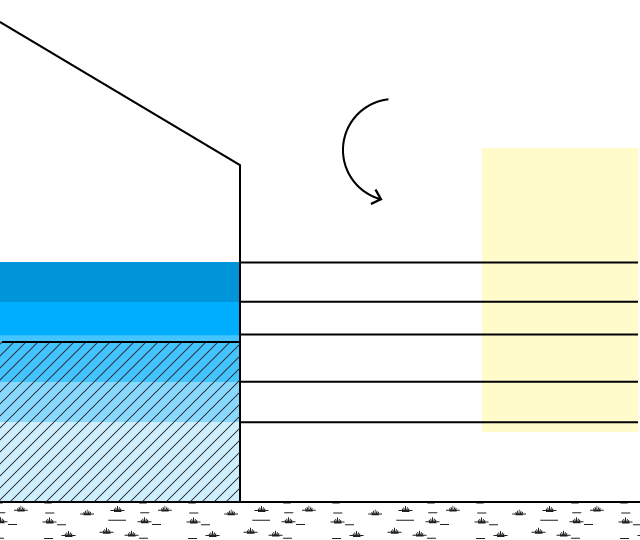
Next they determine the risks of various flood levels…
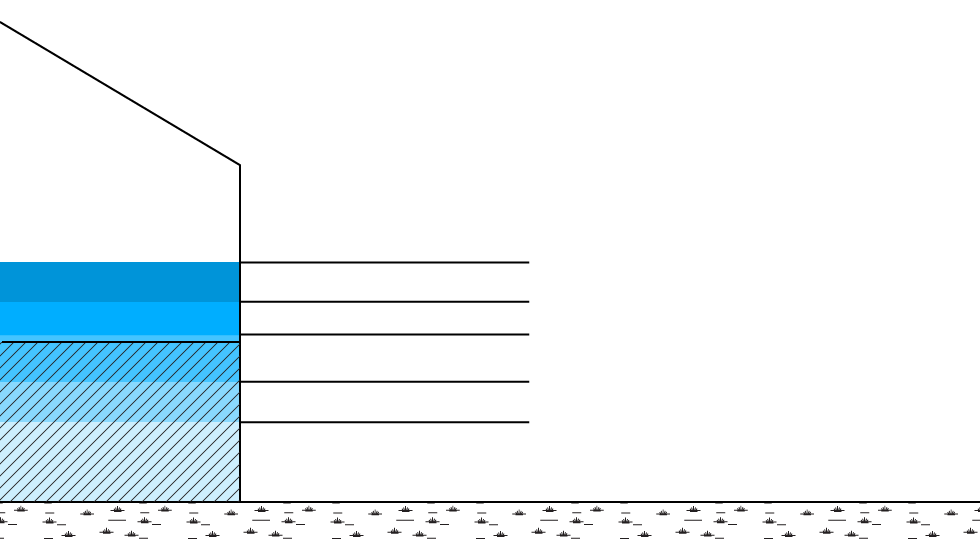
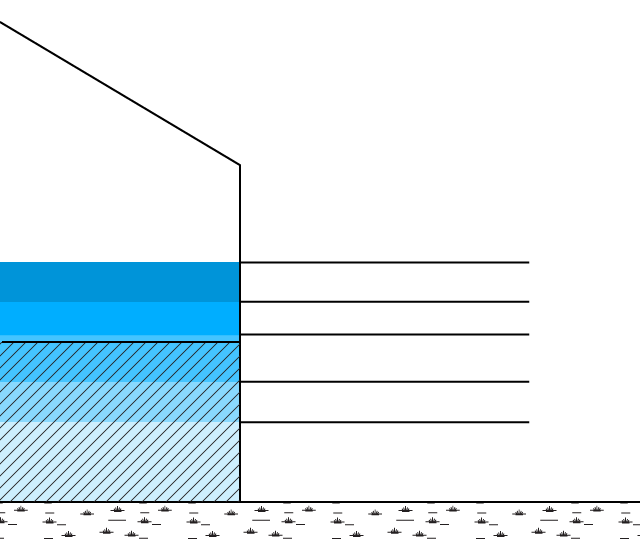
… and compare that to the first floor elevation, or how high the water would have to get before it started to cause structural damage.
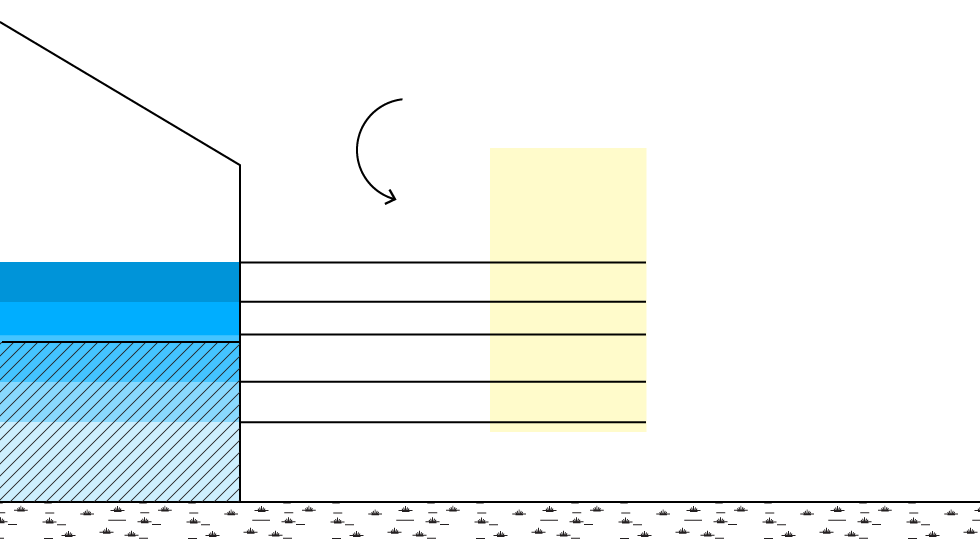
Using Army Corps of Engineers estimates of flood depth and damage potential, First Street calculates the cost of damage for each flood level.
Multiplying the risk by the structure worth gives you the cost per flood event. The annualized risks can then be added to find the average annual risk per property.
Actual losses could well exceed the $18.8 billion calculated by First Street’s analysts. That’s because their model capped losses per home at $250,000, the maximum payout under the federal flood insurance program. The cost of the damage to the most expensive homes could be far greater, they said.
The changing climate will also raise those numbers considerably. Assuming those same homes don’t make major modifications, First Street sees total damages rising by 61% over the next 30 years, according to their calculations, to more than $30 billion a year, even assuming that payouts remain capped.
First Street is the same organization that, last June, released the first-ever public evaluation of flood risk for every property in the 48 contiguous states. It found that 14.6 million homes face a high likelihood of flood, or 6 million more than the federal government designates in its severe risk zones.
This report adds an interesting nuance to the earlier numbers: Of those 14.6 million homes at severe risk for floods, only 4.3 million are at severe risk for damage. Jeremy Porter, who leads research at First Street, said the difference can in part be explained by the fact that some homes within flood zones have natural features that protect them, such as being built on a hill. He also notes that building codes work. “Ten million are built to standards that protect against flood,” he said.
First Street’s analysts calculated premiums for homes both inside and outside the zones currently designated as severe flood risks by FEMA. Homes inside those zones that have federally backed mortgages must buy flood insurance; homes outside those government-drawn boundaries have the option. The government doesn’t reveal which homes actually pay for the insurance, so it’s impossible to know how many of the 4.3 million homes eligible for the highly subsidized insurance are covered by it.

Mapping America’s Underwater Real Estate
First Street makes much of its residential data and analysis widely accessible, posting it for free on its website. It also works with leading real estate sites Realtor.com and Redfin.com to incorporate their flood-scoring system into the home-buying process.
In theory, the report could have a significant impact on the housing market by informing both homeowners and would-be buyers how much they’ll be paying for insurance if the system is ever expanded and rationalized—and how much they’ll be on the hook for if not. First Street estimates, for instance, that FEMA sets the average annual premium for one of the 547 homes on Bainbridge Island with severe risk of flood damage at $793, when the actual risk is over $74,000— 9,253% as high.

Over the next 30 years, Louisiana—which already experiences sea level rise of one to two inches per year—will be particularly hard hit. The unincorporated community of Prien outside of Lake Charles, for instance, has 653 residences with average annual losses of $2,353. In 30 years, that will increase to $41,500. While that was the single largest percentage increase of any municipality, First Street identified similar stories all along the Louisiana, Alabama, and Florida coasts, where current adaptation measures will become obsolete over time.
Of the 10 places with the widest gap between premium rates and risk, nine were on the West Coast, including Malibu and Huntington Beach, Calif. What do most of these communities have in common? A combination of sky-high property values and rising flood risk that hasn't been priced into the equation. At least not yet.