A $9 Trillion Binge Turns Central Banks Into the Market’s Biggest Whales
Central banks’ record spending blitz and what it means
Since the start of the pandemic, central banks in the U.S., Europe and Japan have been on a $9 trillion spending spree.
That binge has turned the U.S. Federal Reserve, the European Central Bank and the Bank of Japan into the ultimate market whales, swelling their combined assets to $24 trillion. Now, talk is shifting to winding down the banks’ massive monetary stimulus and the challenge that presents for the economies they support.
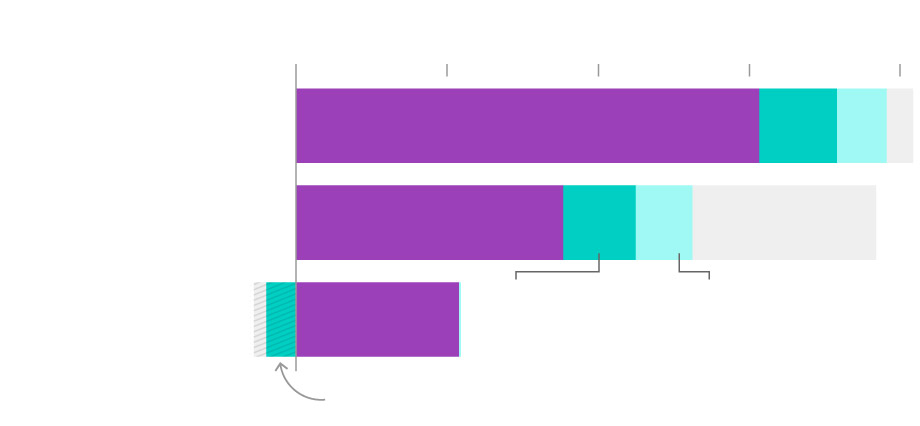
Take a look at just how large that asset pool is:
Here’s how it compares to the market capitalization of some of the biggest companies.
That binge has turned the U.S. Federal Reserve, the European Central Bank and the Bank of Japan into the ultimate market whales, swelling their combined assets to $24 trillion.
Now, talk is shifting to winding down the banks’ massive monetary stimulus and the challenge that presents for the economies they support.
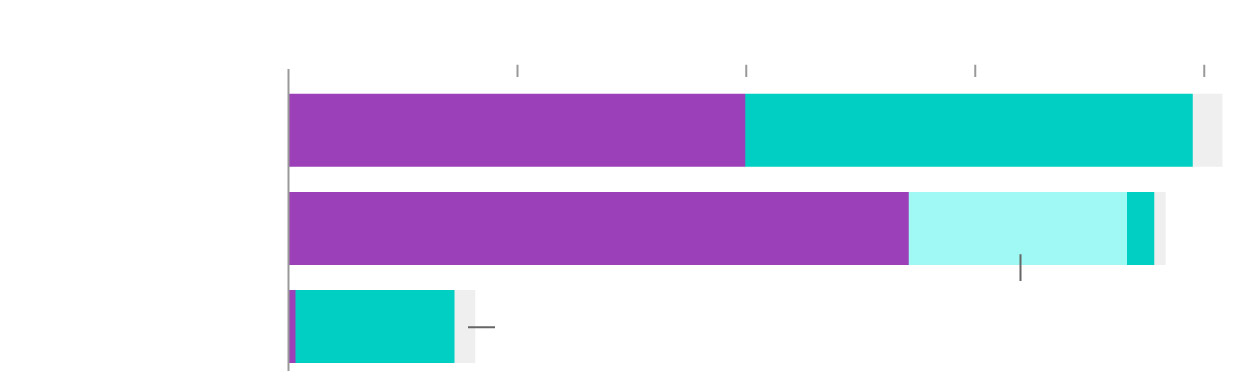
So where has all the central banks’ money gone?
They bought a lot of bonds, of course, helping their governments fund stimulus programs.
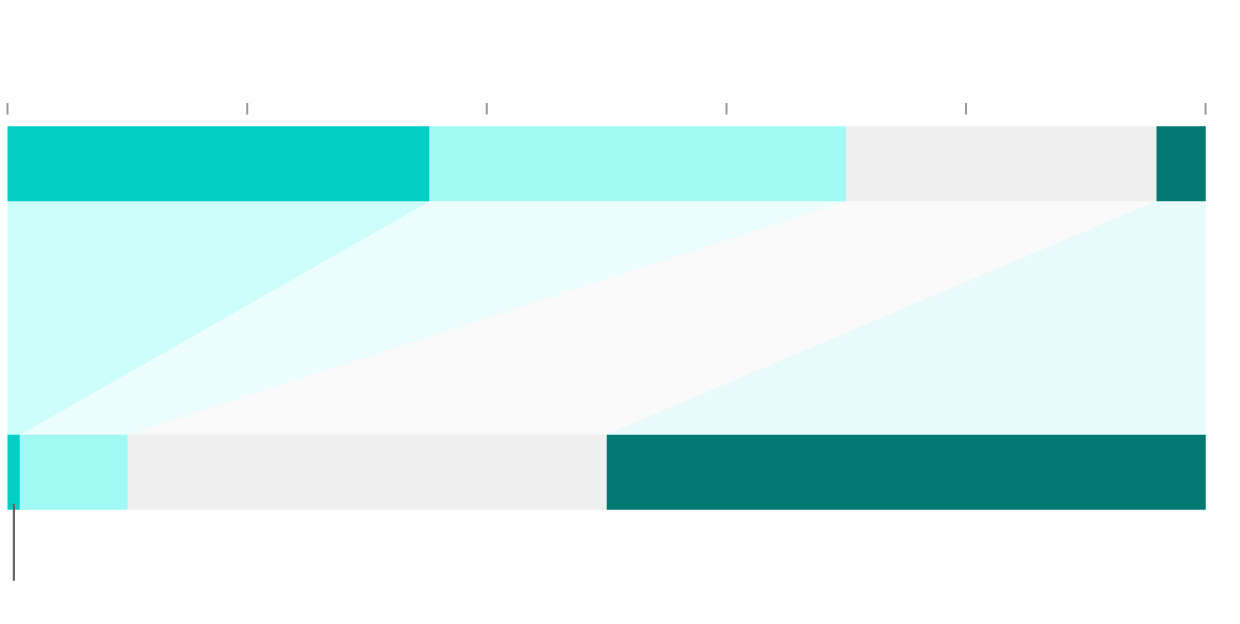
ASSETS ADDED SINCE MAR. 2020
0
1
2
3
$4 TRILLION
European
Central Bank
BONDS
LOANS
Federal Reserve
MORTGAGE-BACKED
SECURITIES
Bank of Japan
OTHERS
ASSETS ADDED SINCE MAR. 2020
0
1
2
3
$4T
European
Central Bank
BONDS
LOANS
Federal Reserve
MORTGAGE-BACKED
SECURITIES
Bank of Japan
OTHERS
European
Central
Bank
Bank of
Japan
Federal
Reserve
0
BONDS
1
OTHERS
2
LOANS
3
MORTGAGE-BACKED
SECURITIES
$4T
ASSETS ADDED
SINCE MAR. 2020
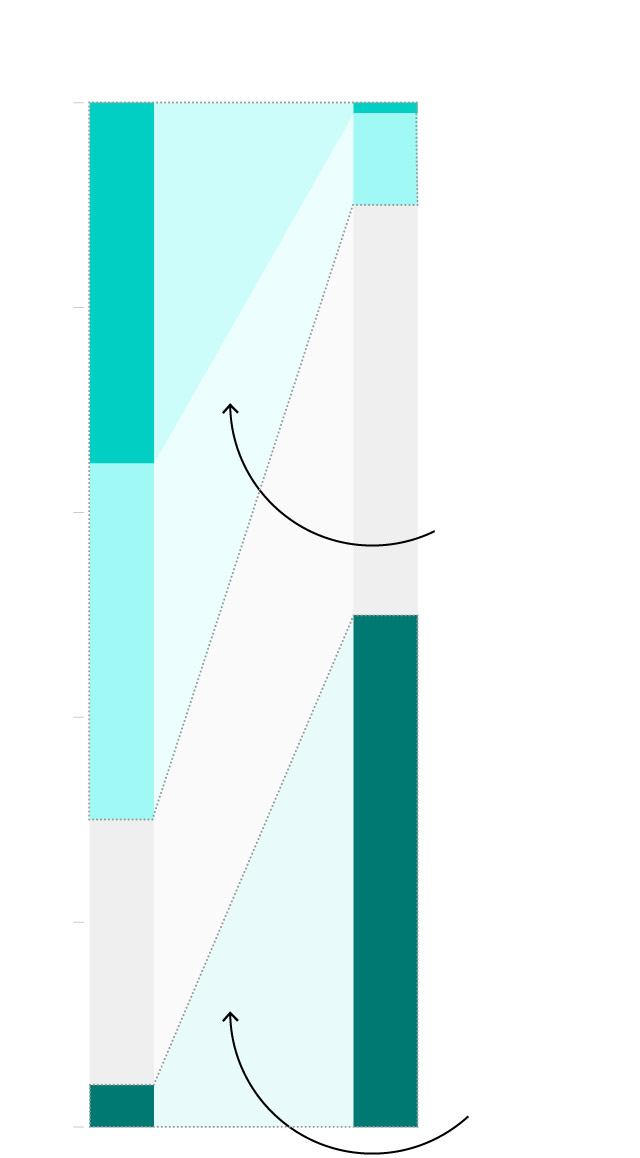
The Fed bought a higher proportion of mortgage-backed securities than its counterparts, desperate to shore up a sector that caused so much trouble during the global financial crisis of 2008. In fact, it spent enough on these assets to buy more than a million homes in New York. Some Fed officials think that mortgage-backed securities are where spending should slow first.
The ECB and BOJ did more with loans, keeping businesses afloat, workers in jobs and preventing bad debts from piling up at banks. Indeed, the Japanese central bank’s extra lending would cover the debts of every company that has gone out of business in the country since the autumn of 2003.
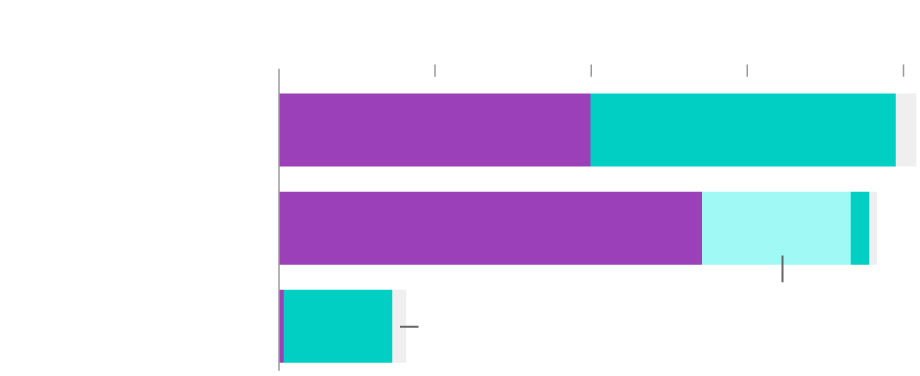
What do the central banks actually “owe?”
Central banks follow basic accounting rules, just like the rest of us, so all those trillions of dollars in assets have liabilities to match. During the pandemic, a lot of that has ended up as bank deposits, keeping lenders flush with liquidity. Getting that money pumping through the economy will be key to sustaining the recovery as central banks dial back stimulus. Government deposits and currency in circulation have also climbed in Europe and the U.S.
LIABILITIES ADDED SINCE MAR. 2020
0
1
2
3
$4 TRILLION
European
Central Bank
Banking sector deposits
Federal Reserve
Government
deposits
Currency in
circulation
OTHERS
Bank of Japan
Deposits reduced
LIABILITIES ADDED SINCE MAR. 2020
0
1
2
3
$4T
European
Central Bank
Banking sector deposits
Federal Reserve
OTHERS
Government
deposits
Currency in
circulation
Bank of Japan
Deposits reduced
European
Central
Bank
Bank of
Japan
Federal
Reserve
Deposits reduced
0
1
Banking
sector
deposits
Government
deposits
2
Currency in
circulation
3
OTHERS
$4T
LIABILITIES ADDED
SINCE MAR. 2020
Has the binge really helped the economy, or just asset prices?
Clearly, the global economy would be in a worse position now if central banks hadn’t jumped in to help avert a financial crisis. And governments wouldn’t have been able to fund their health and welfare spending without the help of central banks.
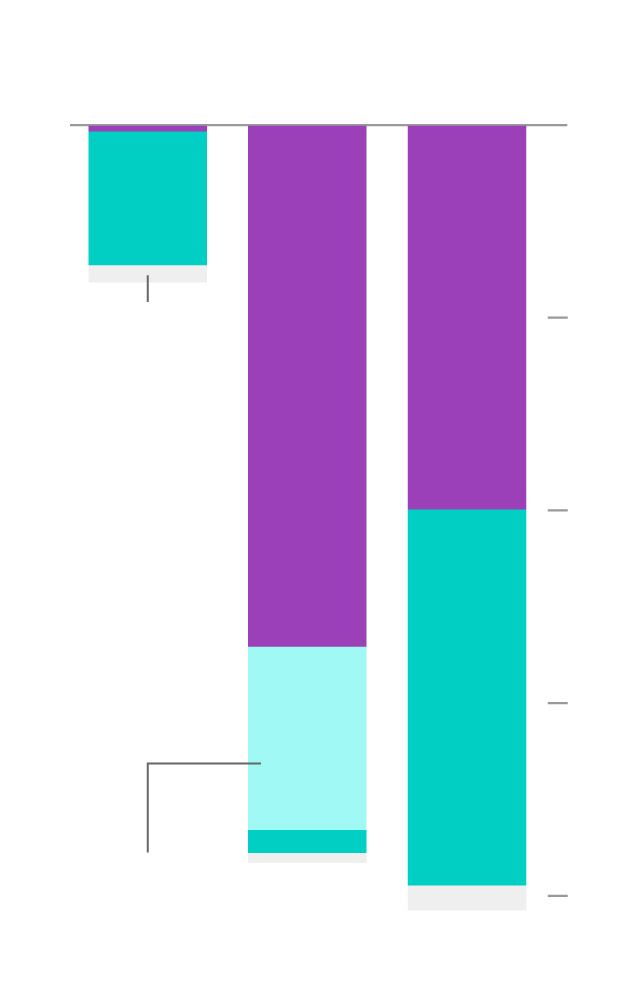
But it’s also clear that many asset classes such as technology stocks and real estate—and the people who own them—have fared better than the average worker over the past year or so. The Fed has the best data illustrating how the rich got richer and the poor slipped even further behind.
Total net worth
growth in 2020
0
20
40
60
80
100%
More than 60% of the wealth growth in 2020 went to the top 10% of the richest U.S. households...
... while only 4% went
to the bottom 50%
Next 9%
Next 40%
Bottom 50%
Top 1% of U.S. households

Total net worth
growth in 2020
0
20
40
60
80
100%
More than 60% of the wealth growth in 2020 went to the top 10% of the richest U.S. households...
... while only 4% went
to the bottom 50%
Next 9%
Next 40%
Bottom 50%
Top 1% of U.S. households
Total net worth
growth in 2020
Top 1% of U.S.
households
0
Next 9%
Next 40%
20
More than 60% of the wealth growth in 2020 went to the top 10% of the richest U.S. households...
40
60
Bottom 50%
80
... while only 4% went
to the bottom 50%
100%
Is there a limit to how long this binge can continue?
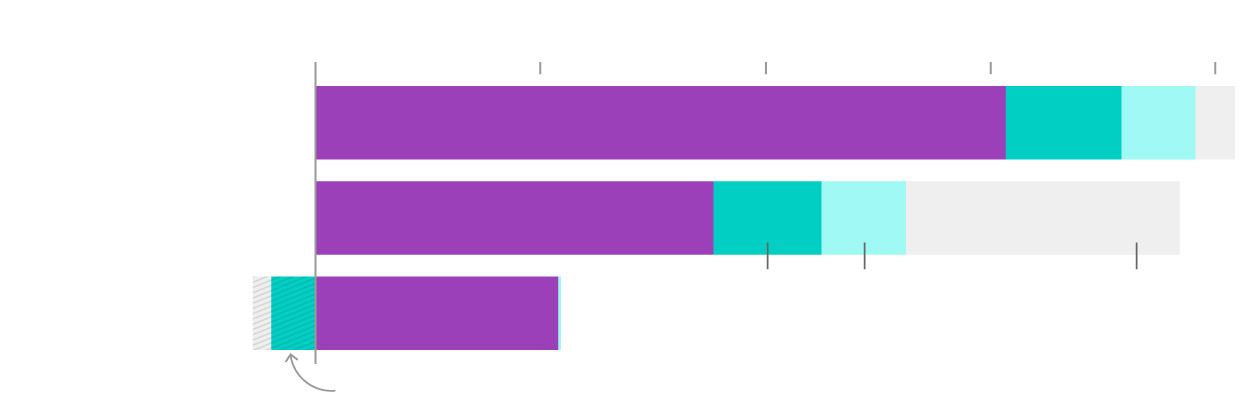
No one really knows. Some worry inflation will spike because of all the cash injected into the economy. Others are concerned about the outsized influence of central banks in free markets—the BOJ for instance owns almost half of all the outstanding Japanese government bonds.
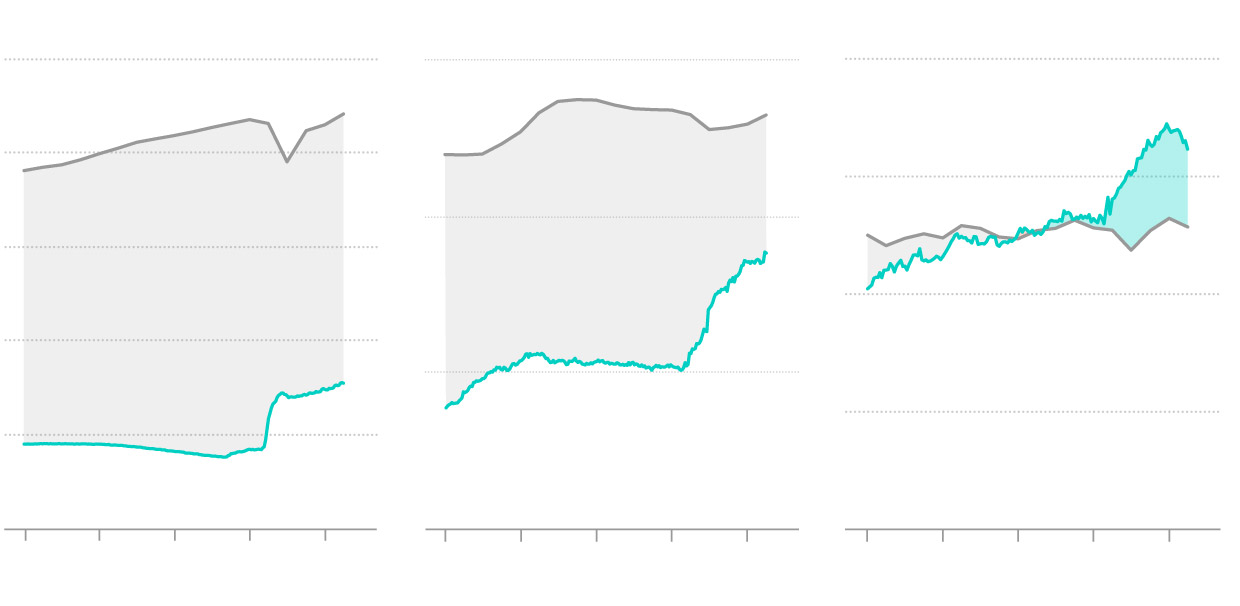
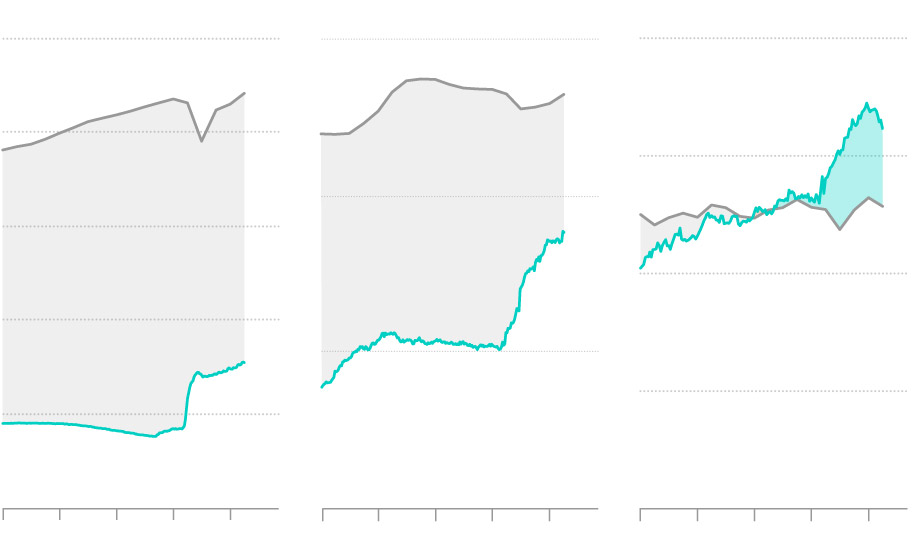
Japan has been buying bonds for decades and its balance sheet is now larger than the economy. The Fed and ECB would need to keep buying at their current clip for years to approach that level, suggesting they may not be out of policy room yet.
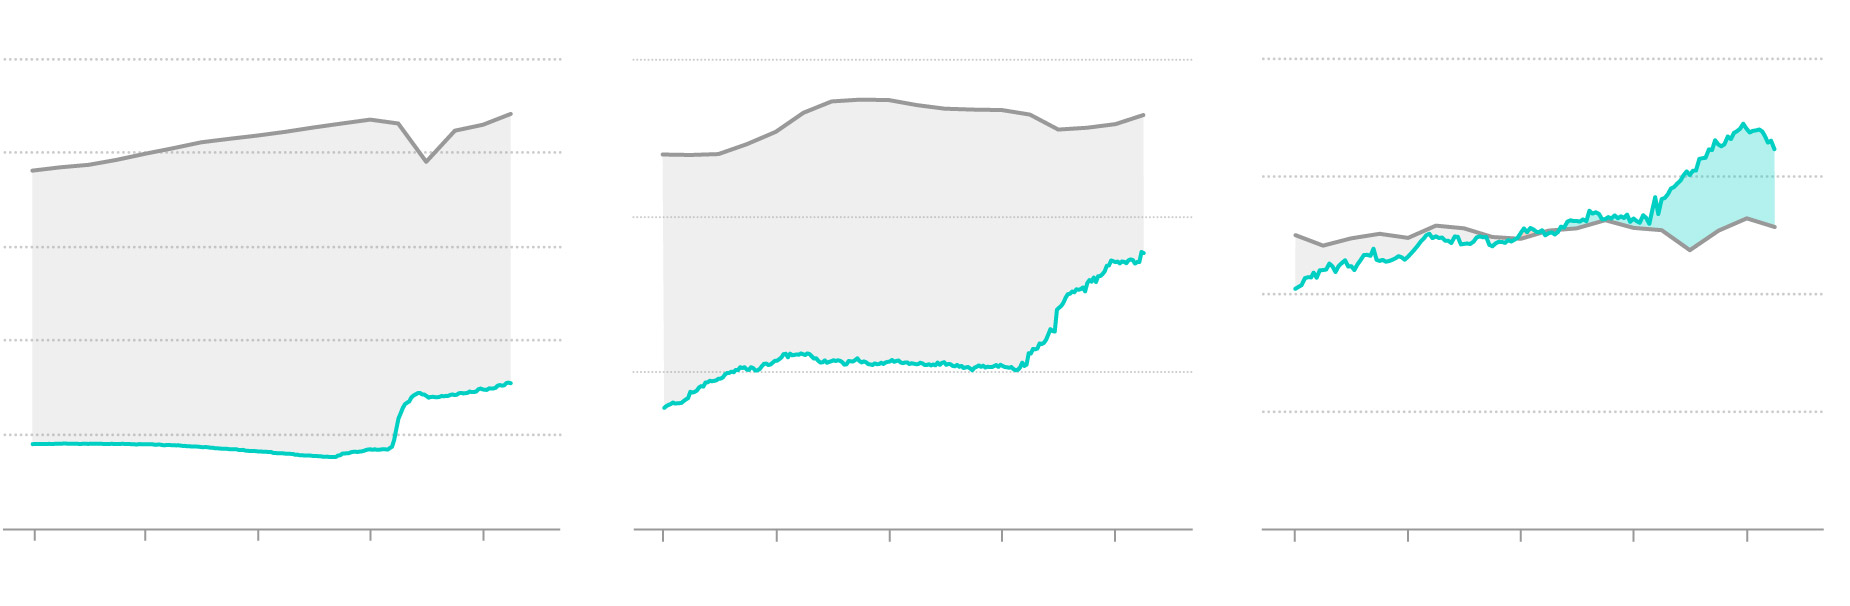
U.S.
Eurozone
Japan
$25T
$15T
$8T
GDP
20
6
10
15
4
10
5
2
5
Central bank balance sheet
0
0
0
2017
2018
2019
2017
2018
2019
2017
2018
2019
2020
2021
2020
2021
2020
2021
U.S.
Eurozone
Japan
$25T
$15T
$8T
GDP
20
6
10
15
4
10
5
2
5
Central bank
balance sheet
0
0
0
2017
2019
2017
2019
2017
2019
2021
2021
2021
U.S.
Eurozone
Japan
$25T
$15T
$8T
GDP
20
6
10
15
4
10
5
2
5
Central bank
balance sheet
0
0
0
2017
2019
2017
2019
2017
2019
2021
2021
2021
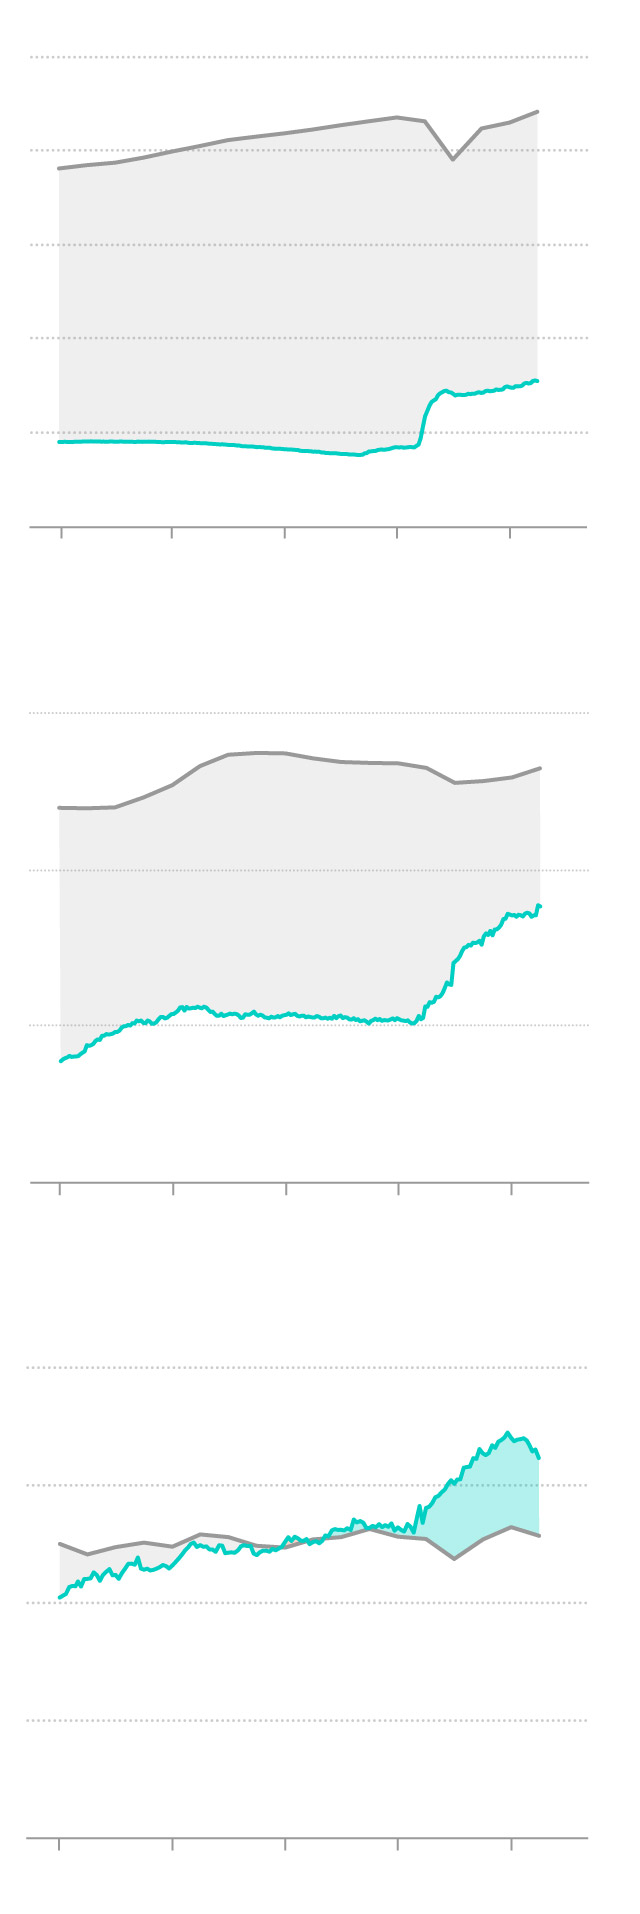
U.S.
$25T
GDP
20
15
10
5
Central bank balance sheet
0
2017
2018
2019
2020
2021
Eurozone
$15T
10
5
0
2017
2018
2019
2020
2021
Japan
$8T
6
4
2
0
2017
2018
2019
2020
2021
So what comes next?
The Fed last month said it will begin a discussion about reducing the scale of its purchases — a process known as “tapering.” Since then, a flurry of Fed officials have spoken publicly about when and how purchases may slow, perhaps in the hope that financial markets will become accustomed to the idea.
The BOJ is spending less on exchange-traded funds. But it has pledged to keep buying bonds for as long as needed to revive inflation, which remains a long way below target. The ECB has promised to keep splashing the cash too, wary of criticism it pulled back too early after the last crisis.
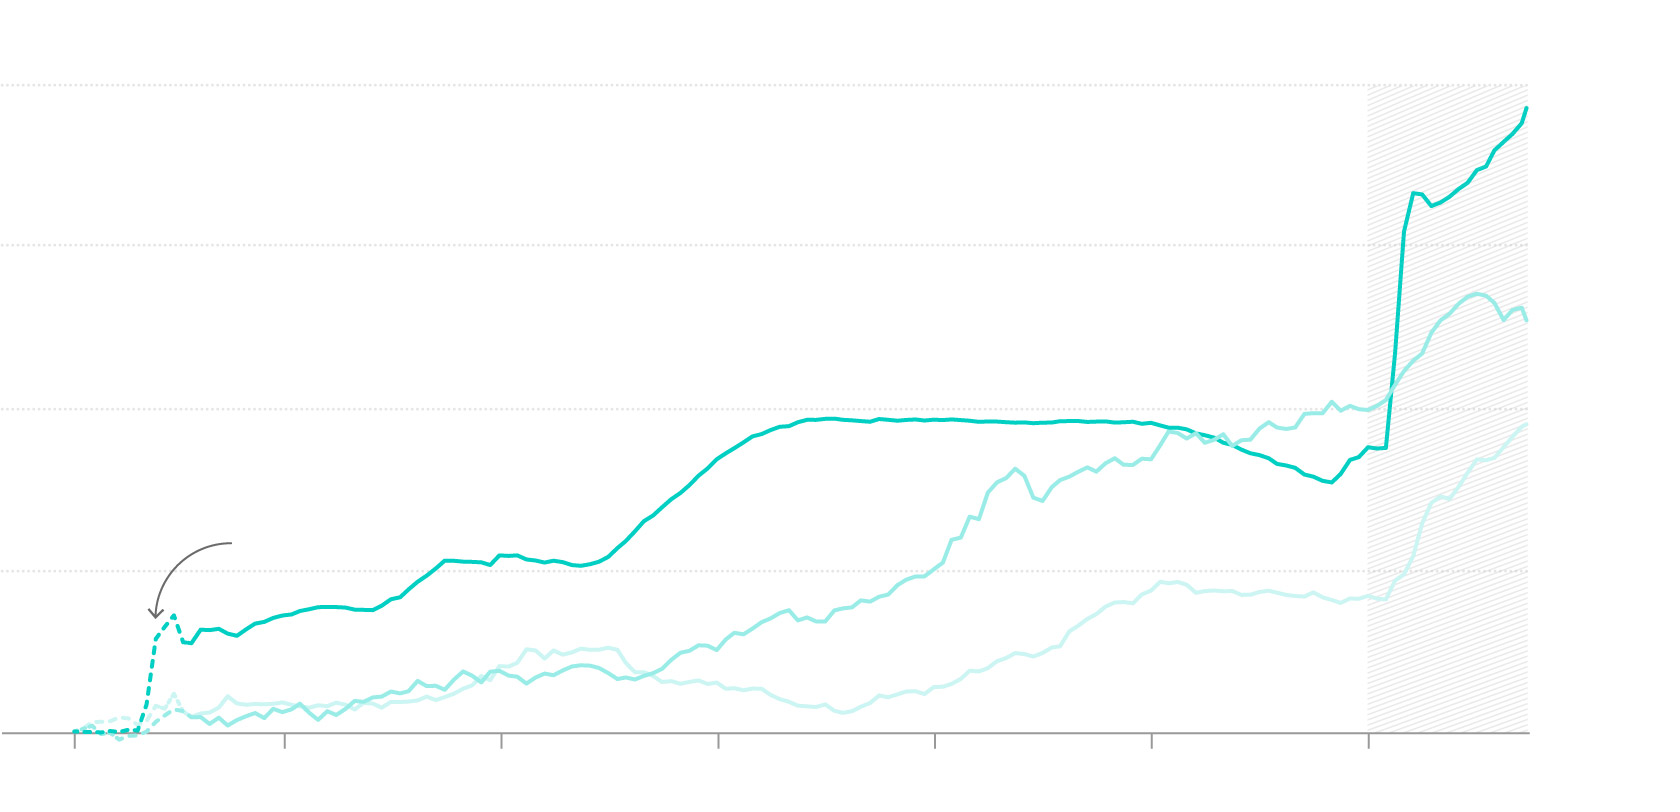
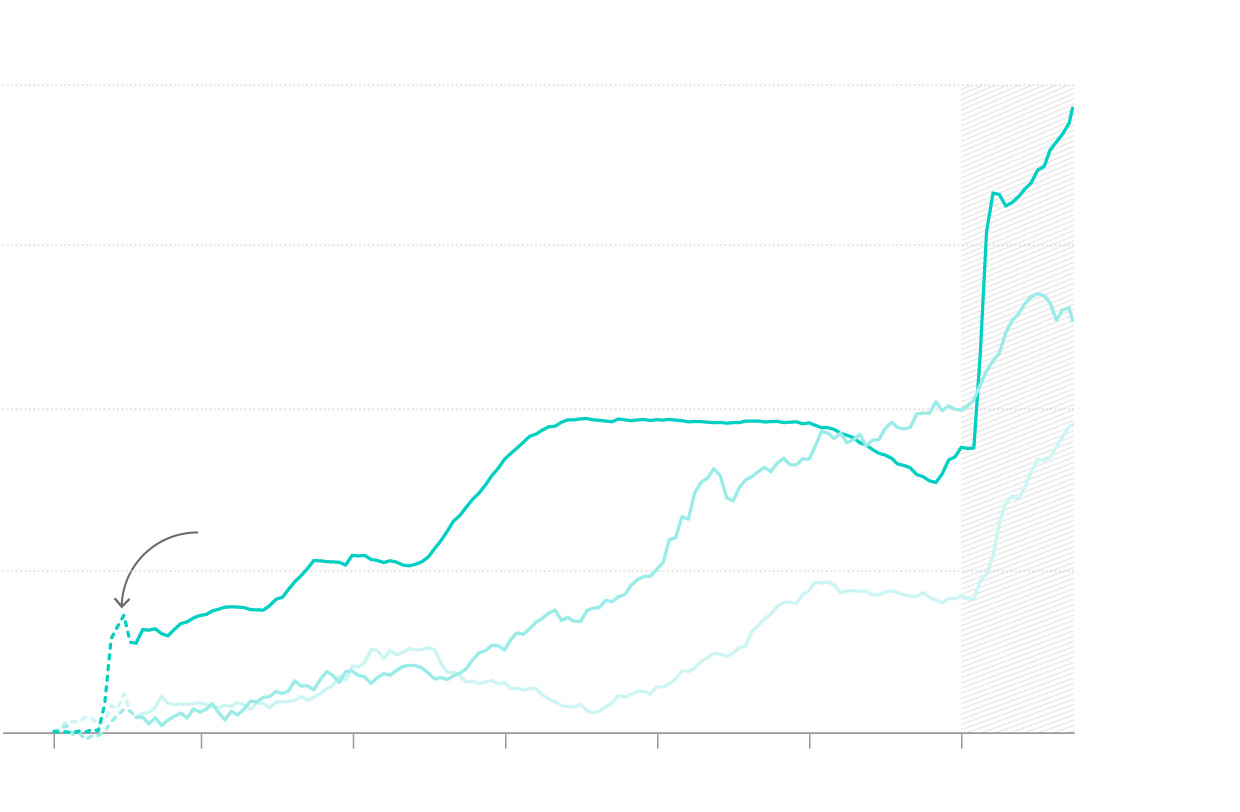
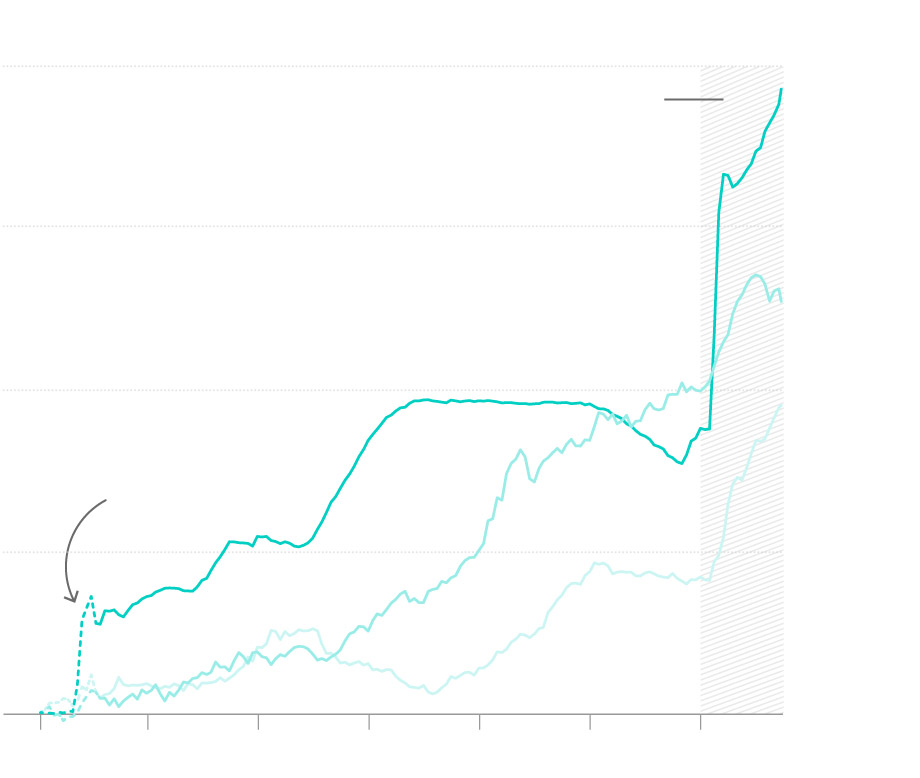
COVID-19
PANDEMIC
Balance sheet increased
800% since Jan. 2008
Federal
Reserve
600
Bank of
Japan
400
European
Central
Bank
GLOBAL
FINANCIAL
CRISIS
200
0
2008
2010
2012
2014
2016
2018
2020
COVID-19
PANDEMIC
Balance sheet increased
800% since Jan. 2008
Federal
Reserve
600
Bank of
Japan
400
European
Central
Bank
GLOBAL
FINANCIAL
CRISIS
200
0
2008
2010
2012
2014
2016
2018
2020
Balance sheet increased
800% since Jan. 2008
Federal
Reserve
COVID-19
PANDEMIC
600
Bank of
Japan
400
European
Central
Bank
GLOBAL
FINANCIAL
CRISIS
200
0
2008
2010
2012
2014
2016
2018
2020
Federal Reserve
Bank of Japan
European Central Bank
Balance sheet increased
800% since Jan. 2008
COVID-19
PANDEMIC
600
400
GLOBAL
FINANCIAL
CRISIS
200
0
2008
2010
2012
2014
2016
2018
2020
For now, the trio are still spending hundreds of billions of dollars each month to support the post-pandemic recovery. And while slowing the rate of purchases may be on the horizon, especially for the U.S., reversing course and actually selling securities remains a distant proposition. Weaning the world off such huge doses of stimulus will shape the economic and market landscape for years to come.
Notes: China’s central bank hasn’t undertaken a large-scale asset-purchase program over the past year, so we have excluded it from this story. The People’s Bank of China’s total assets are around $6 trillion. Company valuations in the lead graphic are based on their stock market capitalization as of June 23, 2021. The Fed and BOJ numbers are as of June 30, 2021, and the ECB’s as of June 25, 2021.