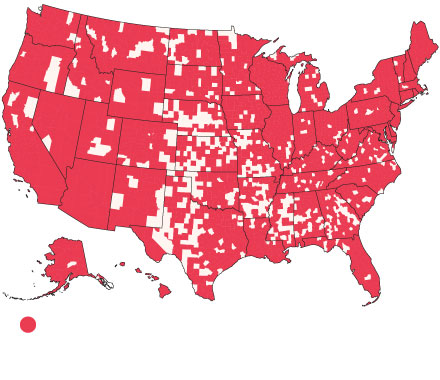
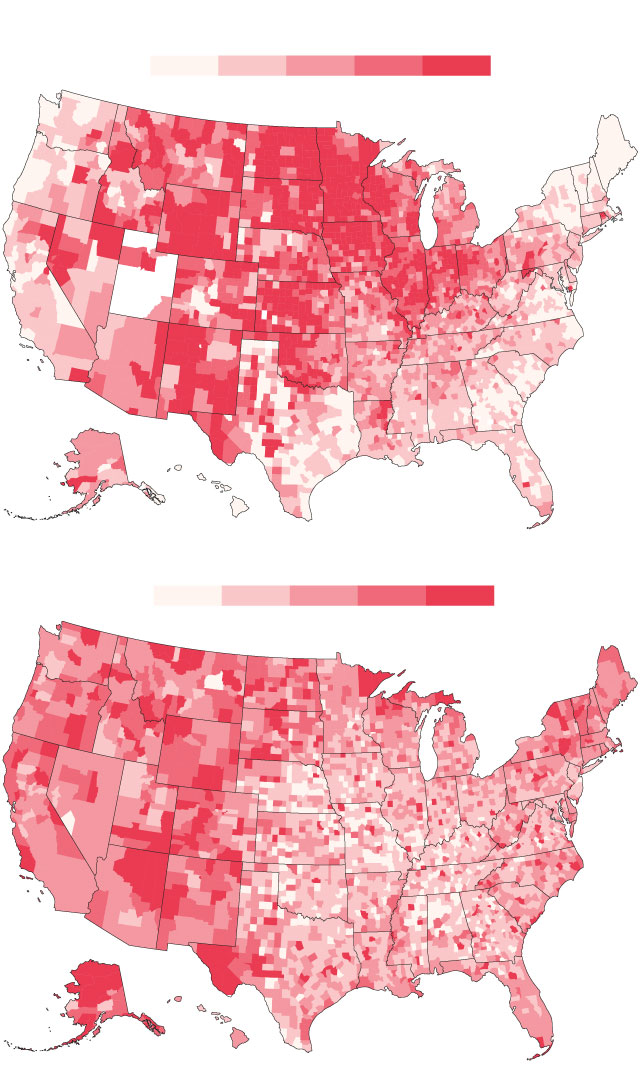
Greater share of residents away Thanksgiving 2020 than 2019
Despite Pandemic, Thanksgiving Travel Higher in 80% of Counties From 2019
With new Covid-19 cases nationally spiking to their highest totals of the pandemic, Americans from all corners of the country got out of town for Thanksgiving anyway, including in places like the northern Plains where the virus has hit hard. More than four in five counties, with a combined population of 310 million people, actually saw a greater share of residents away from home on Thanksgiving this year compared to 2019.
About 22% of people in the U.S., on average, were not at their residence on Nov. 26, according to mobile phone location data compiled by SafeGraph, while one in eight people traveled more than 30 miles from home. It’s hard to get exact figures on how many Americans were on the move—government data, for instance, shows around 7.5 million air travelers during the week of Thanksgiving—but this analysis of anonymized location data from tens of millions of smartphones provides a detailed picture of just how widespread the travel was.

New Covid-19 cases per 100K (7-day average)
day before Thanksgiving
Percentage of residents away
from home on Thanksgiving
0
25
50
75
100+
0
15%
20%
25%
30%+
New Covid-19 cases per 100K (7-day average)
day before Thanksgiving
Percentage of residents away
from home on Thanksgiving
0
25
50
75
100+
0
15%
20%
25%
30%+
New Covid-19 cases per 100K (7-day average)
day before Thanksgiving
Percentage of residents away
from home on Thanksgiving
0
25
50
75
100+
0
15%
20%
25%
30%+
New Covid-19 cases per 100K (7-day average)
day before Thanksgiving
0
25
50
75
100+
Percentage of residents away
from home on Thanksgiving
0
15%
20%
25%
30%+
New Covid-19 cases per 100K (7-day average)
day before Thanksgiving
0
25
50
75
100+
Percentage of residents away
from home on Thanksgiving
0
15%
20%
25%
30%+
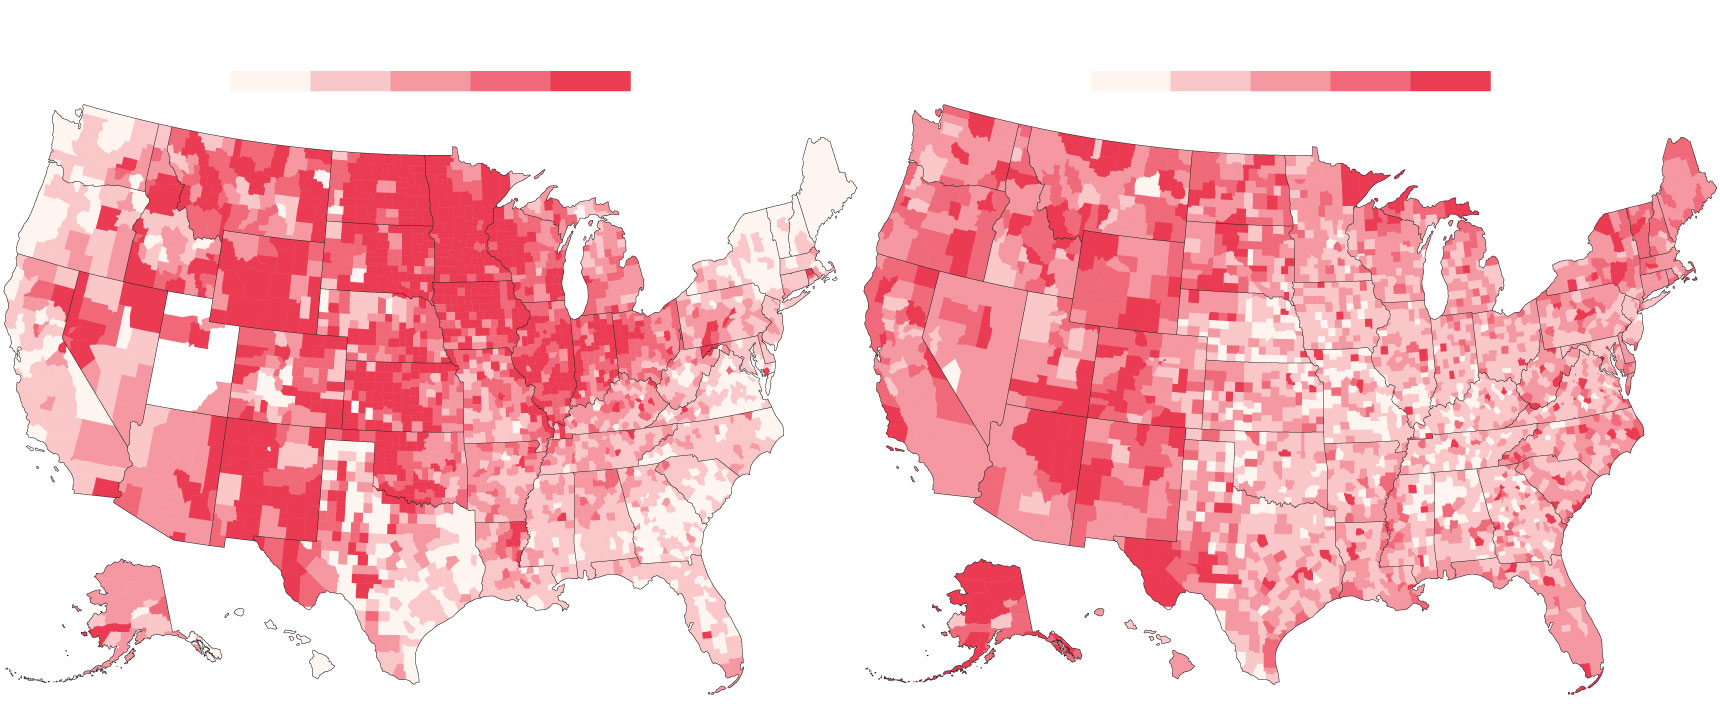
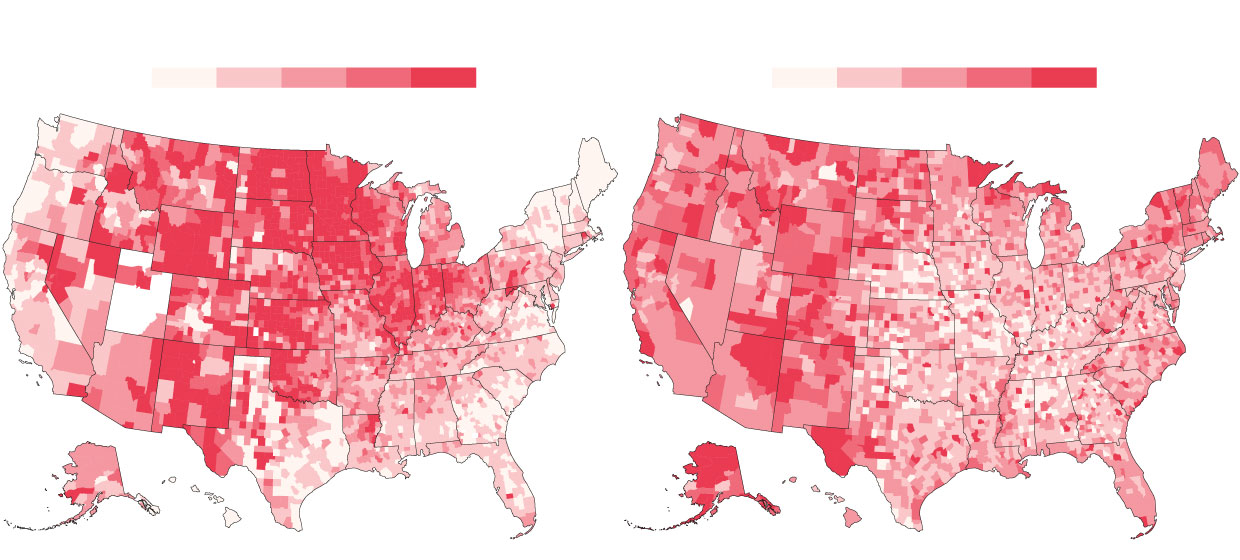
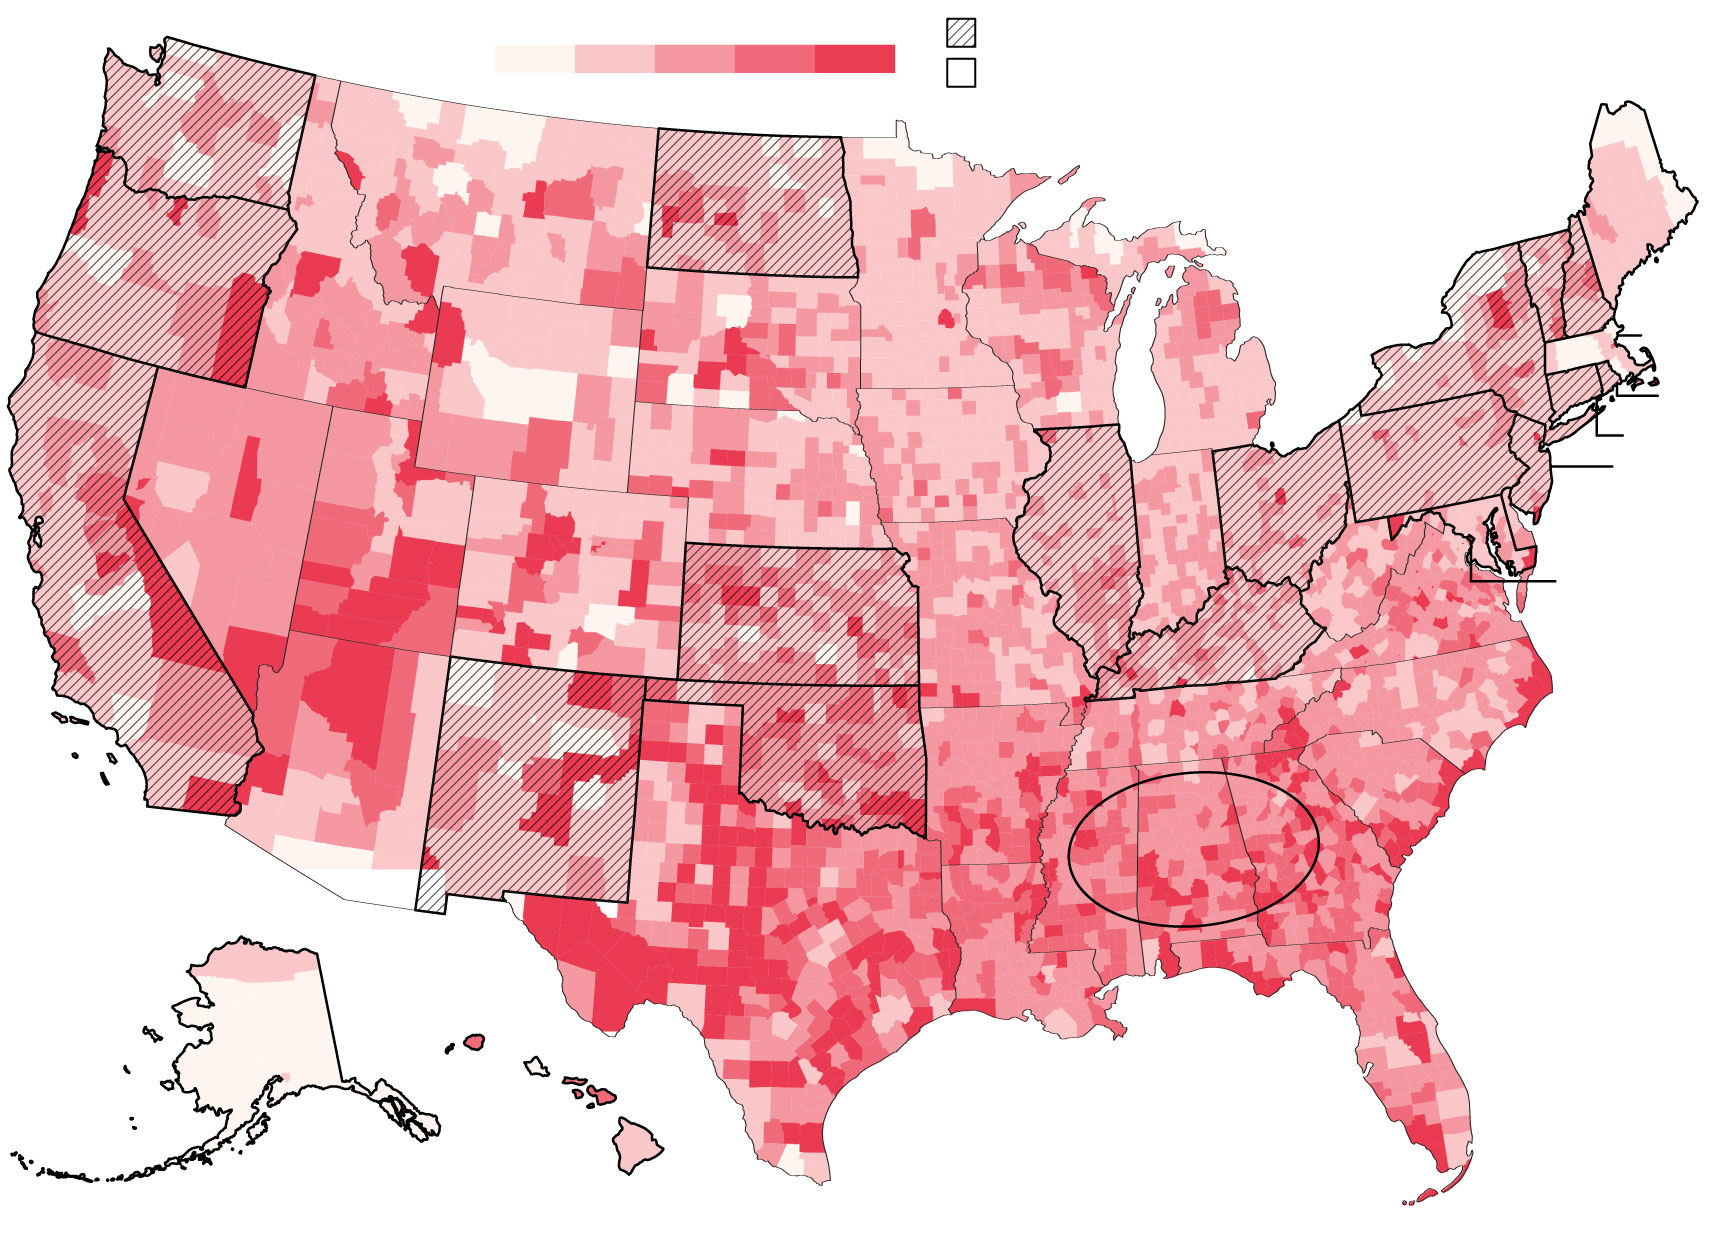
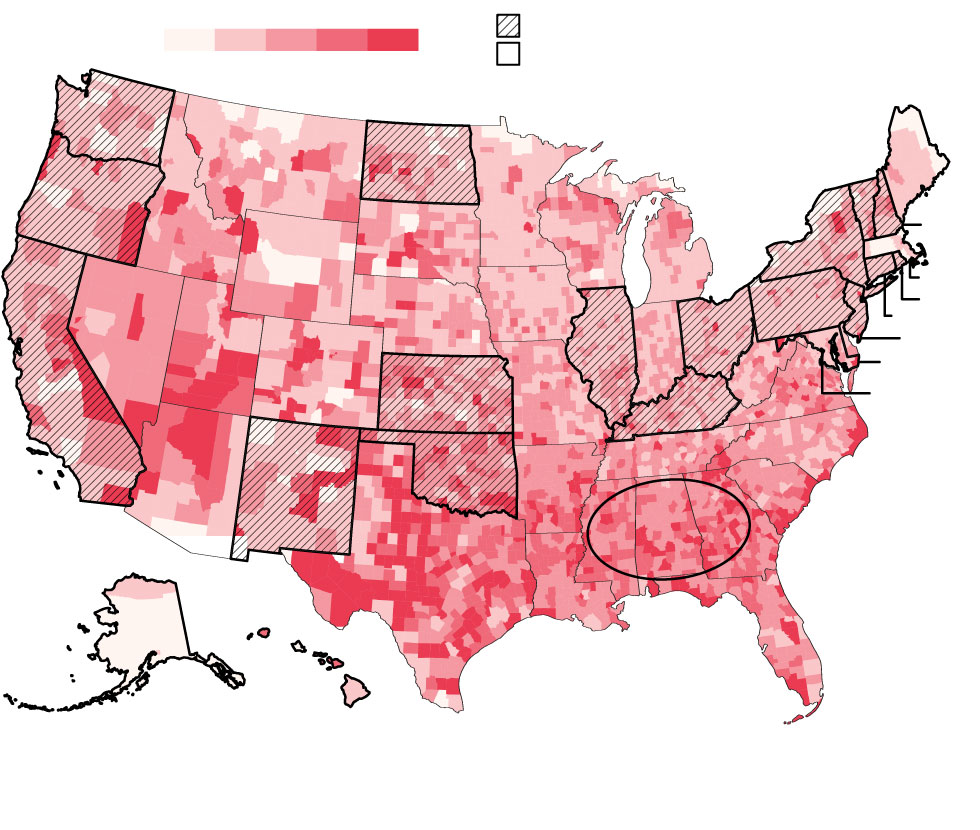
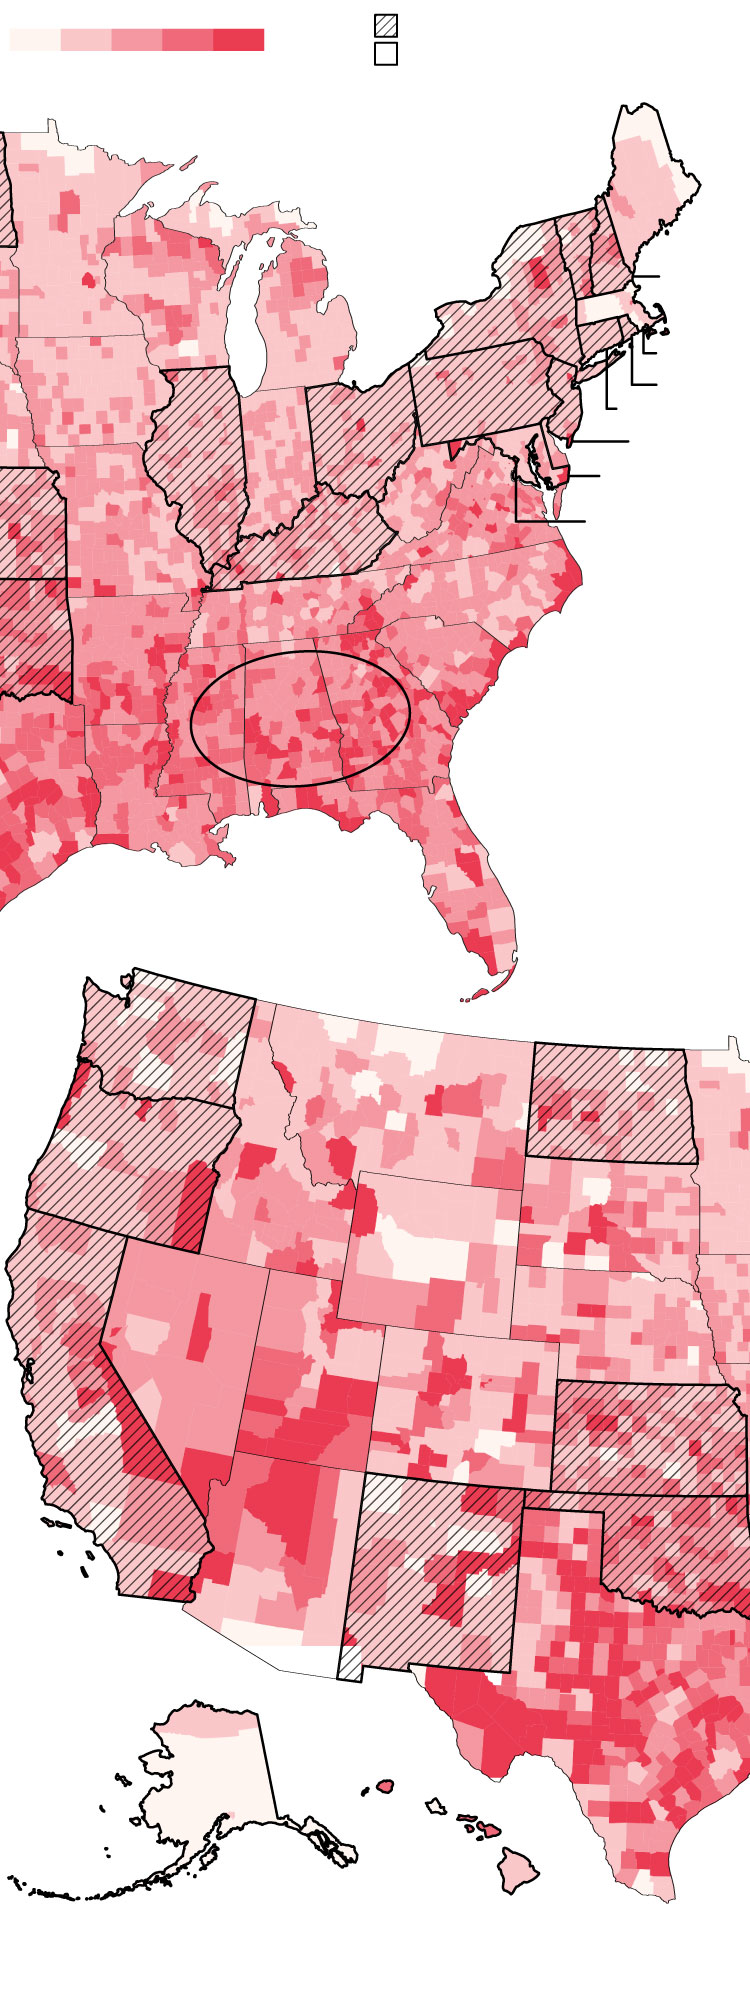
Americans who live in the West and in the densely-populated Northeast were more likely to be away from home, while many parts of the South saw a relatively larger number of non-locals show up for Thanksgiving. In a majority of counties, visitors totaled 50% or more of the local population, according to the smartphone data.
Where Americans went for Thanksgiving

Visitors as a share of residents
14-day quarantine
Quarantine only with positive test
0
25
50
75
100%
Wash.
Maine
N.D.
Vt.
Ore.
N.H.
Mass.
N.Y.
R.I.
Conn.
Pa.
N.J.
Ohio
Md.
Ill.
D.C.
Calif.
Kan.
Ky.
Okla.
N.M.
Residents of most counties in Alabama, Georgia and Mississippi were more likely to stay put, possibly playing host to the disproportionate numbers of visitors
Alaska
Hawaii
Visitors as a share of residents
14-day quarantine
Quarantine only with positive test
0
25
50
75
100%
Wash.
Maine
N.D.
Vt.
Ore.
N.H.
Mass.
N.Y.
R.I.
Conn.
Pa.
N.J.
Ohio
Md.
Ill.
D.C.
Calif.
Kan.
Ky.
Okla.
N.M.
Alaska
Residents of most counties in Alabama, Georgia and Mississippi were more likely to stay put, possibly playing host to the disproportionate numbers of visitors
Hawaii

Visitors as a share of residents
14-day quarantine
Quarantine only with positive test
0
25
50
75
100%
Wash.
Maine
N.D.
Vt.
Ore.
N.H.
Mass.
N.Y.
R.I.
Conn.
Pa.
N.J.
Ohio
Ill.
Md.
Calif.
Kan.
D.C.
Ky.
Okla.
N.M.
Alaska
Residents of most counties in Alabama, Georgia and Mississippi were more likely to stay put, possibly playing host to the disproportionate numbers of visitors
Hawaii
Visitors as a share of residents
14-day quarantine
Quarantine only with positive test
0
25
50
75
100%
Wash.
Maine
N.D.
Vt.
Ore.
N.H.
N.Y.
Mass.
R.I.
Pa.
Conn.
Ohio
Ill.
N.J.
Md.
Calif.
Kan.
D.C.
Ky.
Okla.
N.M.
Alaska
Residents of most counties in Alabama, Georgia and Mississippi were more likely to stay put, possibly playing host to the disproportionate numbers of visitors
Hawaii
Visitors as a share of residents
14-day quarantine
Quarantine only
with positive test
0
25
50
75
100%
Maine
Vt.
N.H.
N.Y.
Mass.
R.I.
Pa.
Conn.
Ohio
Ill.
N.J.
Md.
D.C.
Ky.
Okla.
Residents of most counties in Alabama, Georgia and Mississippi were more likely to stay put, possibly playing host to the disproportionate numbers of visitors
Wash.
N.D.
Ore.
Calif.
Kan.
Okla.
N.M.
Alaska
Hawaii
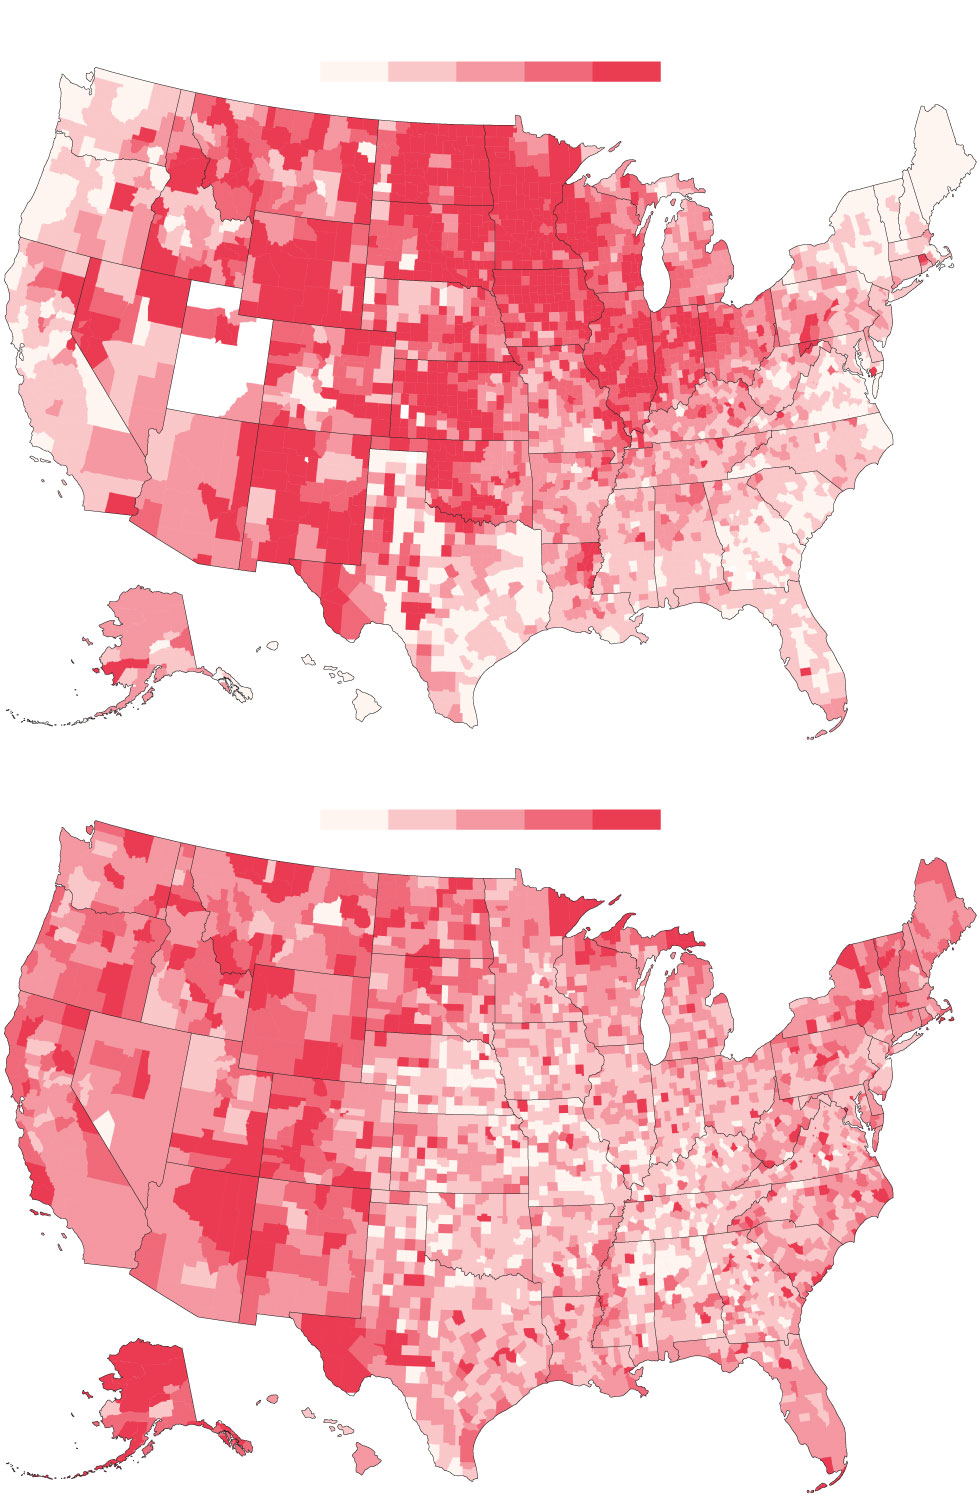
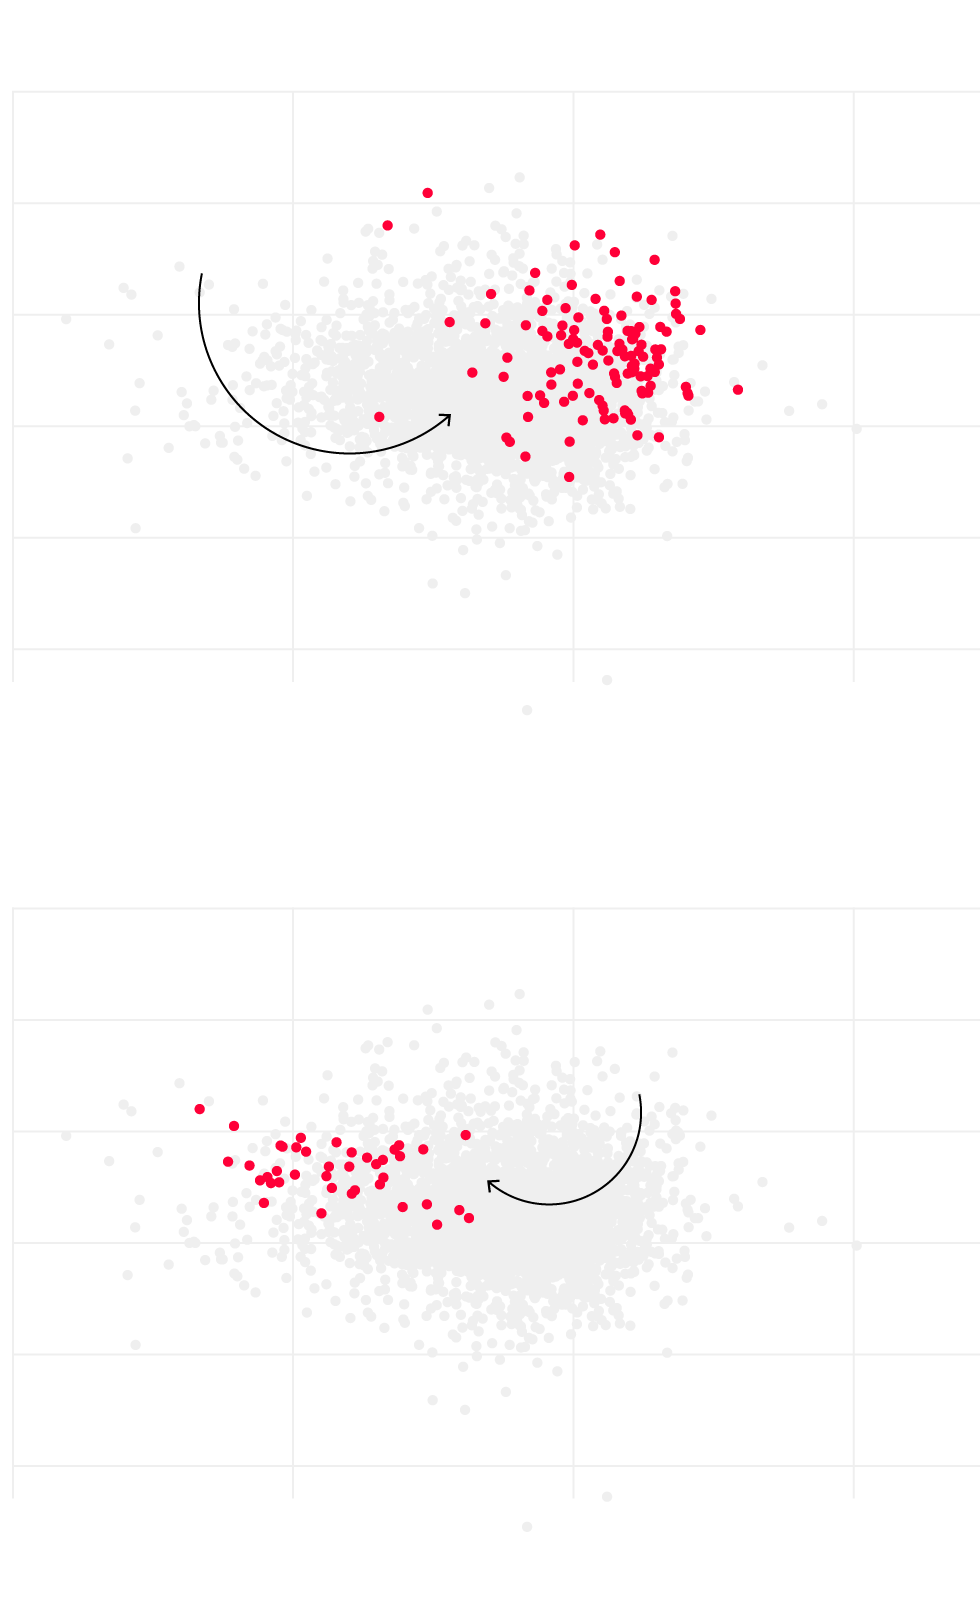
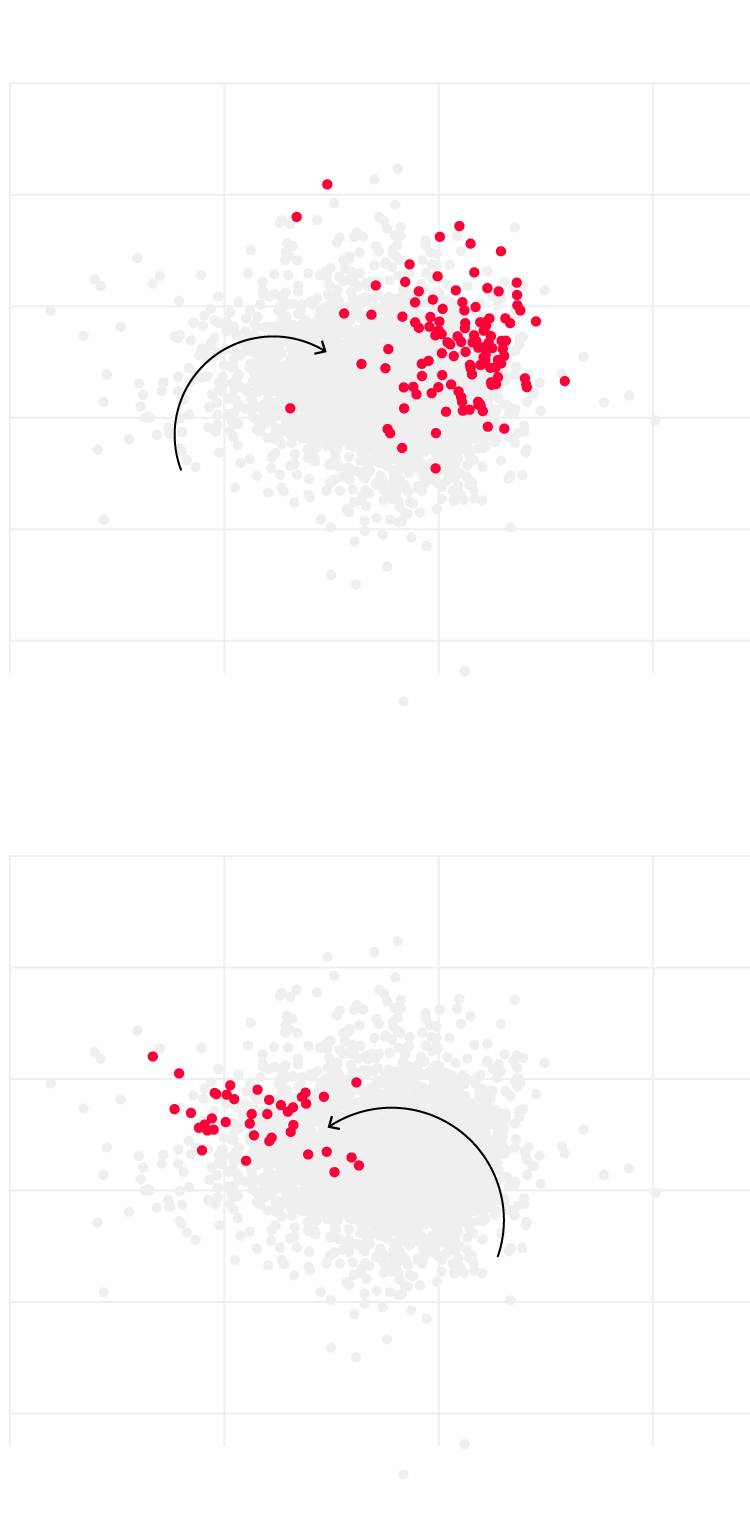
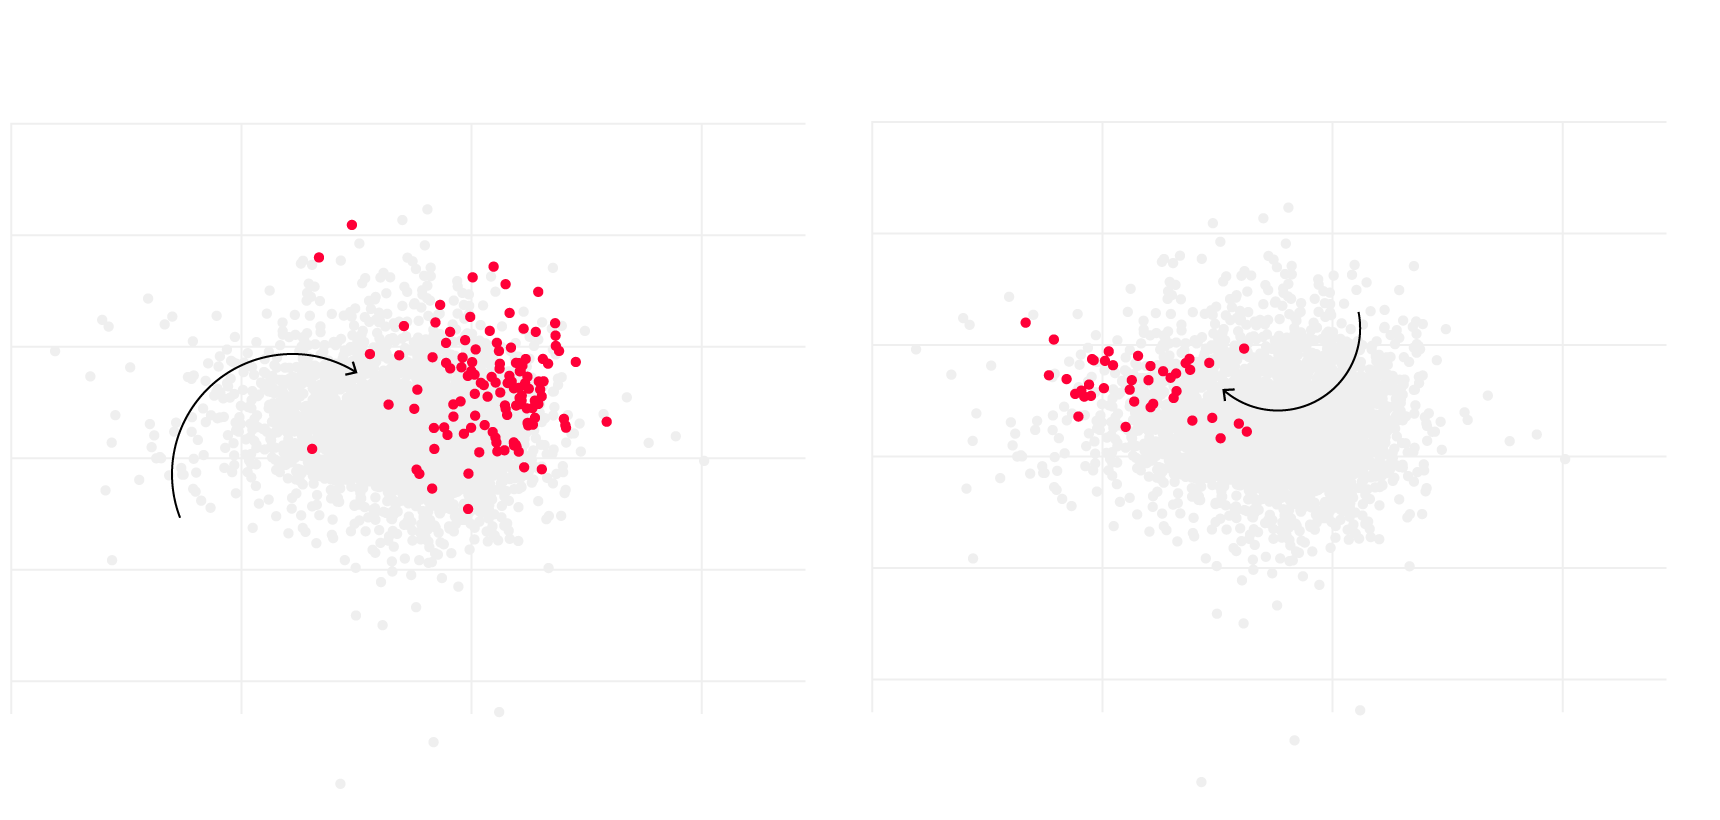
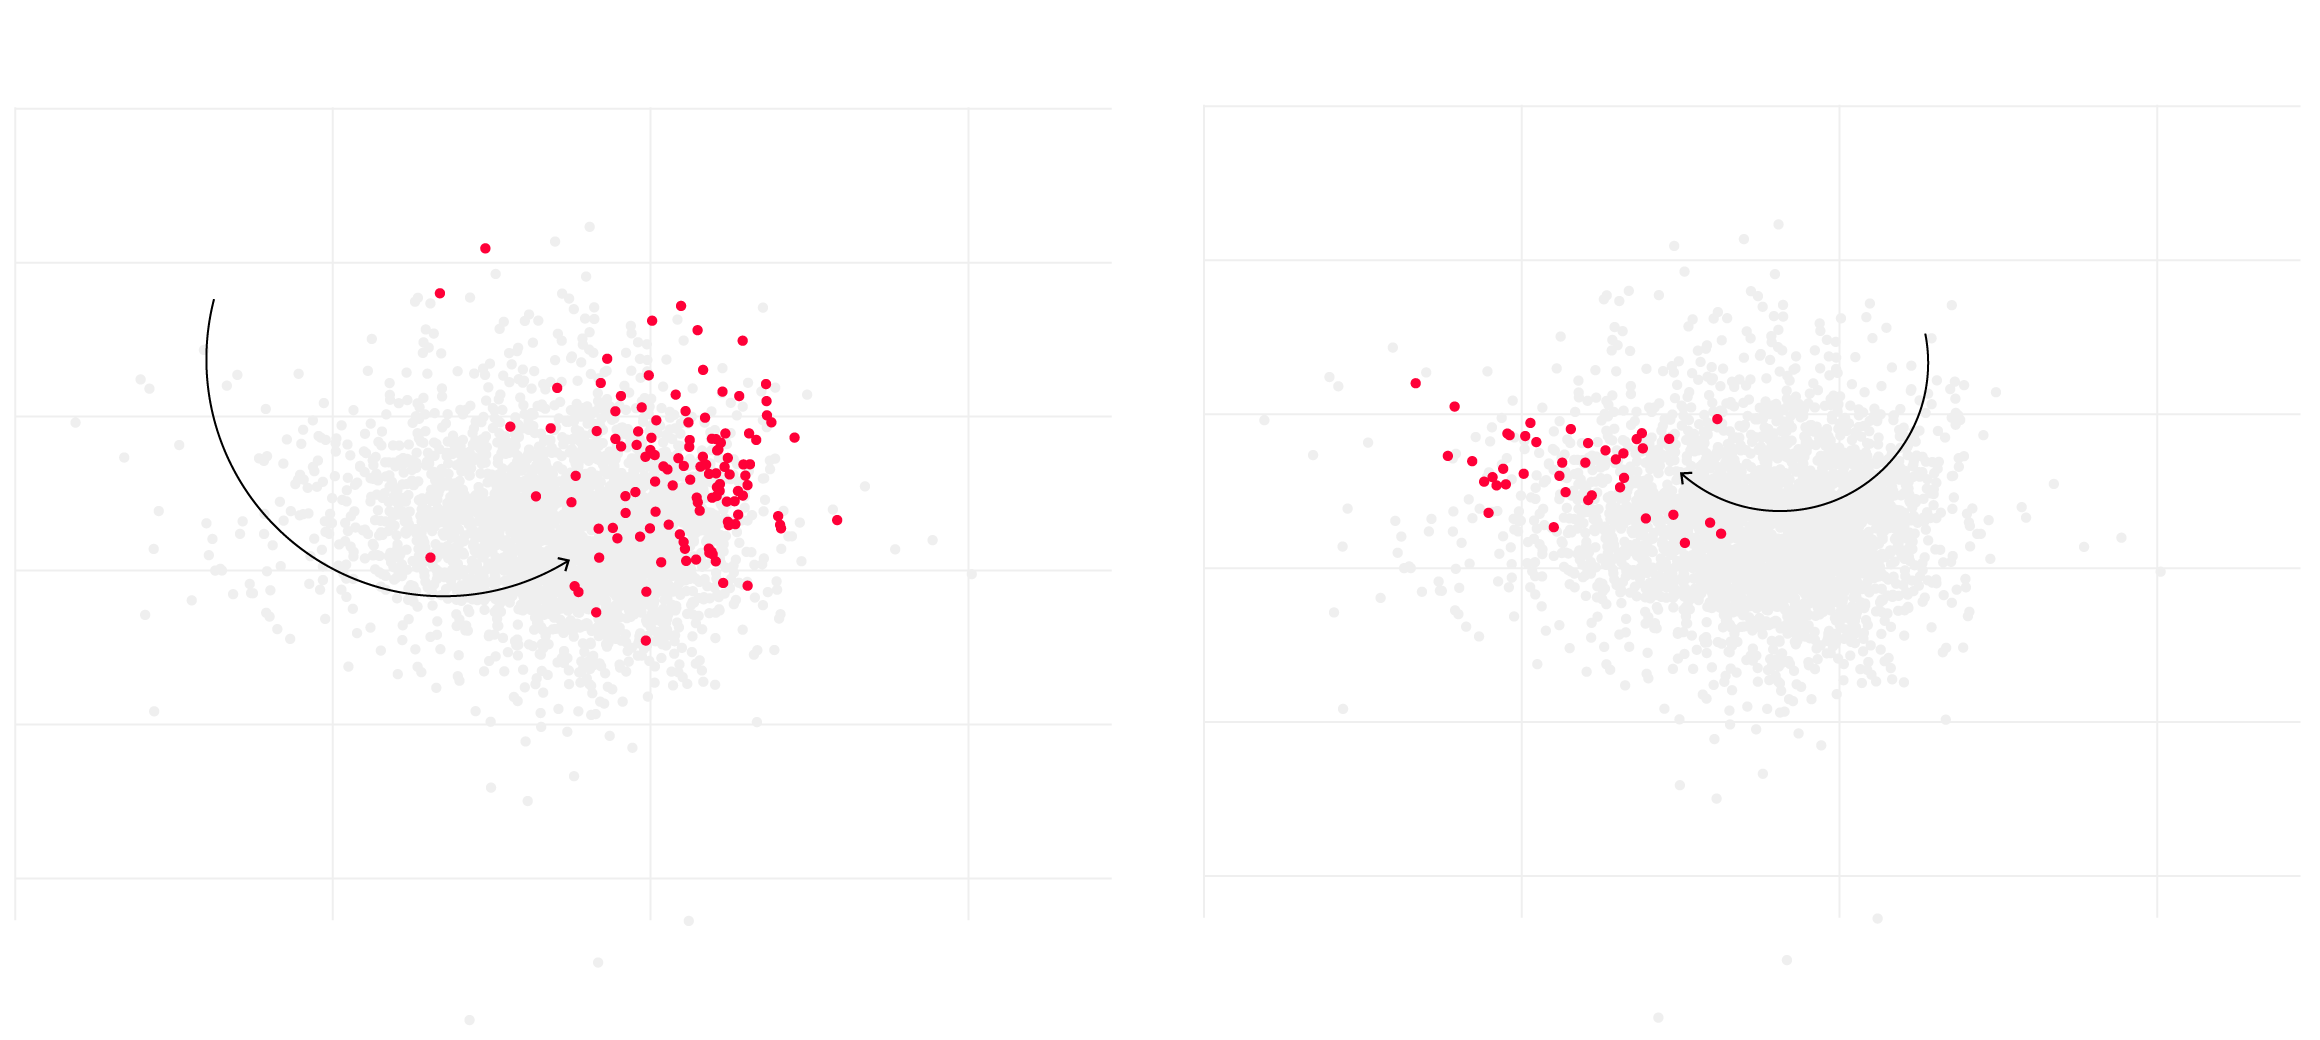
Several states with major Covid-19 hotspots also saw some of the most travel. In Montana, North Dakota, South Dakota and Wyoming, the share of people travelling was above the national average in 80% of counties with more than 100 new cases per 100,000 residents going into Thanksgiving.

North & South Dakota
Maine, New Hampshire & Vermont
Percentage of residents
away from home on Thanksgiving:
Percentage of residents
away from home on Thanksgiving:
50%
50%
New England has controlled outbreaks better than many other parts of the country, but an uptick in travel could break that pattern
40%
40%
30%
30%
20%
20%
10%
10%
Counties in the Dakotas had among the highest Covid-19 cases per capita but also lots of people away from home
5%
5%
0
10
100
1000
0
10
100
1000
New COVID-19 cases per 100K
7-day average
New COVID-19 cases per 100K
7-day average
North & South Dakota
Percentage of residents away from home on Thanksgiving:
50%
Counties in the Dakotas had among the highest Covid-19 cases per capita but also lots of people away from home
40%
30%
20%
10%
5%
0
10
100
1000
New COVID-19 cases per 100K
7-day average
Maine, New Hampshire & Vermont
Percentage of residents away from home on Thanksgiving:
50%
New England has controlled outbreaks better than many other parts of the country, but an uptick in travel could break that pattern
40%
30%
20%
10%
5%
0
10
100
1000
New COVID-19 cases per 100K
7-day average
North & South Dakota
Percentage of residents away from home on Thanksgiving:
50%
40%
30%
20%
Counties in the Dakotas had among the highest Covid-19 cases per capita but also lots of people away from home
10%
5%
0
10
100
1000
New COVID-19 cases per 100K
7-day average
Maine, New Hampshire & Vermont
Percentage of residents away from home on Thanksgiving:
50%
40%
30%
20%
New England has controlled outbreaks better than many other parts of the country, but an uptick in travel could break that pattern
10%
5%
0
10
100
1000
New COVID-19 cases per 100K
7-day average
North & South Dakota
Maine, New Hampshire & Vermont
Percentage of residents
away from home on Thanksgiving:
Percentage of residents
away from home on Thanksgiving:
50%
50%
New England has controlled outbreaks better than many other parts of the country, but an uptick in travel could break that pattern
40%
40%
30%
30%
20%
20%
Counties in the Dakotas had among the highest Covid-19 cases per capita but also lots of people away from home
10%
10%
5%
5%
0
10
100
1000
0
10
100
1000
New COVID-19 cases per 100K
7-day average
New COVID-19 cases per 100K
7-day average
North & South Dakota
Maine, New Hampshire & Vermont
Percentage of residents away from home on Thanksgiving:
Percentage of residents away from home on Thanksgiving:
50%
50%
New England has controlled outbreaks better than many other parts of the country, but an uptick in travel could break that pattern
Counties in the Dakotas had among the highest Covid-19 cases per capita but also lots of people away from home
40%
40%
30%
30%
20%
20%
10%
10%
5%
5%
0
10
100
1000
0
10
100
1000
New COVID-19 cases per 100K
7-day average
New COVID-19 cases per 100K
7-day average
Location data doesn’t address where people stayed, who they interacted with or whether they wore masks. These maps and charts also don’t account for those who spent the holidays indoors with people from the same county outside their immediate household. Surveys showed that across much of the U.S., many were planning to share a meal outside their immediate household, considered a high-risk activity.
While most likely chose to drive, nearly two million Americans traveled by plane, according to data from the Transportation Security Administration—marking the highest point since the pandemic hit the U.S., though still down about 60% from last year. While airlines have said their enhanced cleaning and air filtration systems make it a safe option, flying puts people in extremely close proximity to each other, where virus-laden particles can pass to other passengers before getting recirculated through filters. Travelers also spend hours enclosed in airports with thousands of others before and after their flights.
Travelers passing through TSA checkpoints

2.9 million
1.2 million travelers were recorded on Nov. 29, 2020. The most since the beginning of the pandemic
2019 Travelers
2020 Travelers
March 1
July 1
November 30

2.9 million
1.2 million travelers were recorded on Nov. 29, 2020. The most since the beginning of the pandemic
2019 Travelers
2020 Travelers
March 1
July 1
November 30

2.9 million
1.2 million travelers were recorded on Nov. 29, 2020. The most since the beginning of the pandemic
2019 Travelers
2020 Travelers
March 1
July 1
November 30

March 1
2020
Travelers
2019
Travelers
July 1
November 30
1.2 million travelers were recorded on Nov. 29, 2020. The most since the beginning of the pandemic
2.9 million

2020
Travelers
March 1
2019
Travelers
July 1
November 30
2.9 million
1.2 million travelers were recorded on Nov. 29, 2020. The most since the beginning of the pandemic
It’s clear that millions of Americans ignored guidelines from the Centers for Disease Control and Prevention to celebrate the holidays with “the people you live with,” at a time when the pandemic was at its most dire. (The guidance came late enough that many had likely already made plans by then.) The past week alone has seen the most new daily U.S. cases, hospitalizations and deaths from Covid-19 so far. But the worst may yet be ahead, considering experts’ warnings about how small gatherings are likely contributing to the current wave.