Trump’s New Latino Voters Are Sending Democrats a Message
A precinct-by-precinct examination of three key counties reveals the magnitude of the shift in the Latino vote
From the Tejanos of Southeast Texas to the Venezuelan-American enclave west of Miami and the Dominican-Americans a few miles to the east, Latinos turned out in big numbers for President Donald Trump on Nov. 3.
Of all the election-night surprises, this may have been the greatest. Even in Maricopa, the key county that Joe Biden captured en route to flipping Arizona into the Democrats’ column for the first time in two decades, the Latino vote inched ever so slightly toward Trump.
Collectively, these voters sent a clear message to Democrats that night: The long-held assumption that the growing Hispanic population would inexorably turn large swaths of the Sun Belt into solidly-blue strongholds—and hand the party control of the electoral map in the process—is badly misguided. Yes, a majority of Latinos still voted for Biden and, yes, his victory in Arizona helped pave his way to the presidency, but he was trounced in Florida and Texas by margins that almost no pollster predicted. And the shifting Latino vote in those states was a big reason why.
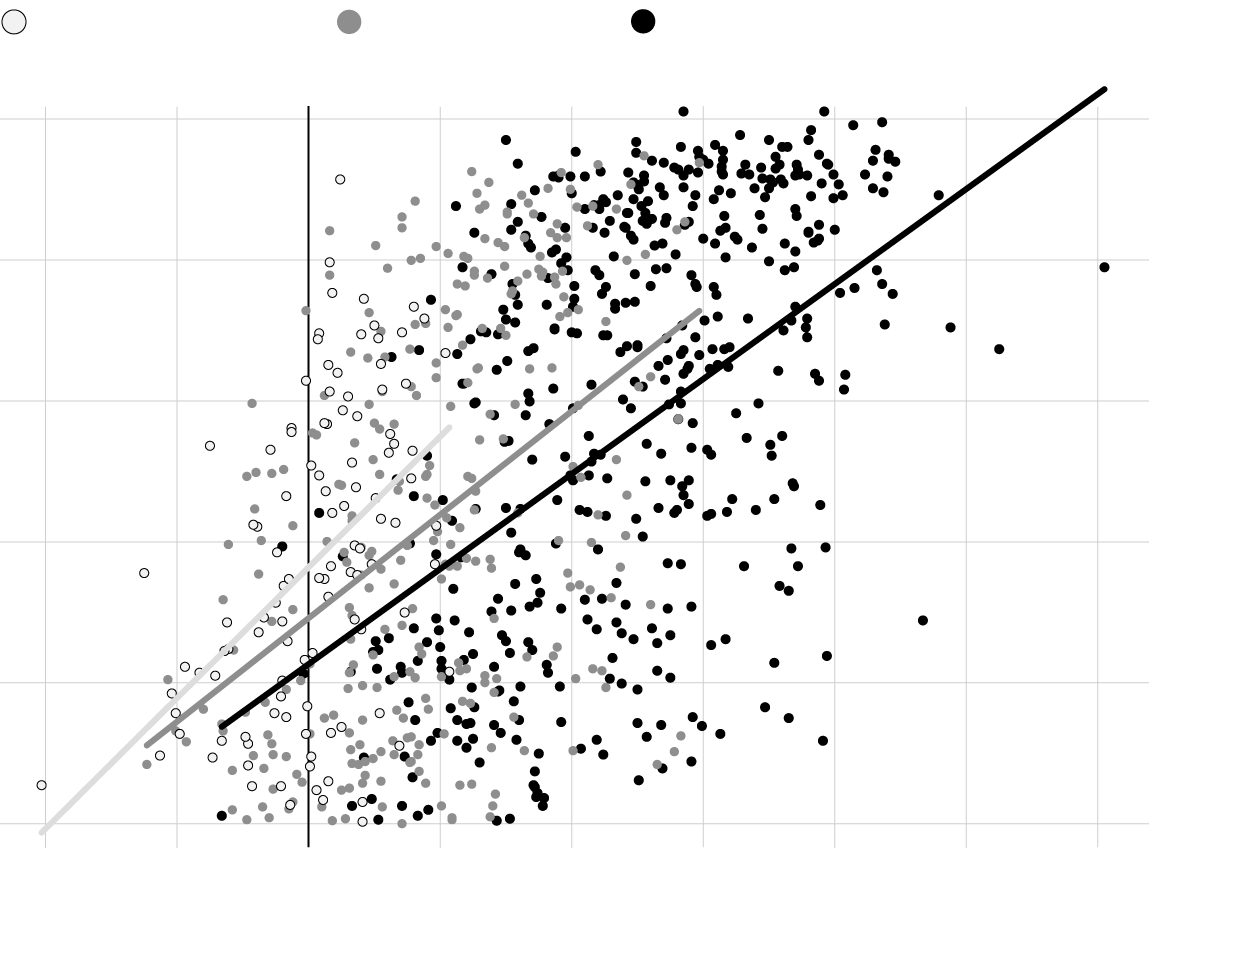
The Pro-Trump Latino Trend
Miami-Dade County, FL
Maricopa County, AZ
Harris County, TX
Hispanic share
of population
◀ More DEM.
More REP.▶
100%
90
80
70
60
50
+20
10
0
10
20
30
40
50
+60pp
Net percentage-point change
in two-party vote from 2016
Miami-Dade County, FL
Maricopa County, AZ
Harris County, TX
Hispanic share
of population
◀ More Dem.
More rep.▶
100%
90
80
70
60
50
+20
10
0
10
20
30
40
50
+60pp
Net percentage-point change
in two-party vote from 2016
Maricopa County, AZ
Harris County, TX
Miami-Dade County, FL
Hispanic share
of population
◀ More Dem.
More Rep. ▶
100%
90
80
70
60
50
+20
0
20
40
+60pp
Net percentage-point change
in two-party vote from 2016
Broad-stroke identity politics only go so far. That’s because the Latinos of the United States have no single identity, no shared world view. From state to state and town to town—even house to house—their politics are molded by vastly different experiences back in Latin America and here in the U.S.
Law and order, for instance, matters critically to some; containing the pandemic to others; and ending the lockdowns to others still. The facile premise of the monolithic Latino voting bloc is, once and for all, being put to rest.
“You’ve got conservatives, you’ve got liberals, you’ve got independents,” says Domingo Garcia, president of the League of United Latin American Citizens, a civil rights group founded in 1929. “It’s based more on geography.”
Bloomberg News did a precinct-by-precinct examination of three key spots on the map—the counties of Miami-Dade, Maricopa and Harris—to better understand the shifting trends among Latino voters. The whys behind the swings are impossible to know with any real precision, of course, but local experts identified several prime factors in each county for us.
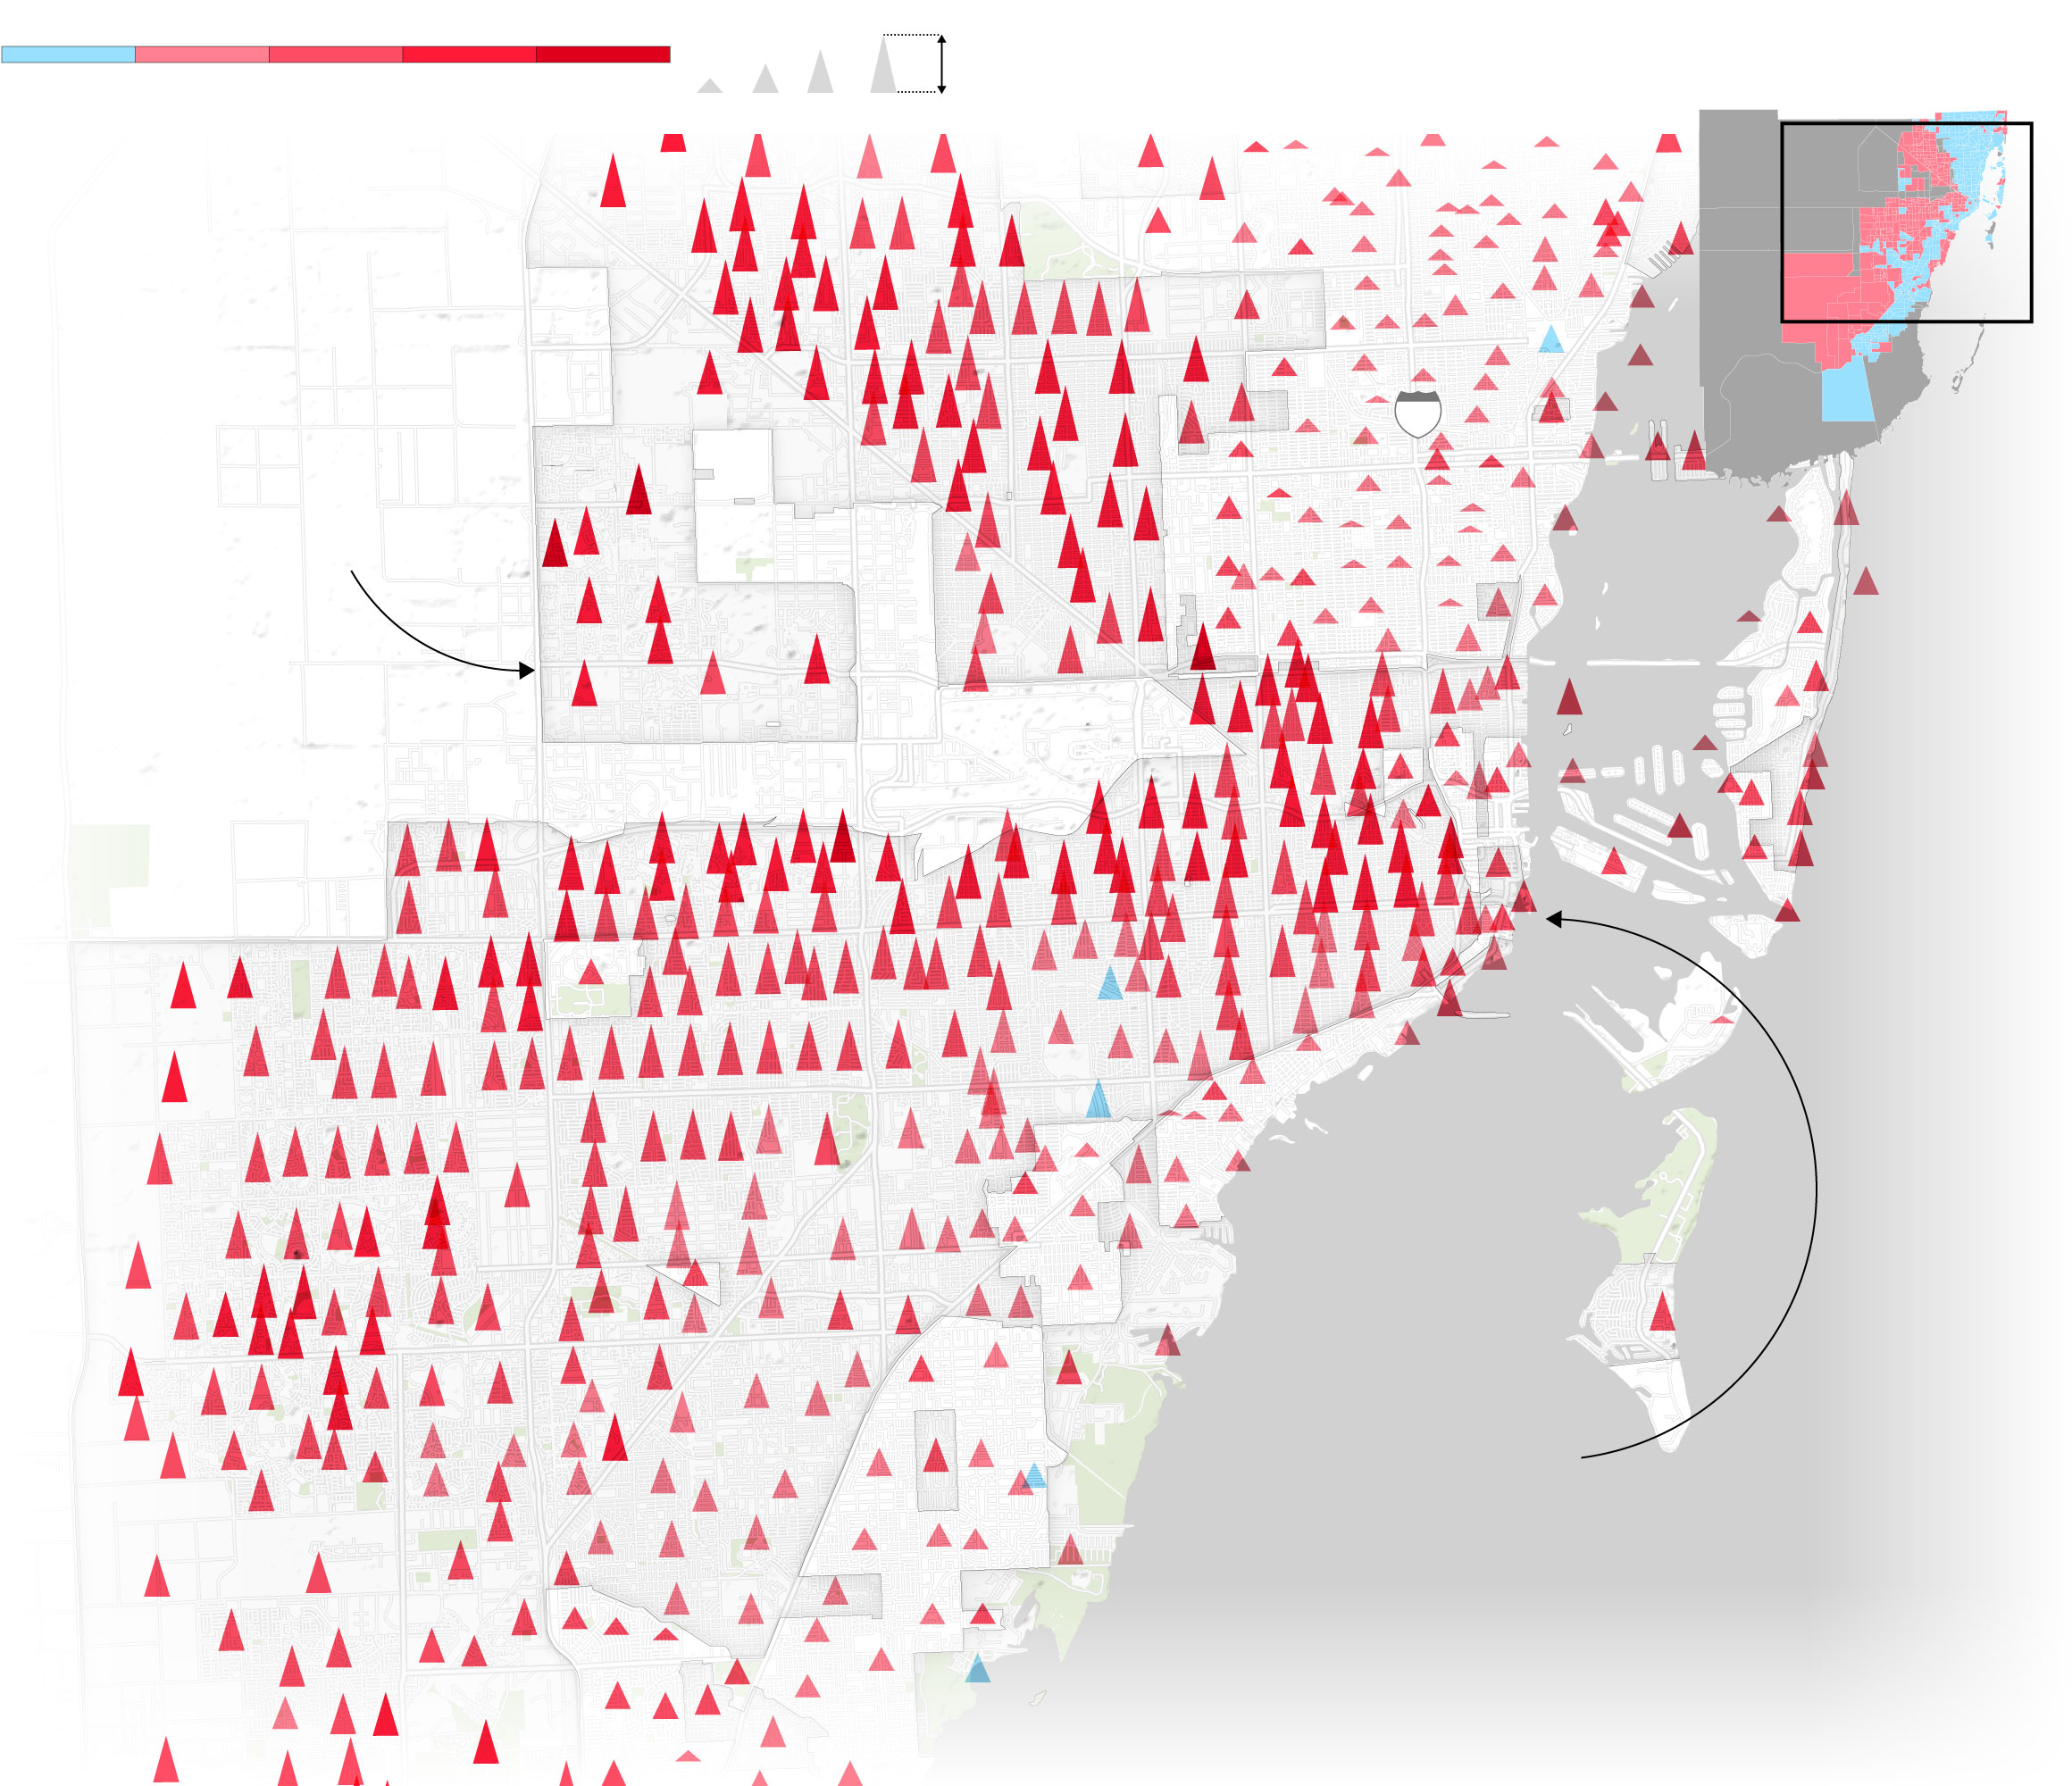
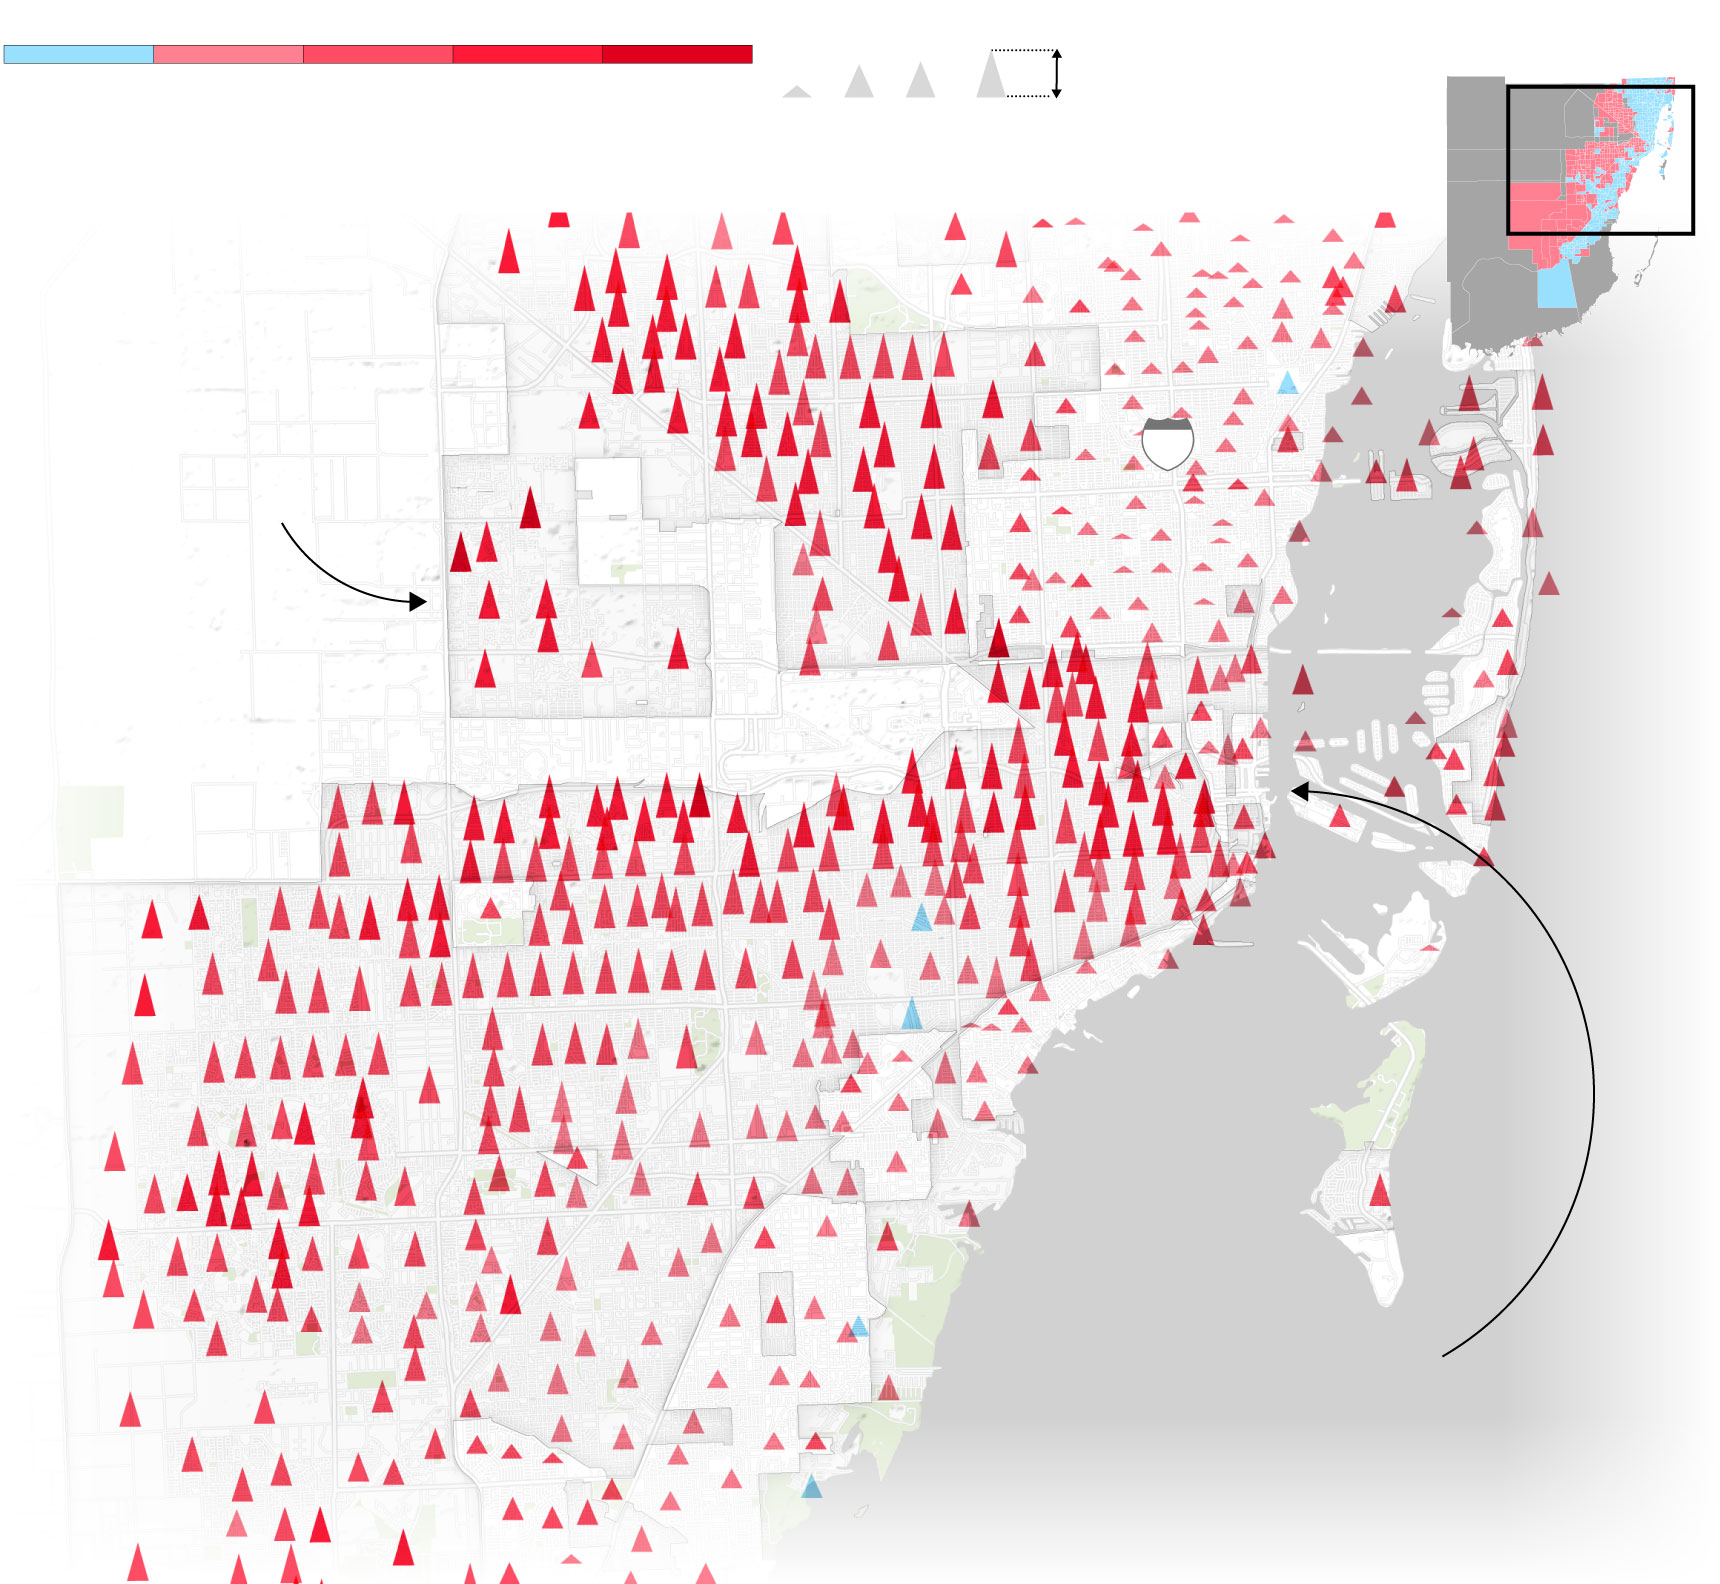
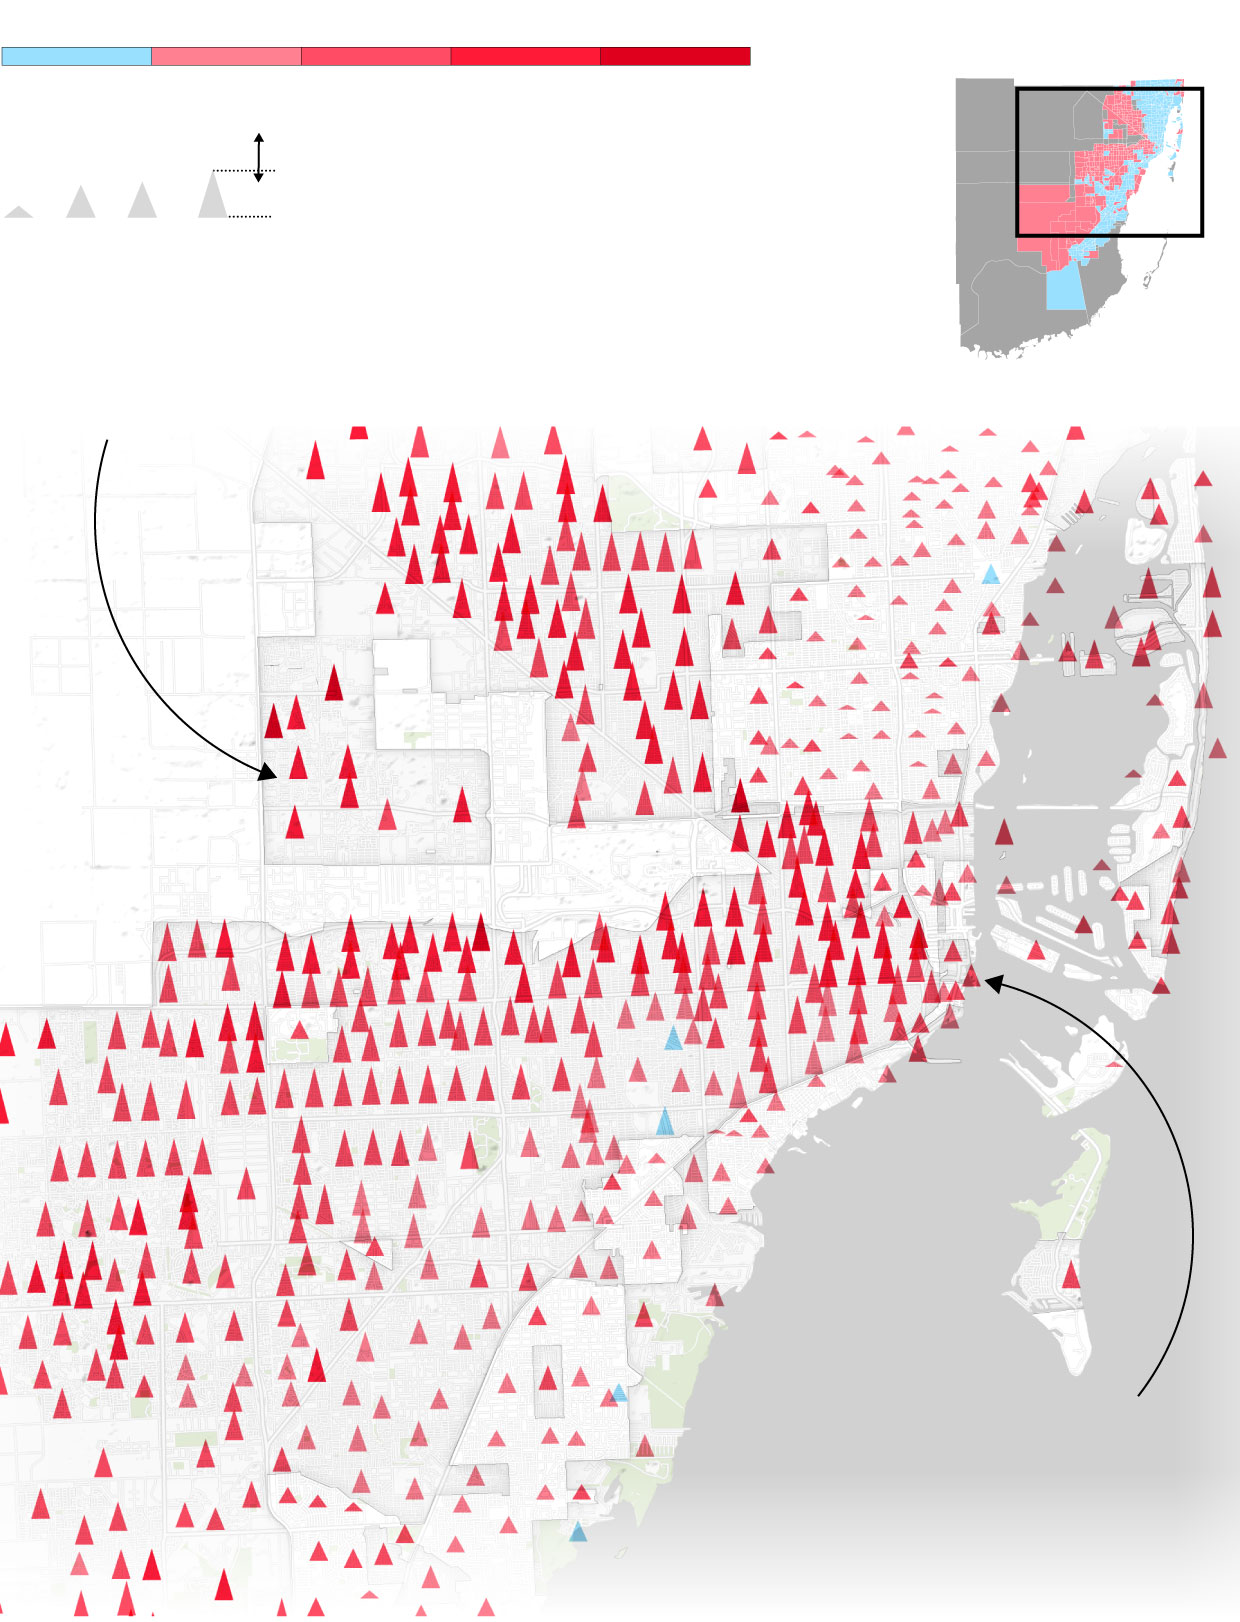
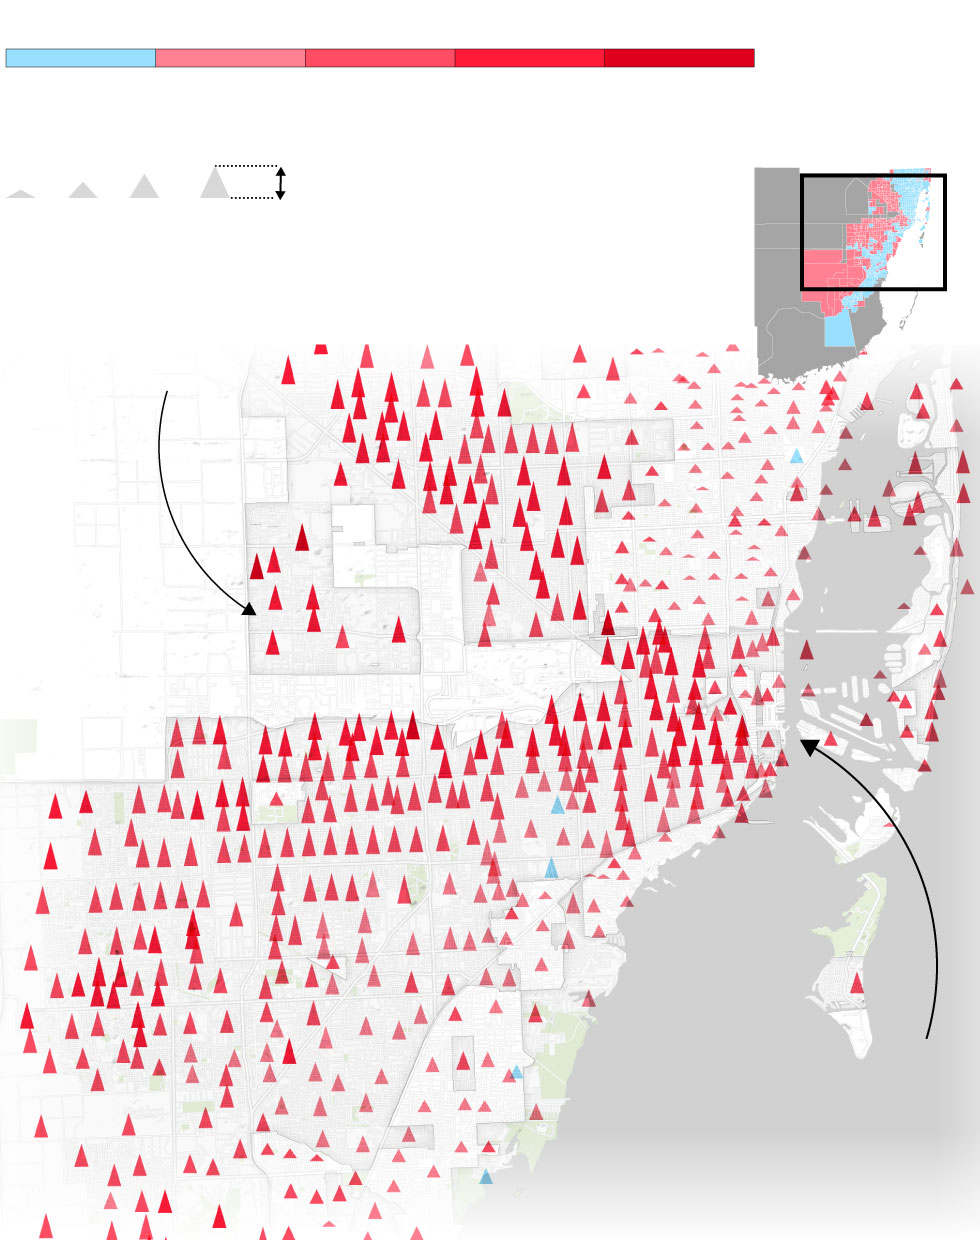
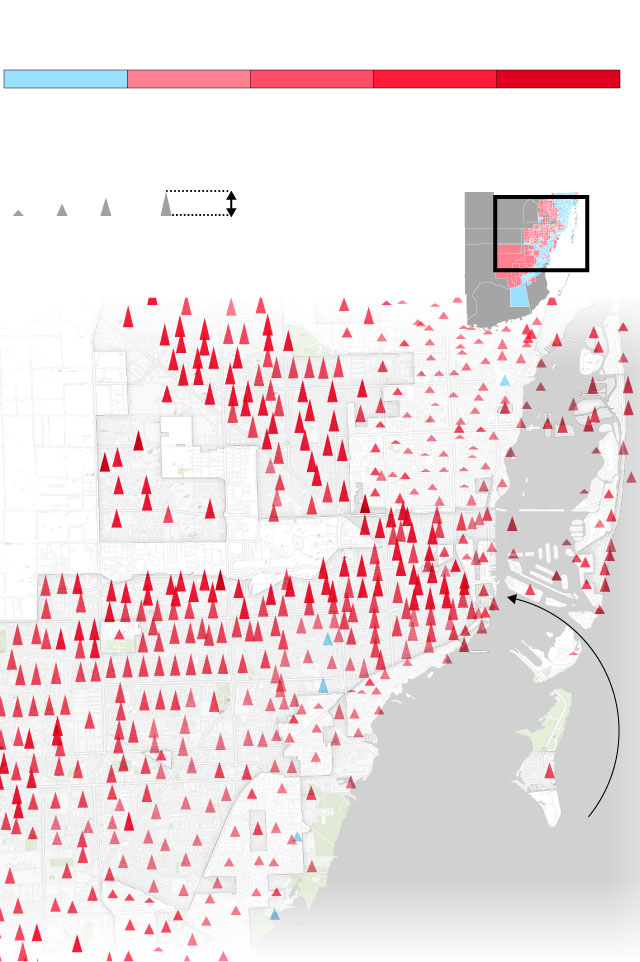
Miami-Dade was the biggest shocker of the three. Trump won 53.5% of the total vote in the majority-Hispanic precincts, which account for almost three-fourths of Miami-Dade’s entire electorate. Back in 2016, he only got 40%.
Core to the Republicans’ playbook: Tarring Biden with the brush of socialism. For the Cuban-Americans, Nicaraguan-Americans and newly arrived Venezuelan-Americans—all exiles of socialist regimes—this was a powerful line and one the Democrats failed to respond to quickly. “The issue went unanswered for too long,” says Eric Rodríguez, senior vice president of policy and advocacy at UnidosUS, a nonpartisan Latino advocacy group.
Another key factor that analysts cite: Trump’s re-open-the-economy message, which resonated loudly with workers in the hard-hit tourism and restaurant industries.
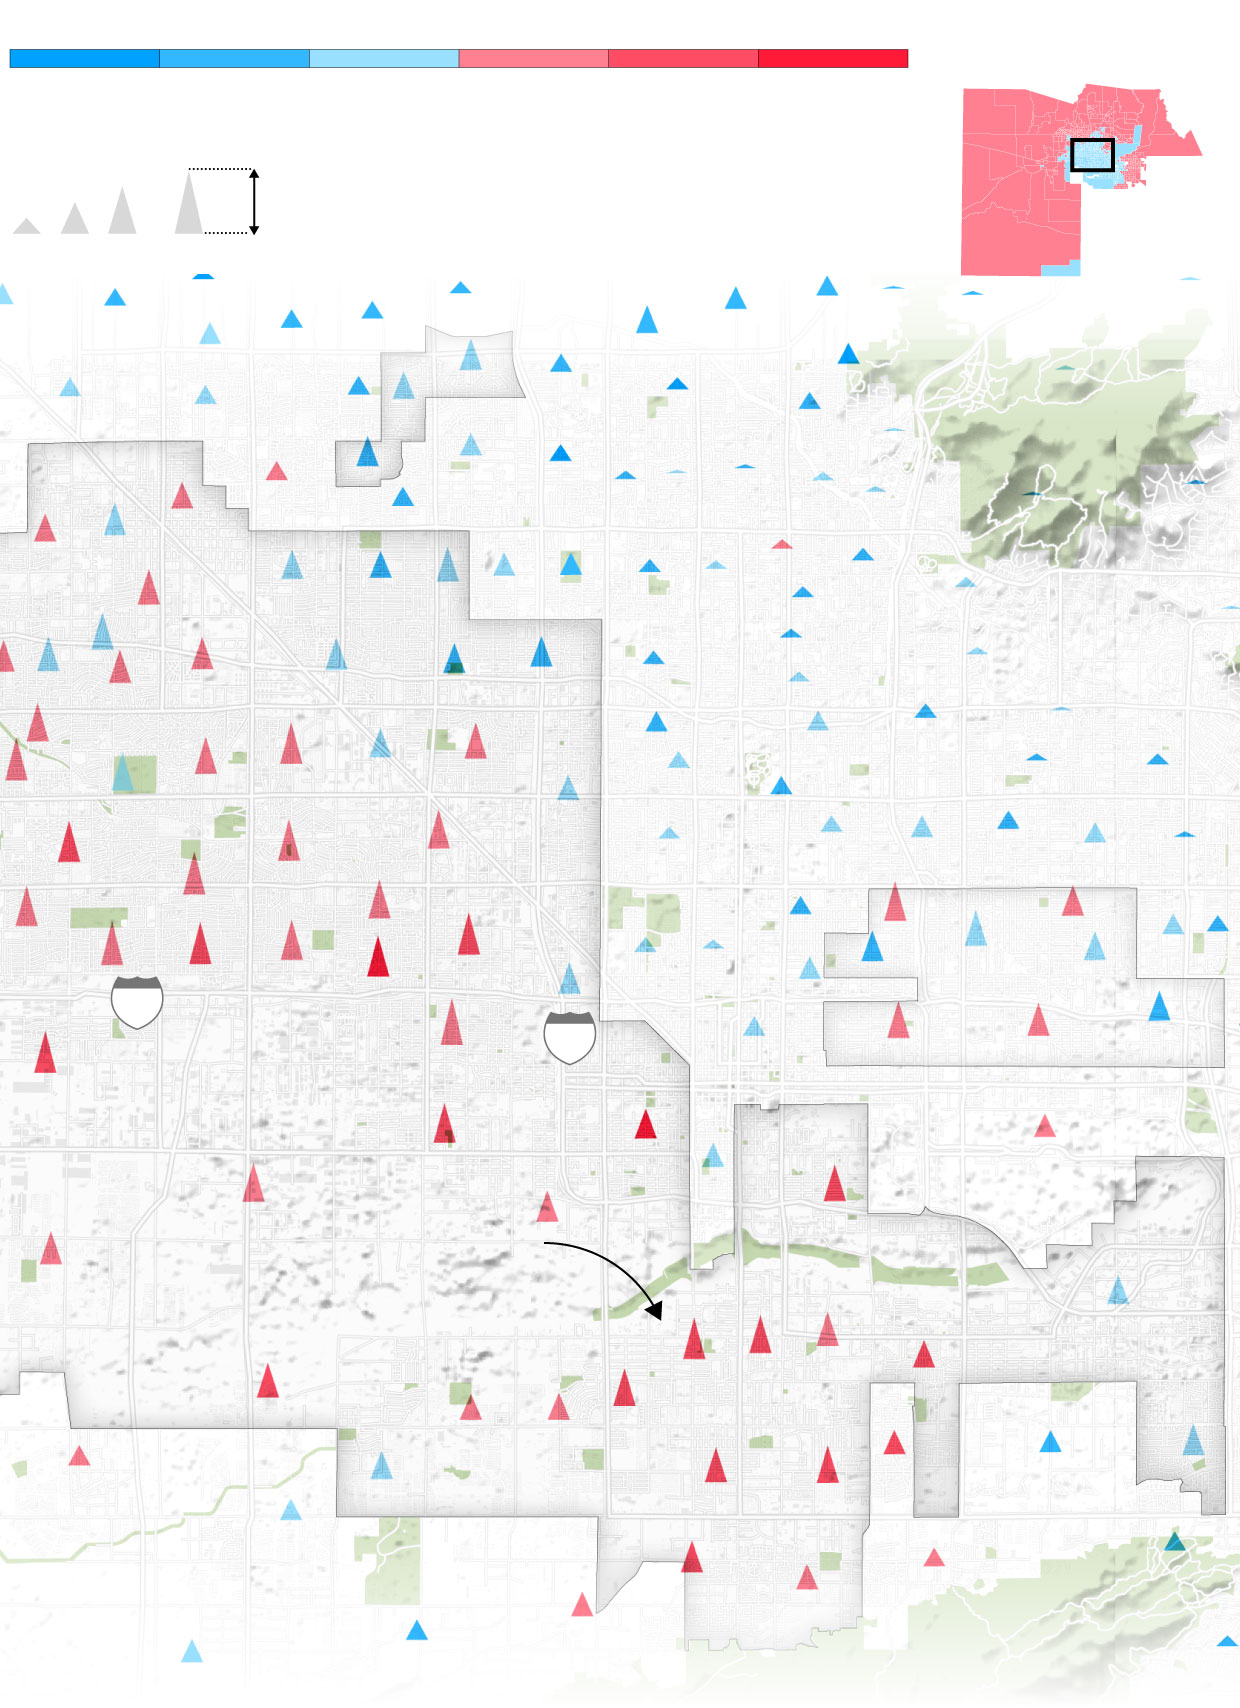
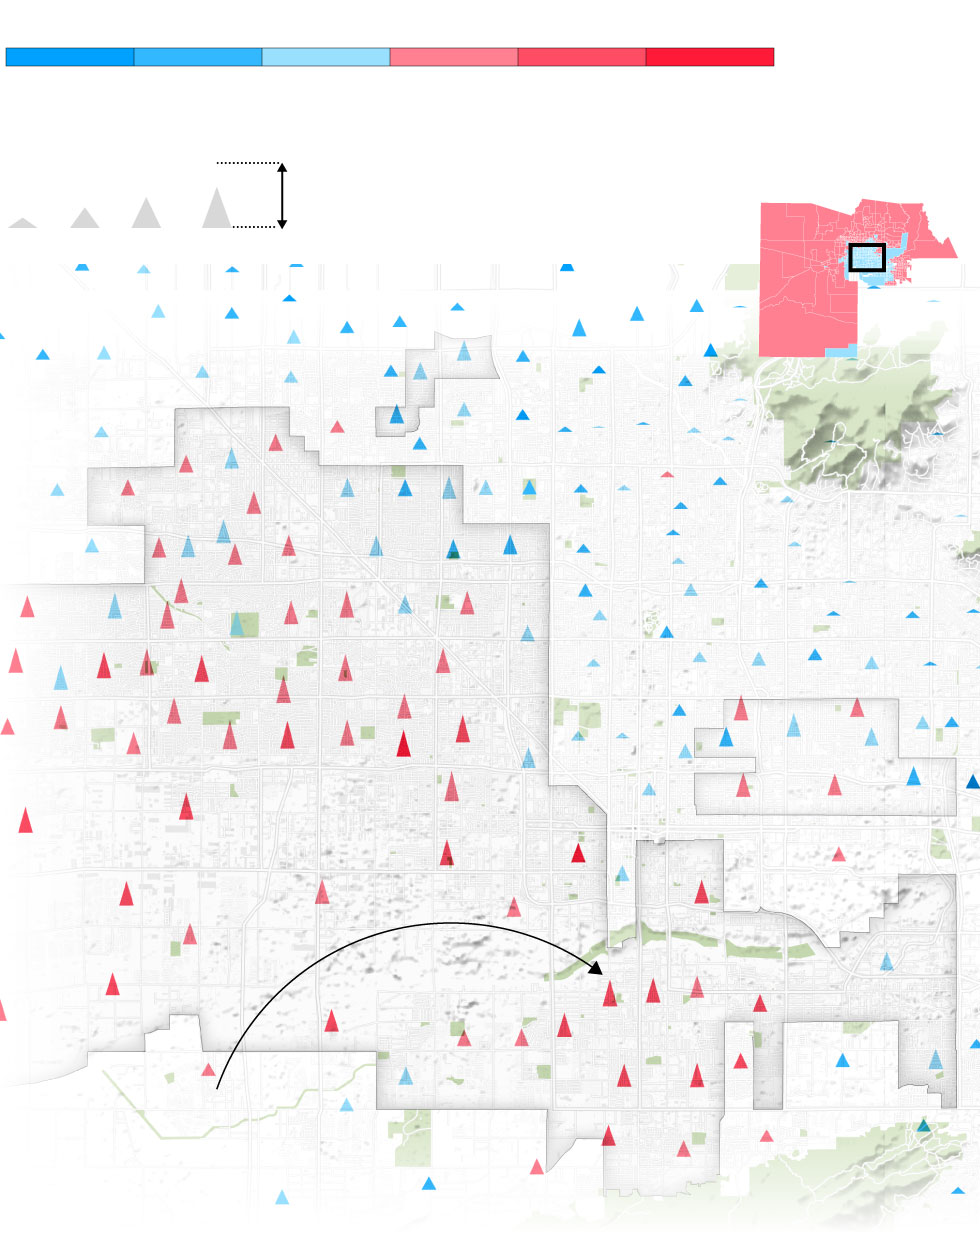
In 2020, Biden won Miami-Dade County in Florida with 53.4% of the vote, but Trump took 61% of Miami-Dade’s 482 majority-Latino precincts, up from 26% of them in 2016.

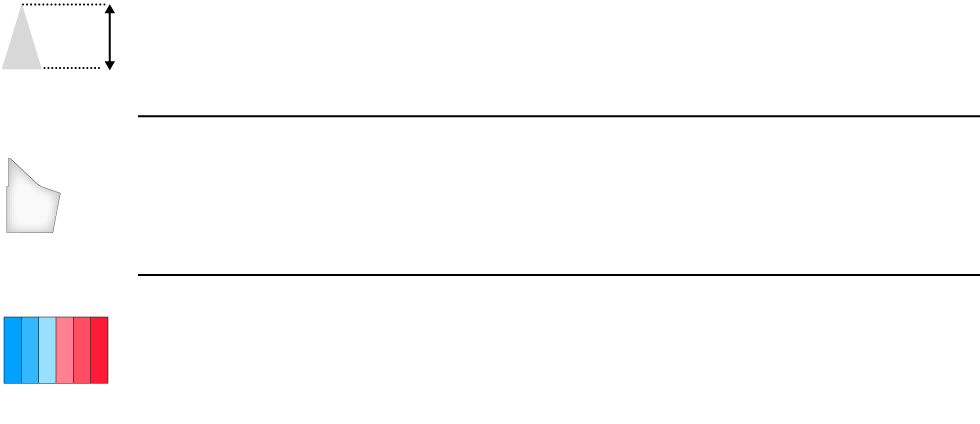
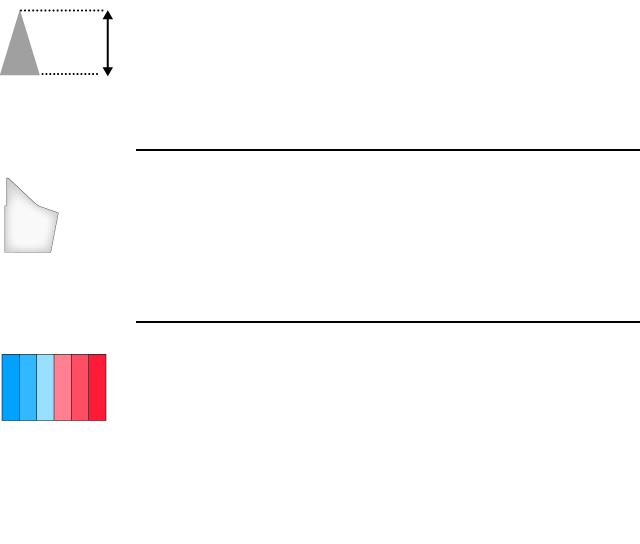
The height of the peaks show the Hispanic share of the population in that precinct
Highlighted precincts are those where Hispanics are a majority of the population
Peaks are shaded blue or red depending on how much the 2020 vote shifted toward Democrats or Republicans compared to 2016
The height of the peaks show the Hispanic share of the
population in that precinct
Highlighted precincts are those where Hispanics are a
majority of the population
Peaks are shaded blue or red depending on how much
the 2020 vote shifted toward Democrats or Republicans
compared to 2016
The height of the peaks show the
Hispanic share of the population
in that precinct
Highlighted precincts are those
where Hispanics are a majority of
the population
Peaks are shaded blue or red
depending on how much the
2020 vote shifted toward
Democrats or Republicans
compared to 2016
Net percentage-point change in two-party vote from 2016
25
50
75
100%
Hispanic share
of population
2020 Presidential
Result
0
15
30
+45 more Rep.
miami-dade County
Hialeah
Area of
detail
Two of the three largest pro-Trump
swings didn't come from Cuban
neighborhoods, but from precincts
around Trump's Doral golf
resort, a heavily-Venezuelan area
sometimes called Doralzuela
95
miami-dade County
Doral
Florida
Miami Beach
Miami
Kendall
One in five precincts—149 in all—
swung 30 points or more toward
Trump, and all but two of those
were majority-Hispanic
Atlantic Ocean
Net percentage-point change in two-party vote from 2016
2020 Presidential
Result
25
50
75
100%
Hispanic share
of population
0
15
30
+45 more Rep.
miami-dade
County
Area of
detail
Two of the three largest pro-Trump
swings didn't come from Cuban
neighborhoods, but from precincts
around Trump's Doral golf
resort, a heavily-Venezuelan area
sometimes called Doralzuela
miami-dade County
95
Doral
Florida
Miami Beach
Miami
Atlantic Ocean
One in five precincts—149 in all—
swung 30 points or more toward
Trump, and all but two of those
were majority-Hispanic
Net percentage-point change in two-party vote from 2016
2020 Presidential
Result
0
15
30
+45 more Rep.
25
50
75
100%
Hispanic share
of population
Two of the three largest pro-Trump
swings didn't come from Cuban
neighborhoods, but from precincts
around Trump's Doral golf resort,
a heavily-Venezuelan area
sometimes called Doralzuela
Area of
detail
miami-dade County
miami-dade
County
Doral
Florida
Miami
Atlantic Ocean
One in five precincts—149 in all—
swung 30 points or more toward
Trump, and all but two of those
were majority-Hispanic
Net percentage-point change in two-party vote from 2016
0
15
30
+45 more Rep.
2020 Presidential
Result
25
50
75
100%
Hispanic share
of population
Two of the three largest pro-Trump
swings didn't come from Cuban
neighborhoods, but from precincts
around Trump's Doral golf
resort, a heavily-Venezuelan area
sometimes called Doralzuela
Area of
detail
miami-dade County
miami-dade
County
Doral
Florida
Miami
Atlantic Ocean
One in five precincts—149 in all—
swung 30 points or more toward
Trump, and all but two of those
were majority-Hispanic
Net percentage-point change in two-party
vote from 2016
0
15
30
+45 more Rep.
25
50
75
100%
2020 Presidential
Result
Hispanic share
of population
Area of
detail
miami-dade County
Doral
Florida
Miami
One in five precincts—149 in all—
swung 30 points or more toward
Trump, and all but two of those
were majority-Hispanic
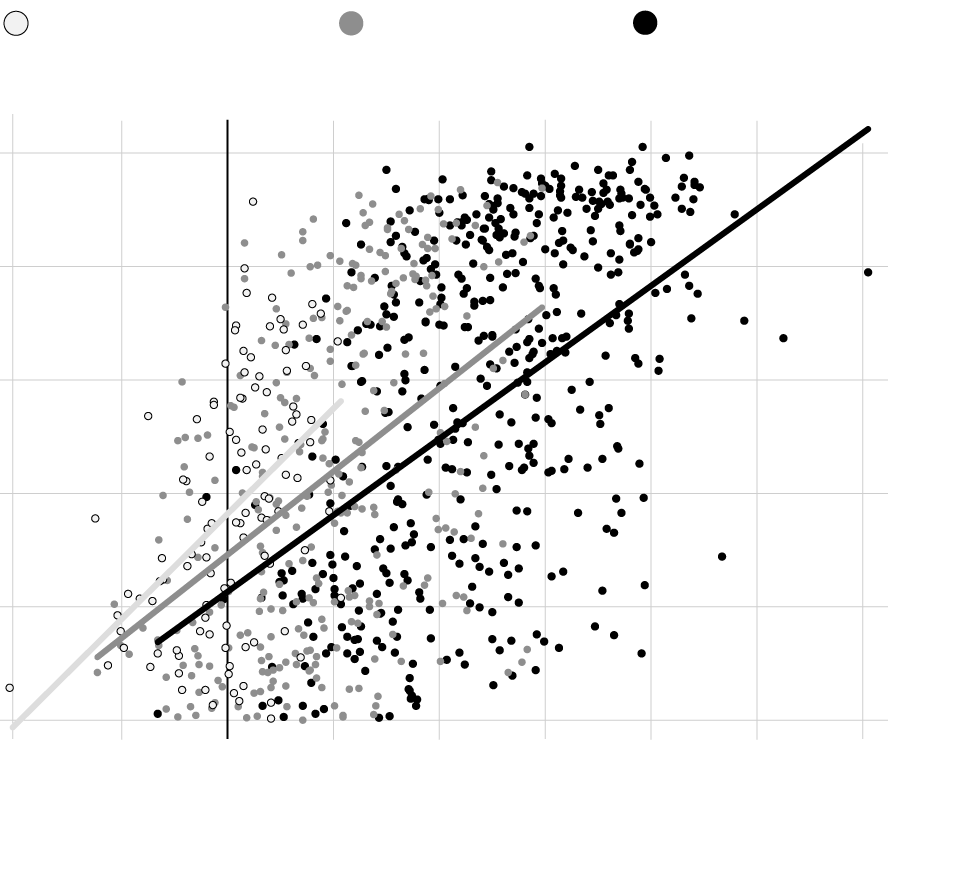
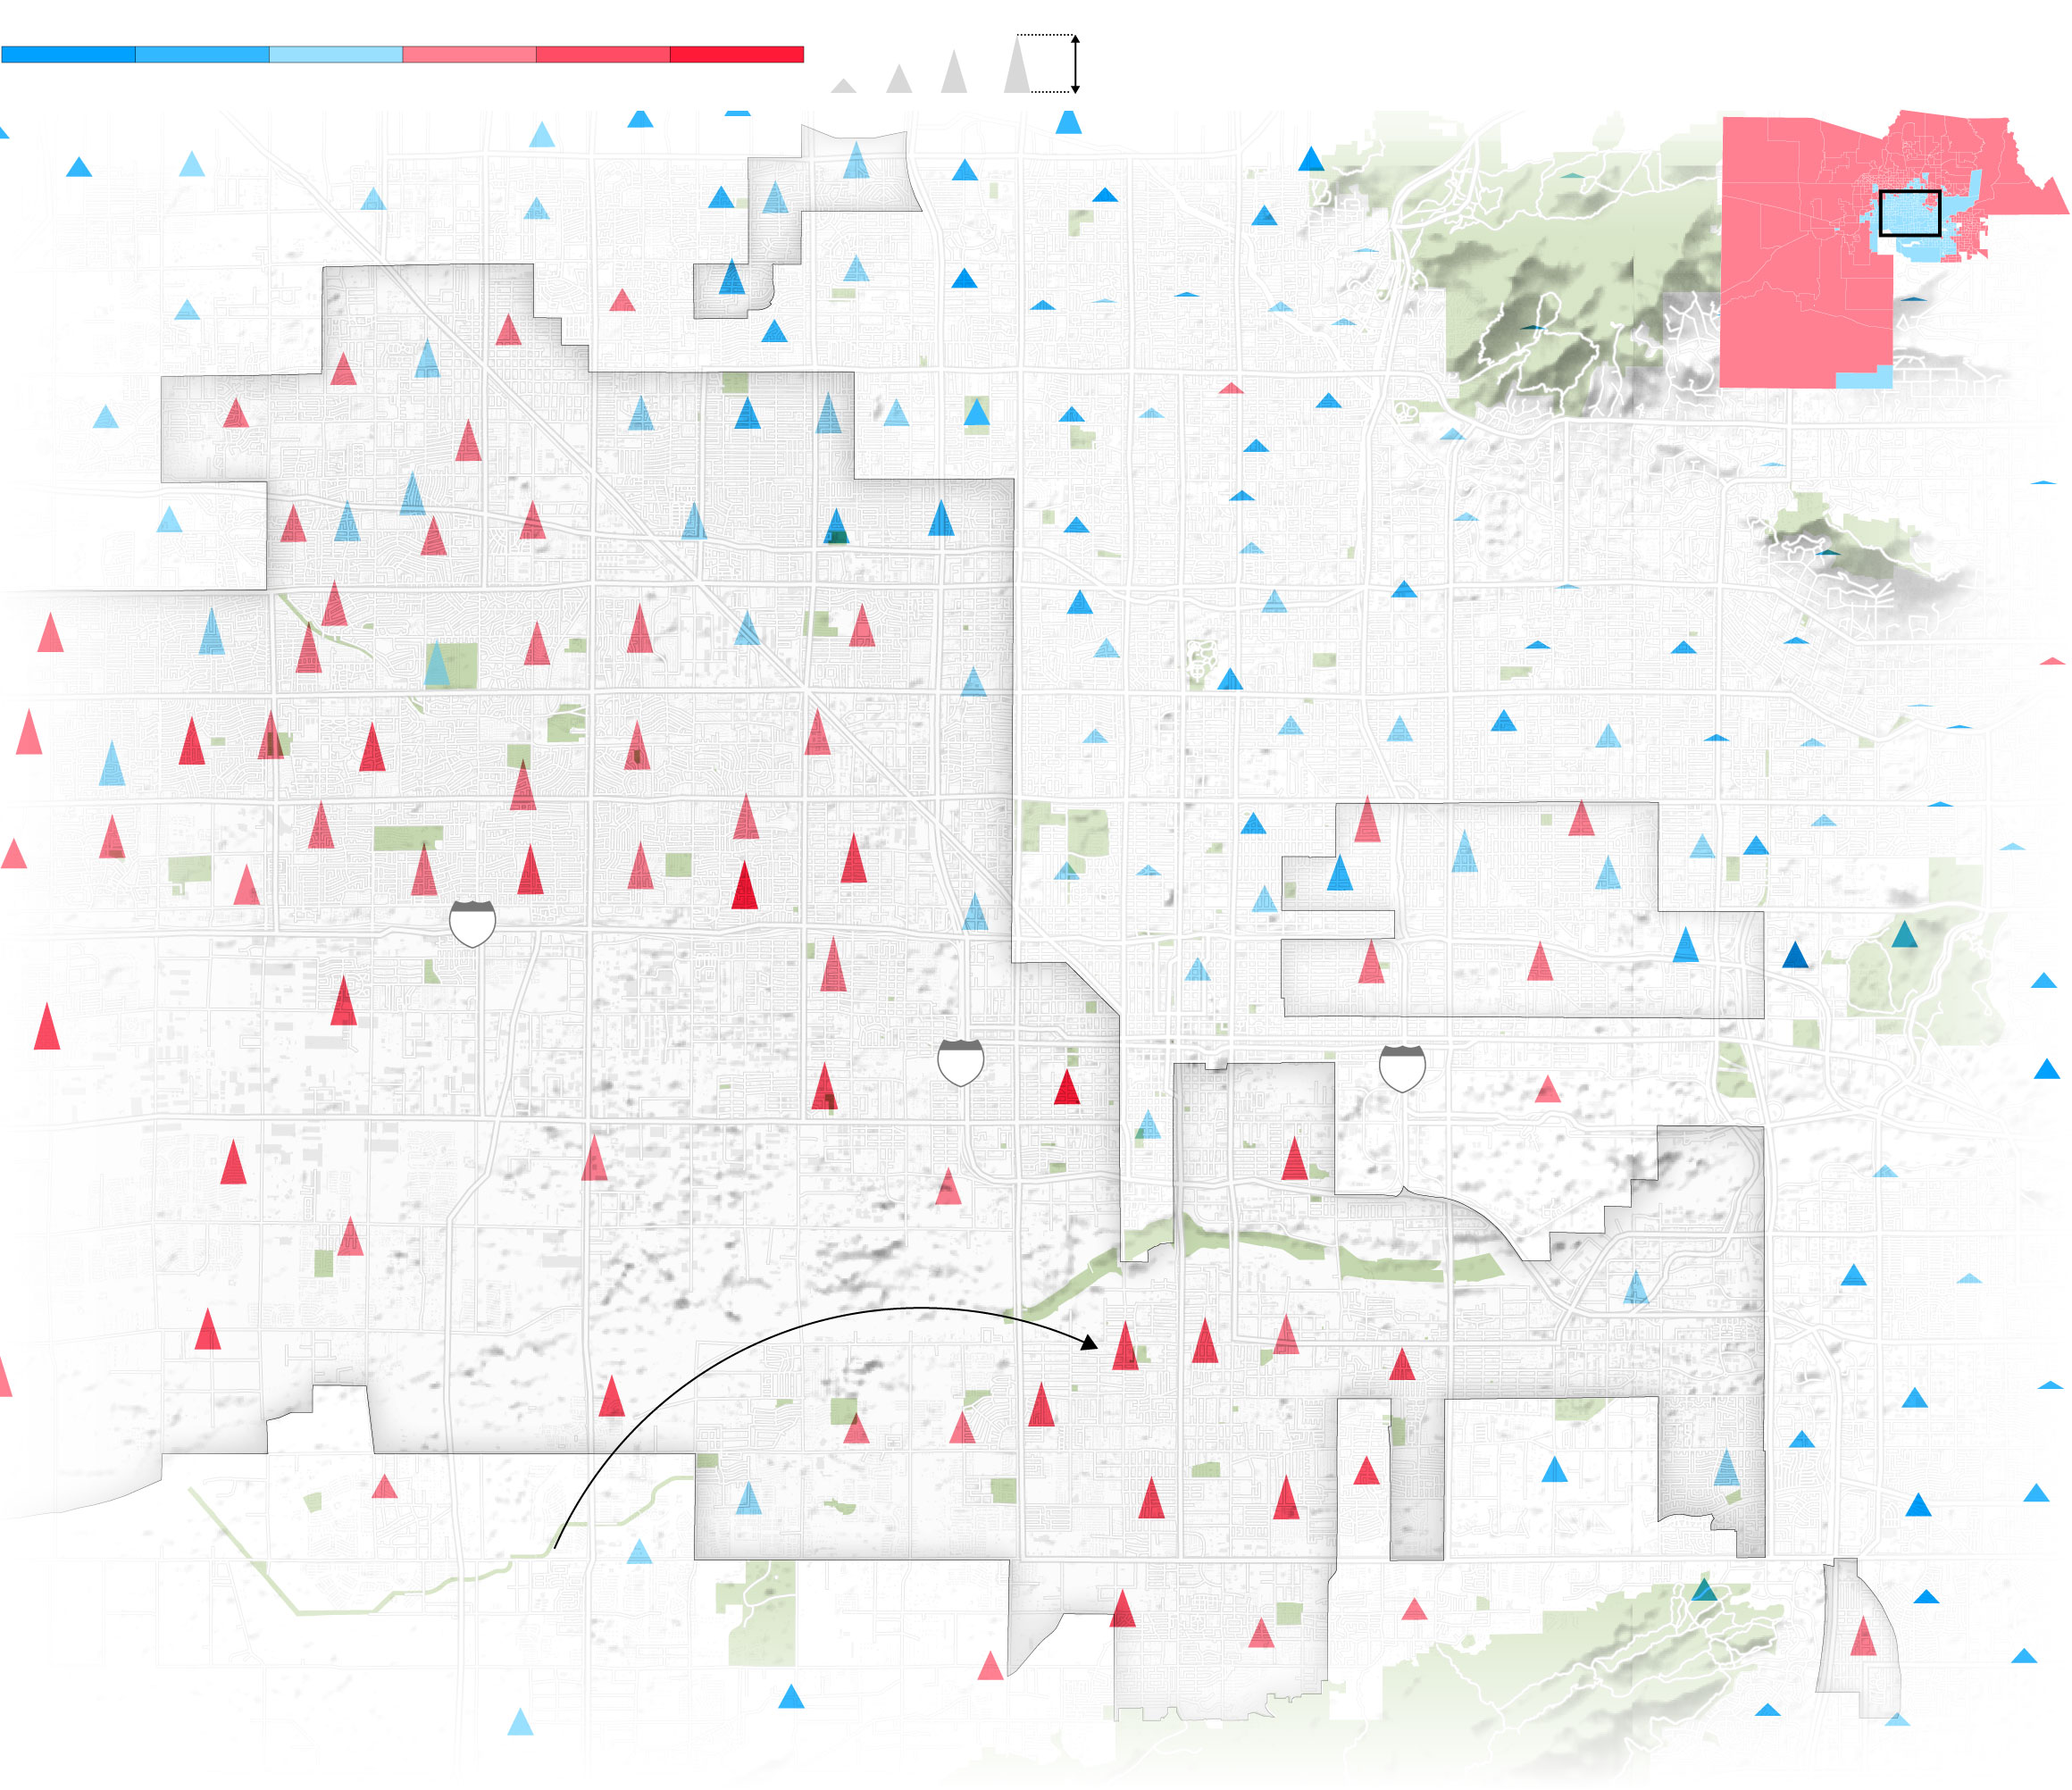
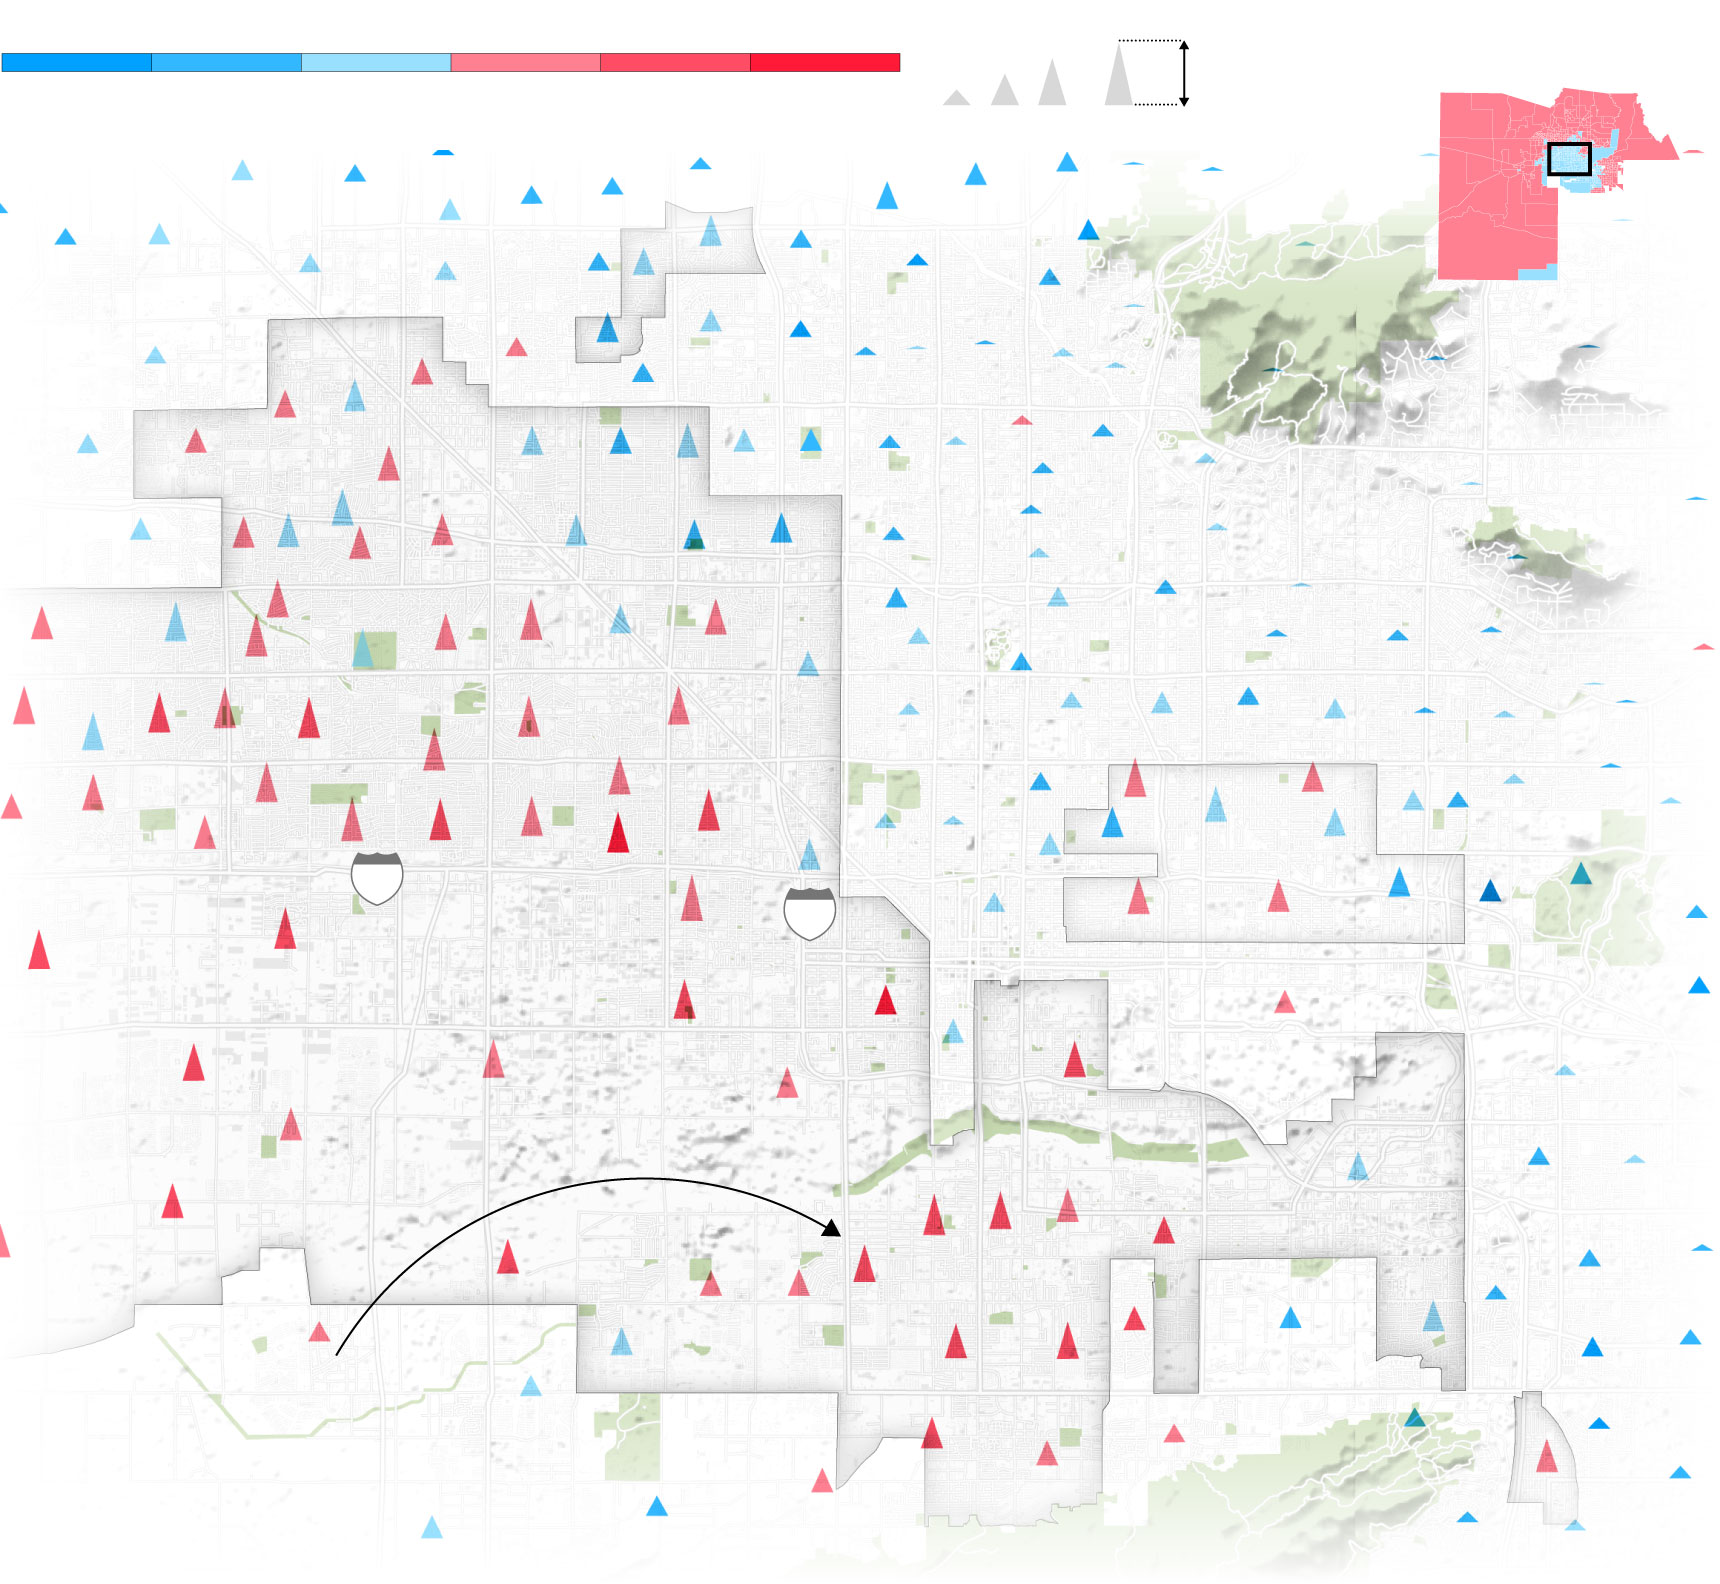
Maricopa was more of a mixed picture. On a net basis, Latino votes shifted Trump’s way, when compared to the 2016 election, in 61% of the county’s 109 majority-Hispanic precincts. Still, Biden managed to defeat Trump in every single one of them.
The county is full of young Mexican-Americans and that youth, local political analysts say, proved a decisive factor. They’re progressive, they care deeply about equality and immigration policy after living through Sheriff Joe Arpaio’s decades-long crackdown, and they were rallied to the polls by groups of well-organized activists.
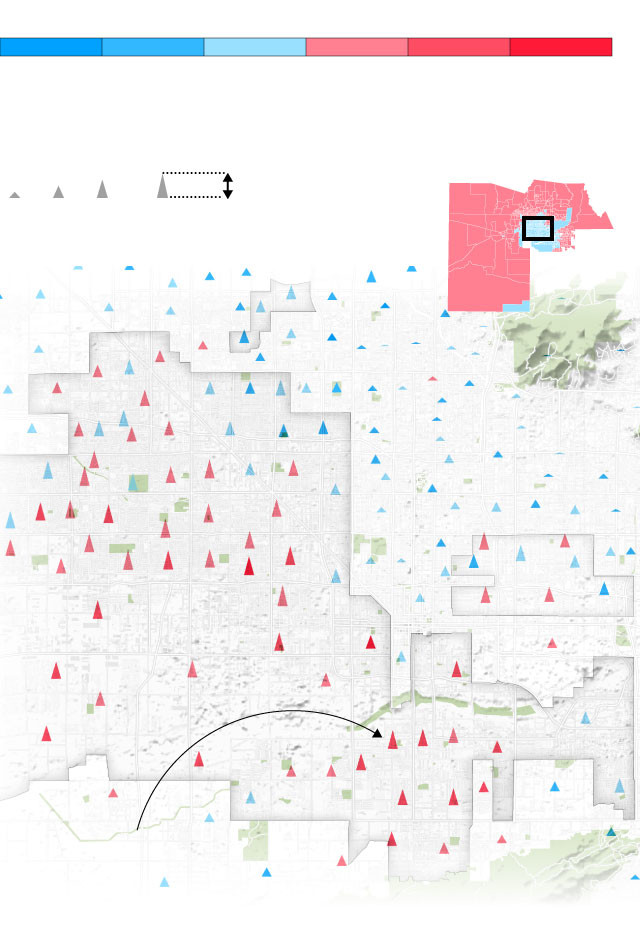
In 2020, Biden won Maricopa County in Arizona with 50.3% of the vote. He won all 109 of the majority-Latino precincts in the county. In more than half of them, his margin of victory was smaller than Hillary Clinton’s was in 2016.
The height of the peaks show the Hispanic share of the population in that precinct
Highlighted precincts are those where Hispanics are a majority of the population
Peaks are shaded blue or red depending on how much the 2020 vote shifted toward Democrats or Republicans compared to 2016
The height of the peaks show the Hispanic share of the
population in that precinct
Highlighted precincts are those where Hispanics are a
majority of the population
Peaks are shaded blue or red depending on how much
the 2020 vote shifted toward Democrats or Republicans
compared to 2016
The height of the peaks show the
Hispanic share of the population
in that precinct
Highlighted precincts are those
where Hispanics are a majority of
the population
Peaks are shaded blue or red
depending on how much the
2020 vote shifted toward
Democrats or Republicans
compared to 2016
Net percentage-point change in two-party vote from 2016
25
50
75
100%
Hispanic share
of population
2020 Presidential
Result
+10 more Dem.
5
0
5
+10 more Rep.
Phoenix
Mountains
Preserve
Area of
detail
Alhambra
Glendale
maricopa county
Maricopa County
Camelback East
Village
Encanto
Village
10
Phoenix
Estrella Village
17
10
Arizona
Central City
South
Mountain Village
This cluster of precincts south of the Salt River
went 70% or more for Biden, despite a net shift
of 5 to 11 points toward Trump
South Mountain
Park and Reserve
Net percentage-point change in two-party vote from 2016
25
50
75
100%
2020 Presidential
Result
Hispanic share
of population
+10 more Dem.
5
0
5
+10 more Rep.
Area of
detail
Phoenix
Mountains
Preserve
maricopa county
Alhambra
Glendale
Maricopa County
Encanto
Village
10
17
Phoenix
Estrella Village
Arizona
Central City
South
Mountain Village
This cluster of precincts south of
the Salt River went 70% or more
for Biden, despite a net shift
of 5 to 11 points toward Trump
South Mountain
Park and Reserve
Net percentage-point change in two-party vote from 2016
2020 Presidential
Result
+10 more Dem.
5
0
5
+10 more Rep.
25
50
75
100%
Area of
detail
Hispanic share
of population
maricopa county
Phoenix
Mountains
Preserve
Alhambra
Glendale
Maricopa County
Encanto
Village
10
17
Phoenix
Estrella Village
Central City
This cluster of precincts south of
the Salt River went 70% or more
for Biden, despite a net shift
of 5 to 11 points toward Trump
South
Mountain Village
Arizona
South Mountain
Park and Reserve
Net percentage-point change in two-party vote from 2016
+10 more Dem.
5
0
5
+10 more Rep.
25
50
75
100%
2020 Presidential
Result
Hispanic share
of population
Area of
detail
maricopa county
Maricopa County
Glendale
Estrella Village
Phoenix
Arizona
This cluster of precincts south of
the Salt River went 70% or more
for Biden, despite a net shift
of 5 to 11 points toward Trump
Net percentage-point change in two-party vote from 2016
+10 more Dem.
5
0
5
+10 more Rep.
25
50
75
100%
2020 Presidential
Result
Hispanic share
of population
Area of
detail
maricopa county
Glendale
Arizona
Phoenix
Estrella Village
This cluster of precincts south of
the Salt River went 70% or more
for Biden, despite a net shift
of 5 to 11 points toward Trump
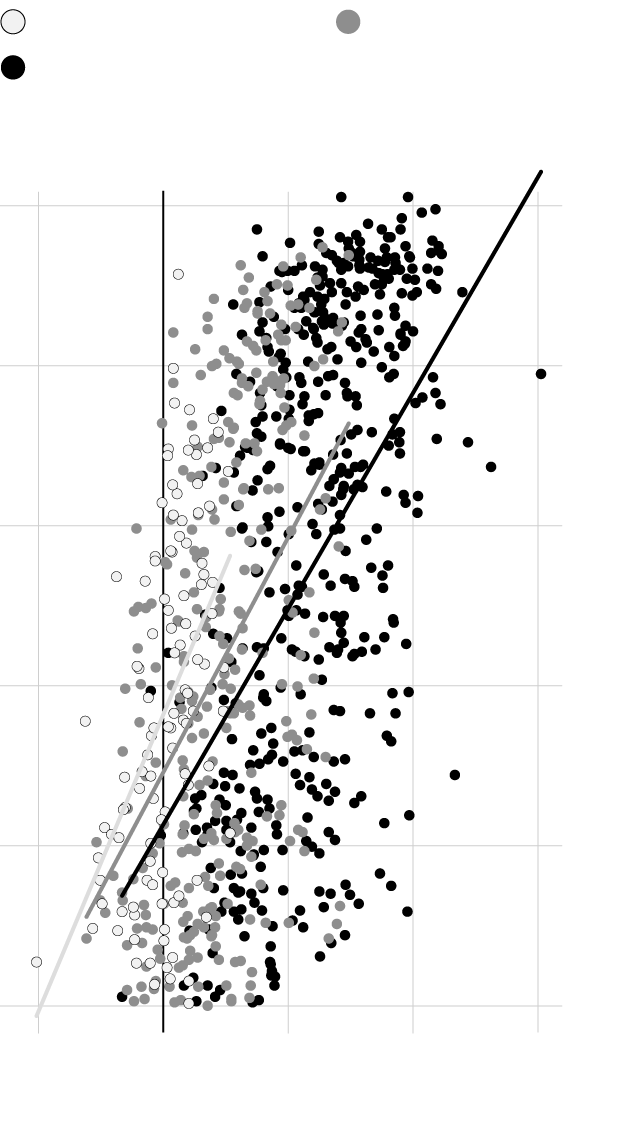
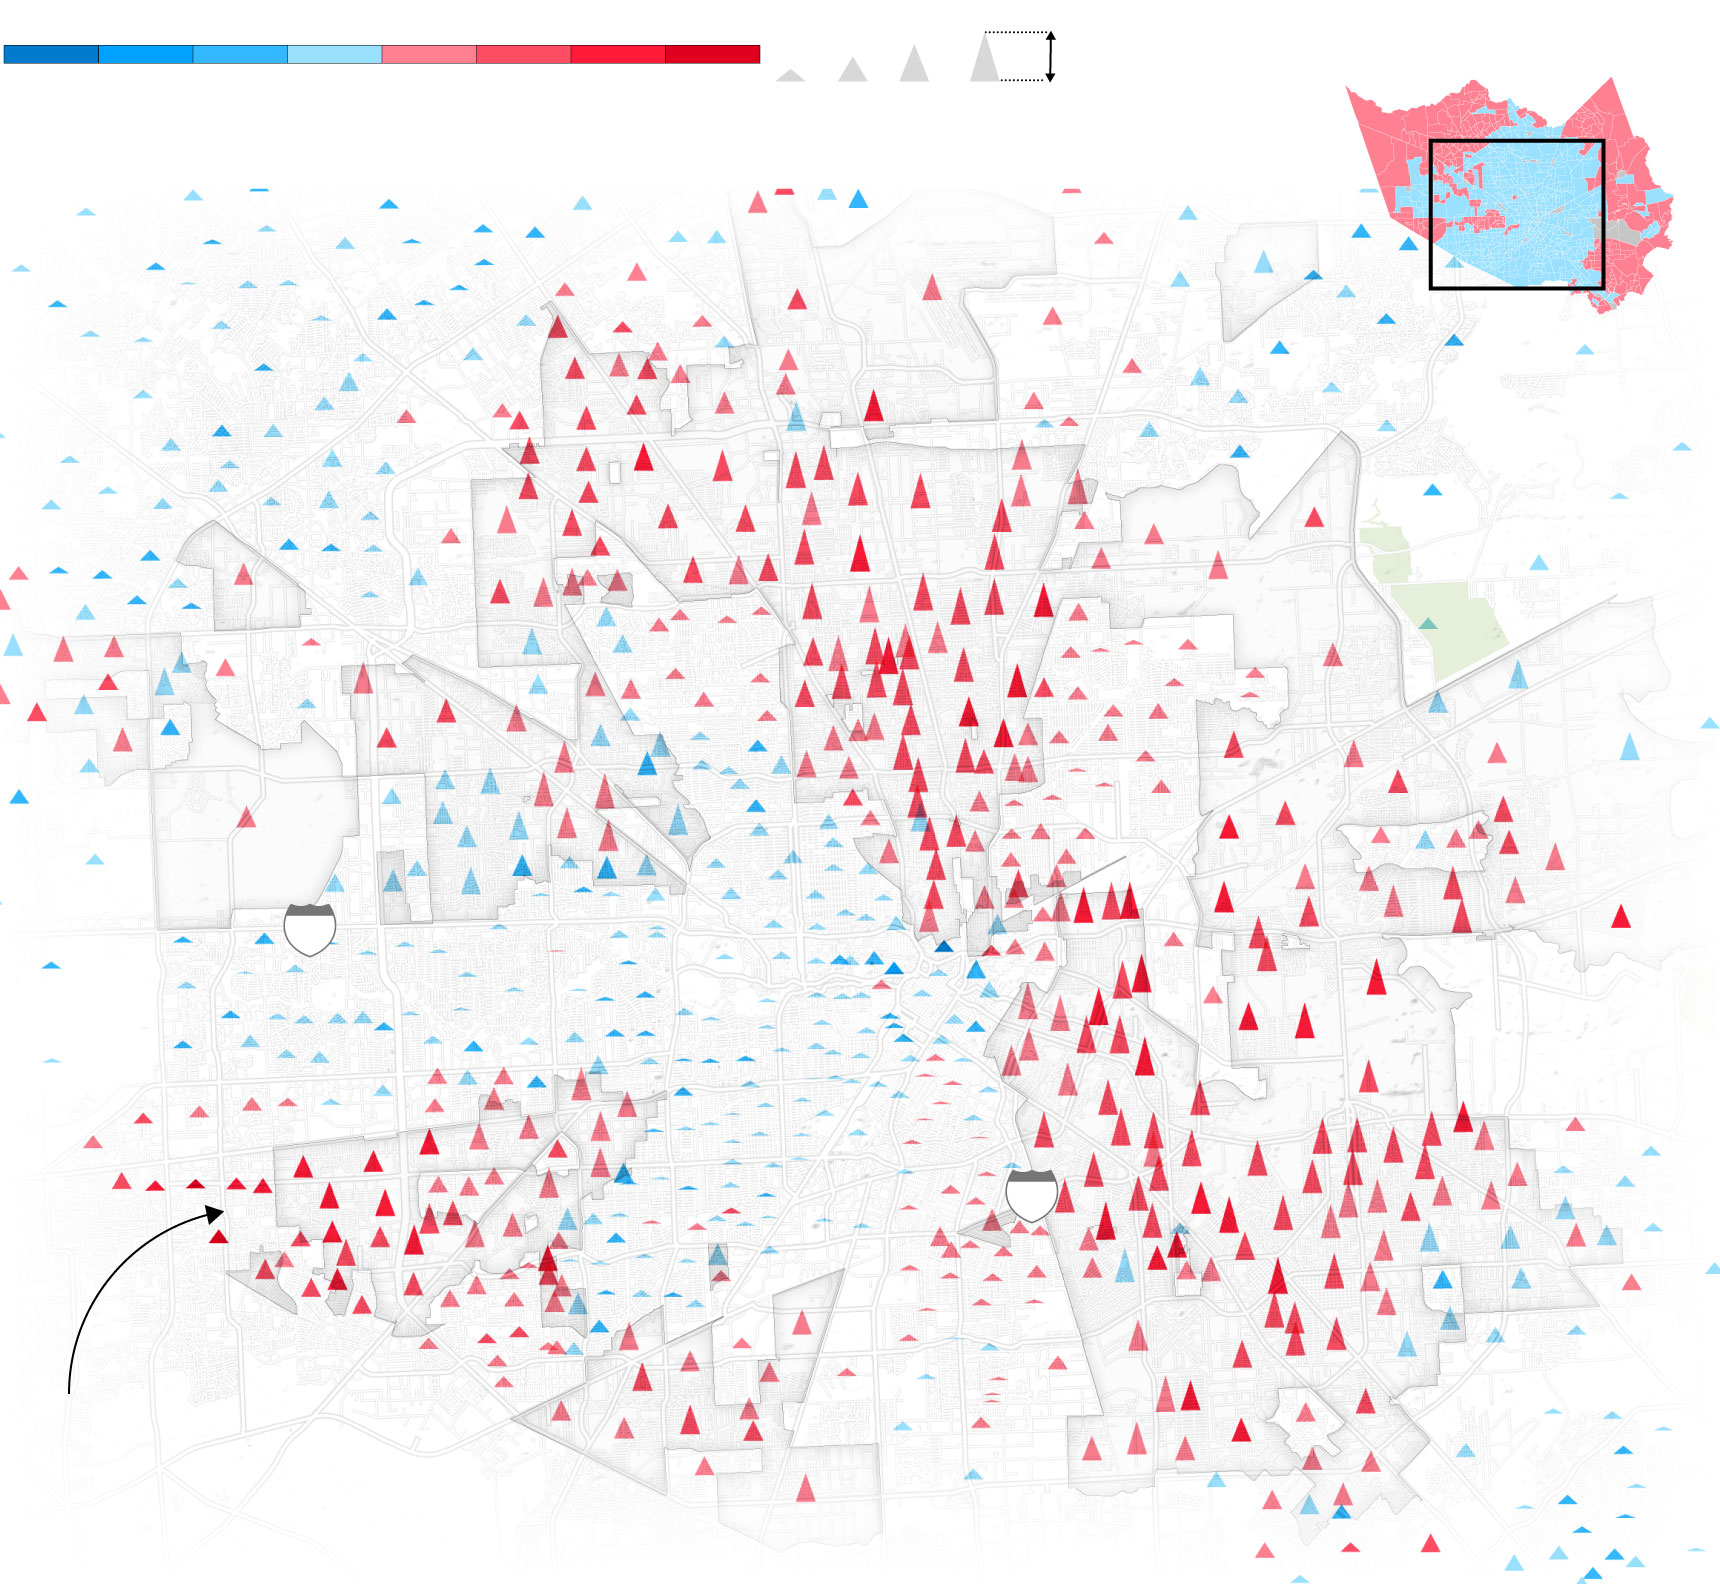
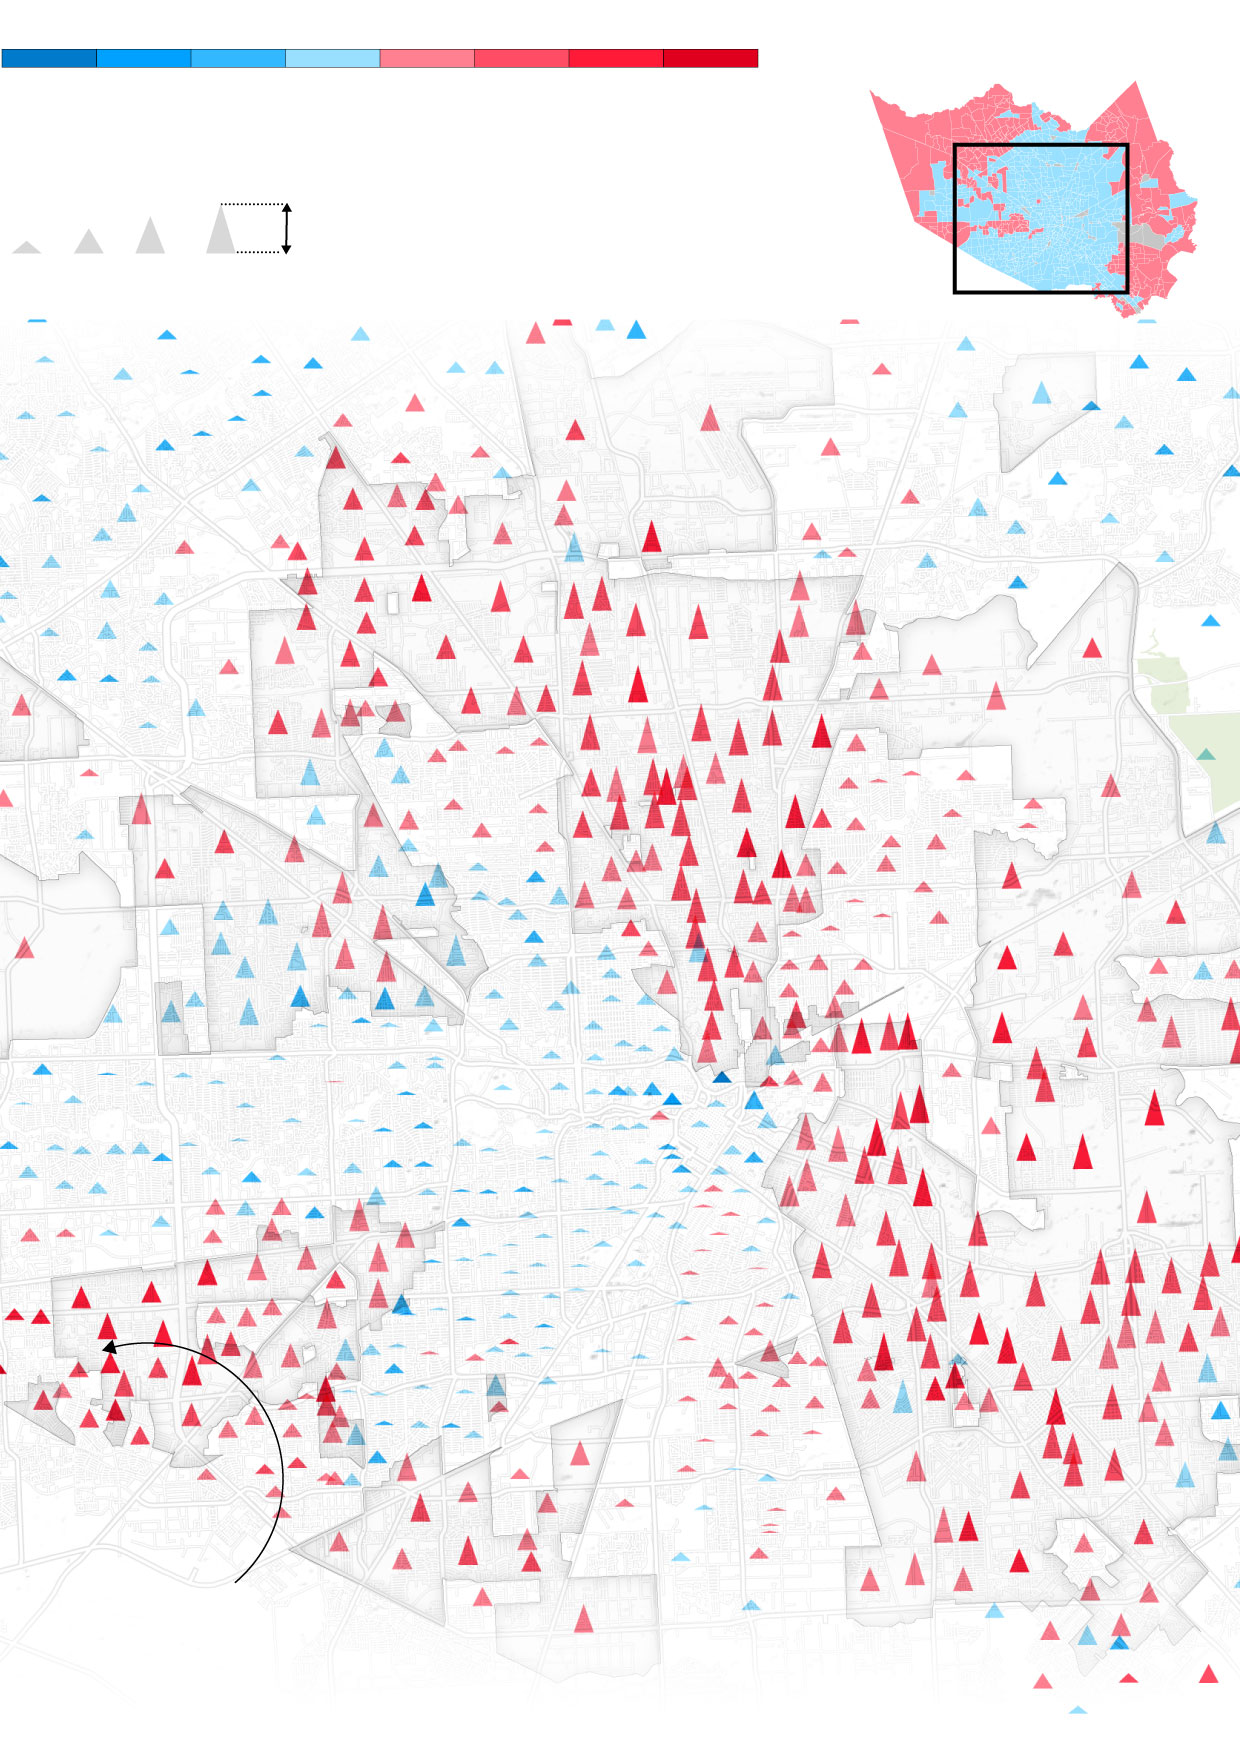
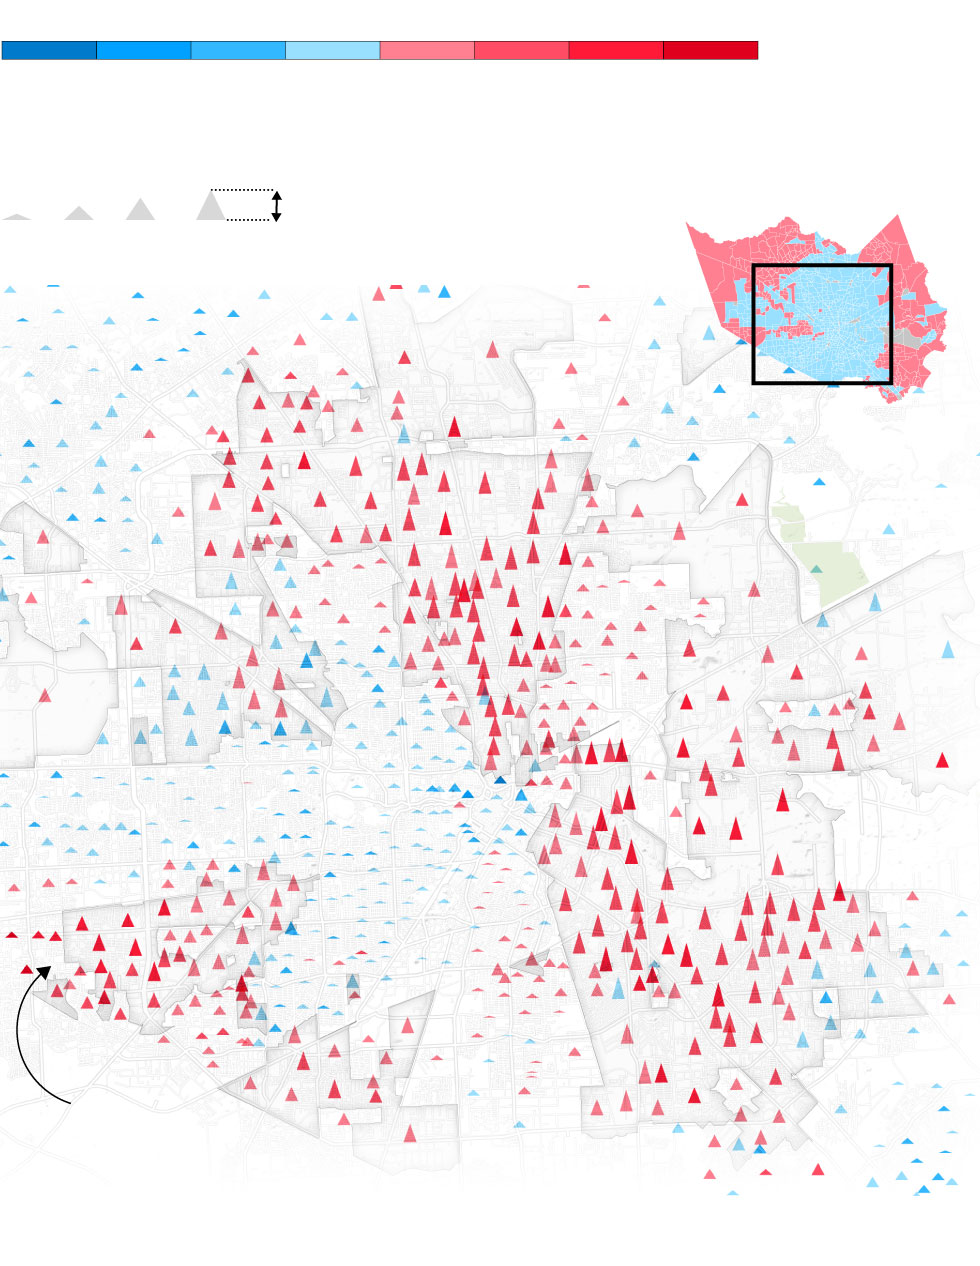
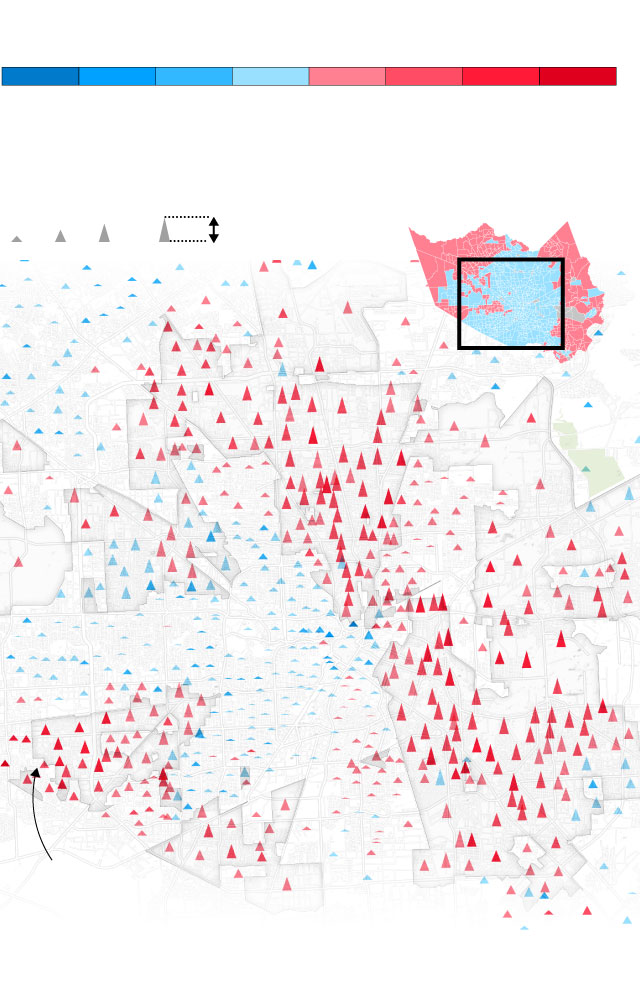
In Harris, the shift was stark. In almost 90% of the county’s 299 majority-Hispanic precincts, the vote count swung in Trump’s direction when compared to 2016. And while Biden still won nearly all of these precincts, the net vote shift towards Trump swelled to as many as 30 percentage points in some precincts.
Oil was part of the story. Houston, which makes up most of the county, is America’s energy capital. So Biden’s talk of banning new fracking on federal lands and gradually transitioning away from oil in coming decades wasn’t well received. Conversely, Trump’s call to open the economy was. Just like in Miami-Dade, the restaurant and hospitality industries are major employers in the area.
Socially, the Mexican-Americans, or Tejanos as some call themselves, are also more conservative here than they are in other parts of the country. The law-and-order message appeals to many of them. (Further south, in the Rio Grande Valley along the border with Mexico, Trump made huge gains in majority-Latino counties.)
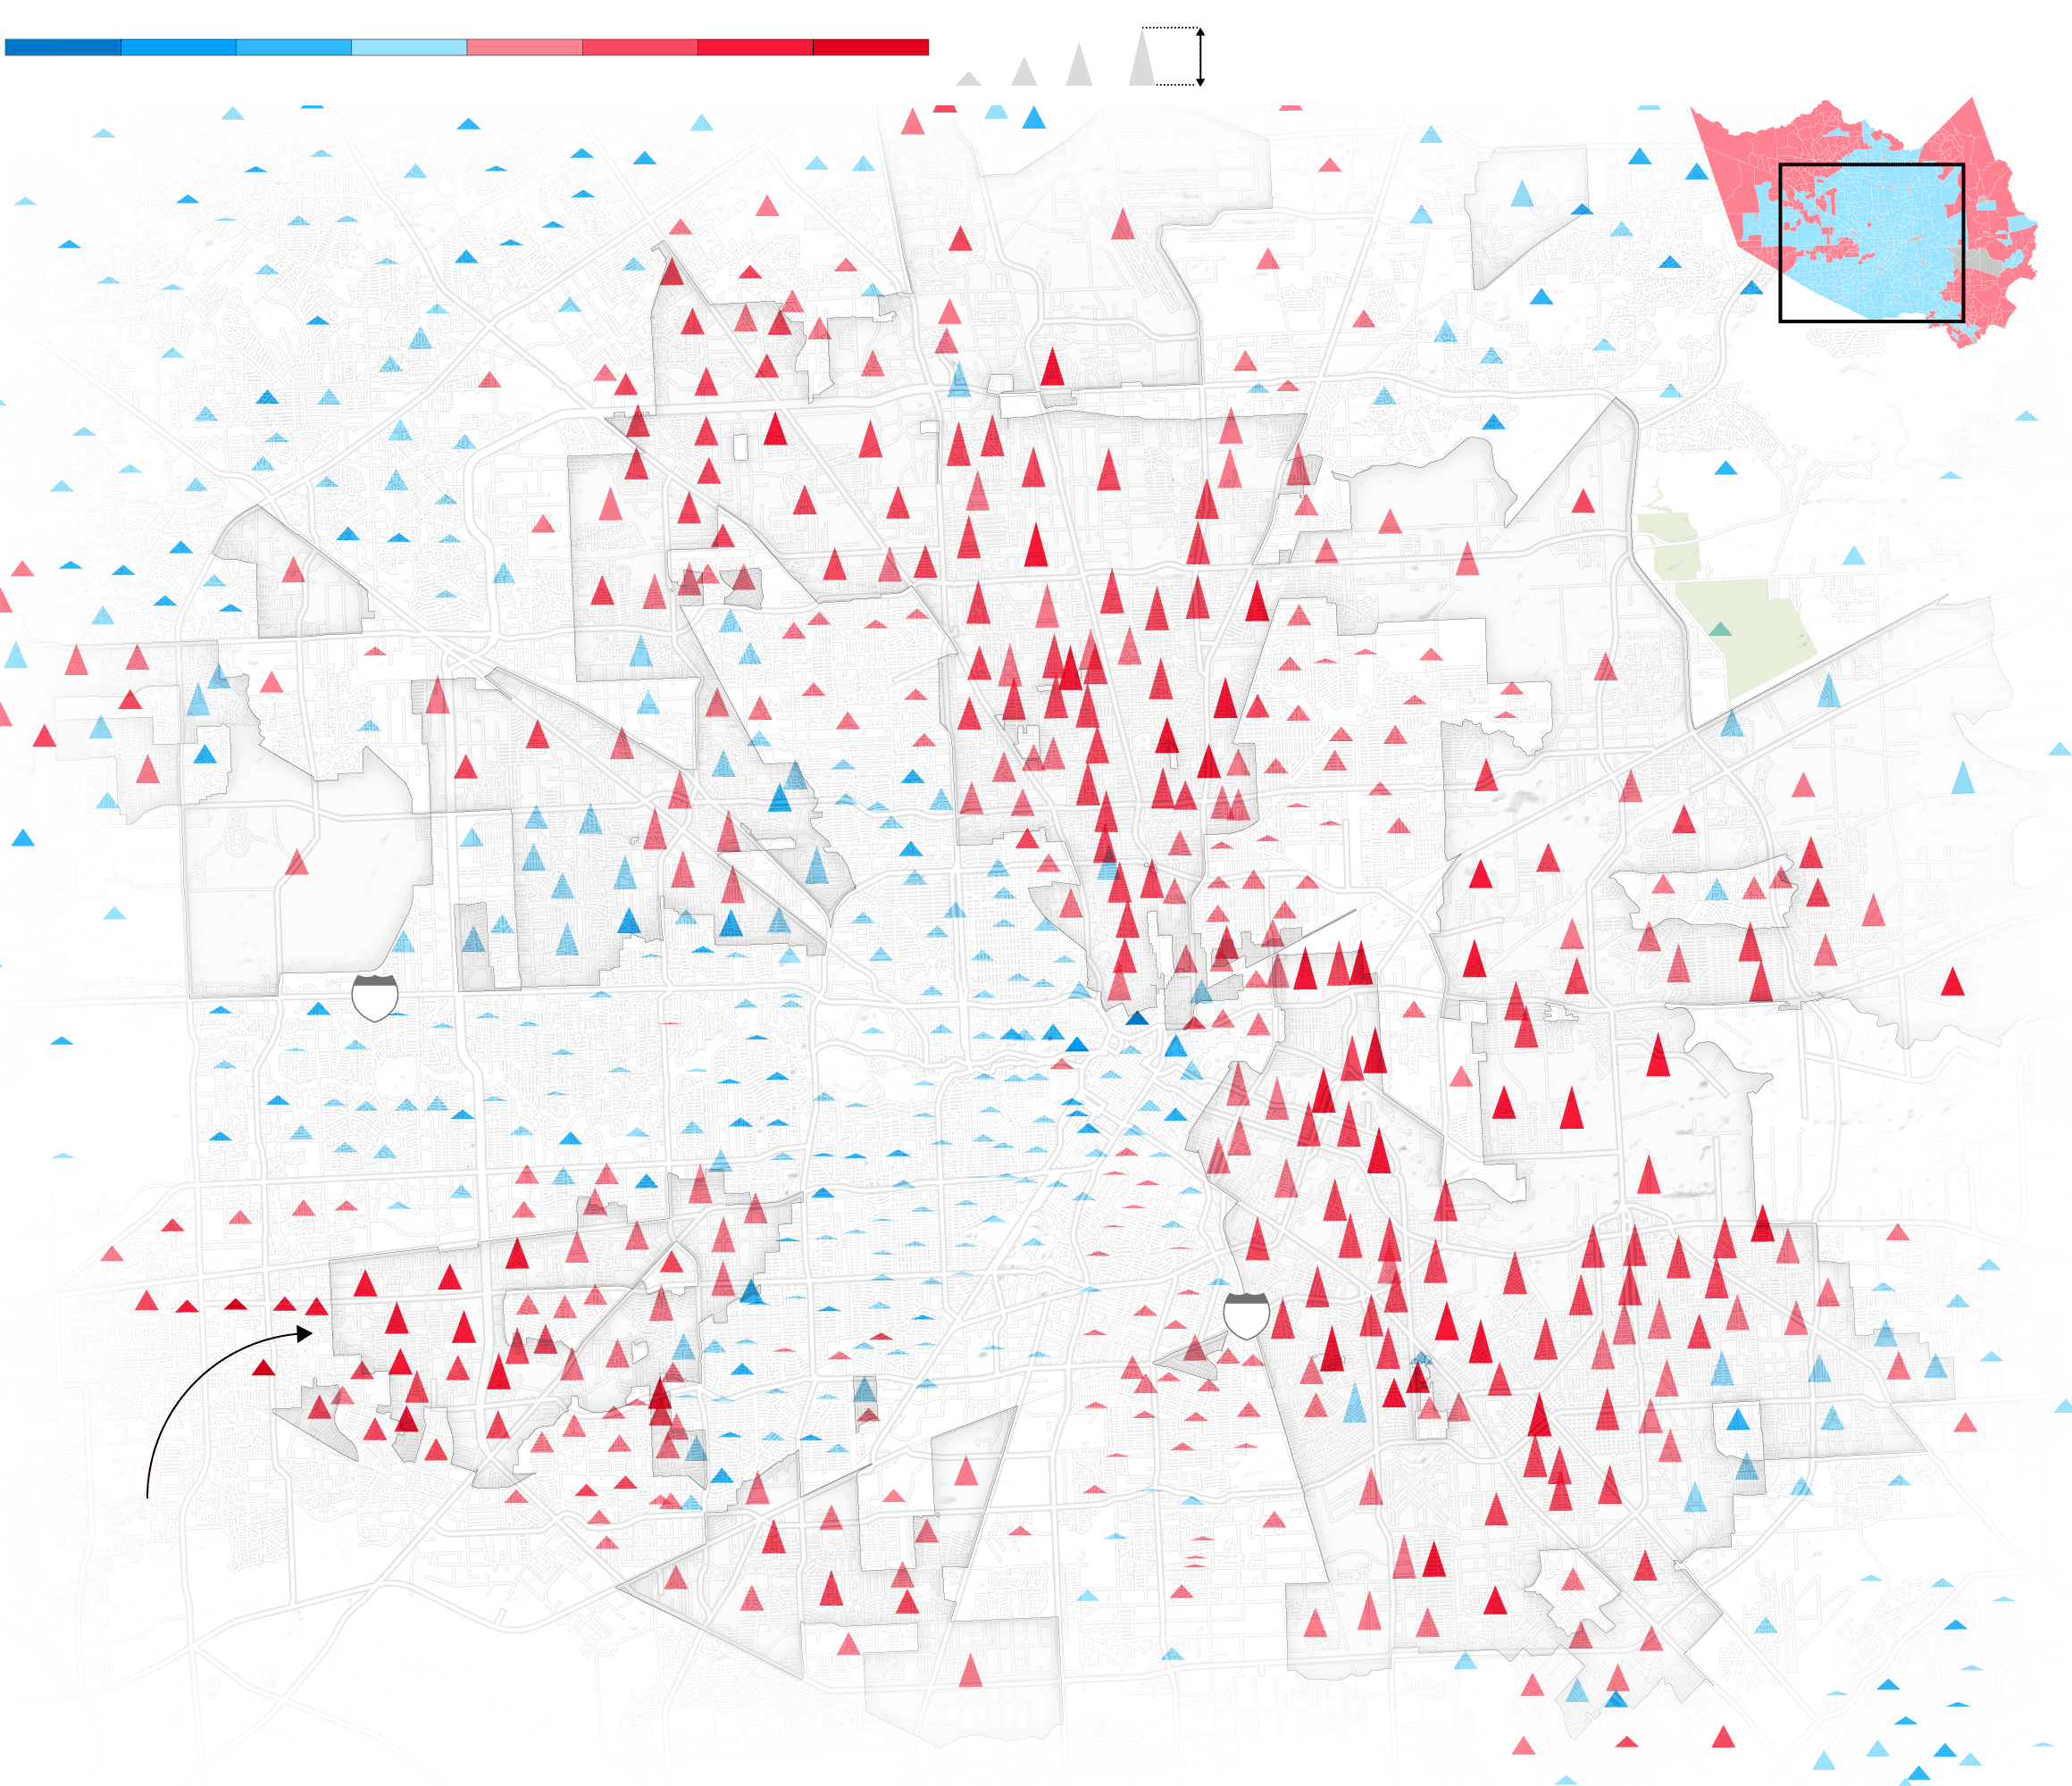
In 2020, Biden won Harris County in Texas with 56% of the vote. He won 279 of 299 majority-Hispanic precincts in the county, but there was a net shift to Trump in 86% of them.
The height of the peaks show the Hispanic share of the population in that precinct
Highlighted precincts are those where Hispanics are a majority of the population
Peaks are shaded blue or red depending on how much the 2020 vote shifted toward Democrats or Republicans compared to 2016
The height of the peaks show the Hispanic share of the
population in that precinct
Highlighted precincts are those where Hispanics are a
majority of the population
Peaks are shaded blue or red depending on how much
the 2020 vote shifted toward Democrats or Republicans
compared to 2016
The height of the peaks show the
Hispanic share of the population
in that precinct
Highlighted precincts are those
where Hispanics are a majority of
the population
Peaks are shaded blue or red
depending on how much the
2020 vote shifted toward
Democrats or Republicans
compared to 2016
Net percentage-point change in two-party vote from 2016
25
50
75
100%
2020 Presidential
Result
Hispanic share
of population
+30 more Dem.
20
10
0
10
20
+30 more Rep.
Area of
detail
Harris County
Harris county
Aldine
Texas
Sheldon
Channelview
10
Houston
Bellaire
610
Alief
Pasadena
Trump increased his vote share
14 to 17 points in some precincts in and
around the Alief neighborhood,
which also has a significant
Black and Asian population
Net percentage-point change in two-party vote from 2016
25
50
75
100%
2020 Presidential
Result
Hispanic share
of population
+30
more Dem.
20
10
0
10
20
+30
more Rep.
Area of
detail
Harris county
Harris County
Aldine
Texas
Channelview
Houston
10
610
Alief
Trump increased his vote share
14 to 17 points in some precincts in and
around the Alief neighborhood,
which also has a significant
Black and Asian population
Net percentage-point change in two-party vote from 2016
2020 Presidential
Result
+30
more Dem.
20
10
0
10
20
+30
more Rep.
Area of
detail
25
50
75
100%
Hispanic share
of population
Harris county
Harris County
Texas
Aldine
Houston
Alief
Trump increased his vote share
14 to 17 points in some precincts in and
around the Alief neighborhood,
which also has a significant
Black and Asian population
Net percentage-point change in two-party vote from 2016
+30
more Dem.
20
10
0
10
20
+30
more Rep.
25
50
75
100
2020 Presidential
Result
Hispanic share
of population
Area of
detail
Harris County
Harris county
Texas
Houston
Alief
Trump increased his vote share
14 to 17 points in some precincts in and
around the Alief neighborhood,
which also has a significant
Black and Asian population
Net percentage-point change in two-party
vote from 2016
+30
more Dem.
20
10
0
10
20
+30
more Rep.
25
50
75
100%
2020 Presidential
Result
Hispanic share
of population
Area of
detail
Harris county
Texas
Houston
Alief
Trump increased his vote share
14 to 17 points in some precincts in and
around the Alief neighborhood,
which also has a significant
Black and Asian population
And then there is the matter of the Democrats’ tepid efforts to reach out to voters in these communities. This was a theme to a varying degree in all three counties. In Harris, the lament was the loudest.
“Organizers from the region are furious with the Democrats because they were totally abandoned and denied support,” said Andres Bernal, a policy adviser who’s worked with Democratic candidates in Texas. “They have to stop taking it for granted that it’s just going to be Democrats forever.”
Sources: Harris County Clerk’s Office, Maricopa County Elections Department, Miami-Dade County Elections Department and U.S. Census Bureau (2010 Decennial Census and 2018 American Community Survey 5-year data)
Methodology
This analysis used precincts where at least 100 votes were cast in both the 2016 and 2020 Presidential elections. Precinct-level results were sourced from county election departments and used to calculate party vote share, margin of victory, and net vote shift. Data is final as of Nov. 19 and includes certified results for Harris County and Miami-Dade County. Where precinct boundaries changed between elections, precincts were remapped as necessary for comparability. This process included merging precincts in Miami-Dade County. In Maricopa County, 2020 precincts were mapped onto 2016 precincts where at least 90% of the population were shared. Harris County precincts did not change between elections.
Demographic analysis was calculated by mapping 2010 Census blocks onto precincts using crosswalk files and spatial joins (where a precinct covered at least 90% of a block’s area). This process resolved more than 97% of 2020 precincts. Block group-level data from the 2018 5-year American Community Survey was used to calculate the Hispanic share of each precinct. Tract-level data was used to determine distribution by country of origin. These values were calculated for each precinct based on the block group and tract segments corresponding to it and weighted using 2010 population data.