Coronavirus Lockdown Has Emptied London’s Bustling Streets
Just two months ago, the U.K. was yet to see its first case of Covid-19. Now with nearly 20,000 cases and more than 1,200 deaths, Britain has transformed under an unprecedented national shutdown.
Gradually then suddenly, the government has implemented restrictions on the public in an attempt to halt the spread of the virus, including the closure of most schools and all restaurants and pubs. Under the strongest measures announced on March 23, Britons may only leave their homes for food, health reasons or work, if unable to work from home.
The U.K. government was slower to enact measures than its neighbors, with Italy, Spain and France announcing their lockdowns on March 9, March 15 and March 16. On Friday, Prime Minister Boris Johnson announced he tested positive for coronavirus and is self-isolating in Downing Street.
Central London has emptied, with some activity still in more populated suburban areas, as seen in these images from Transport for London traffic monitoring cameras captured each day at noon.
Transport for London has closed 40 underground stations and is operating a 15 minute service on some lines, while urging people not to travel. Buses are also running with reduced services.
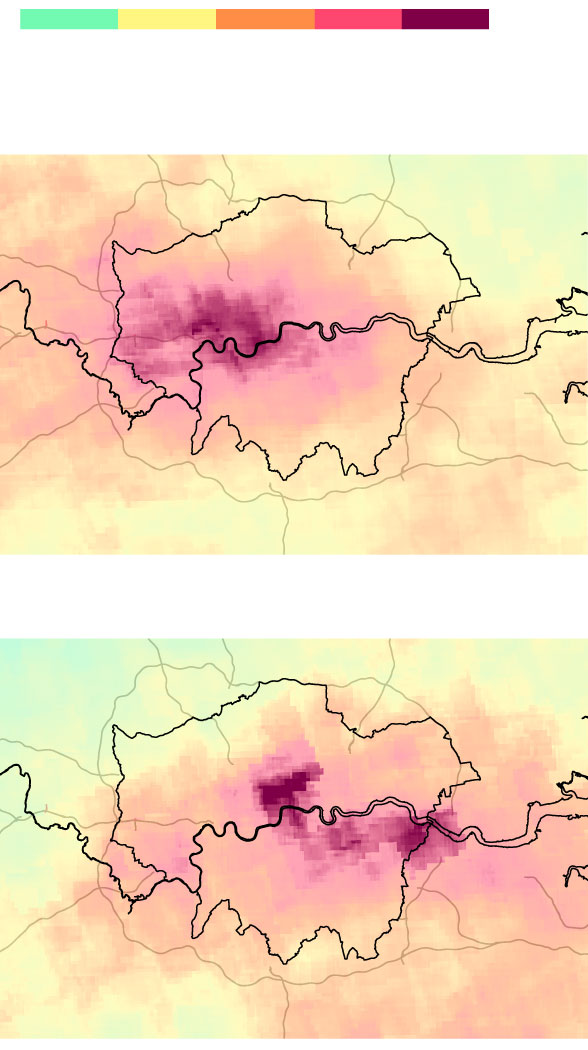
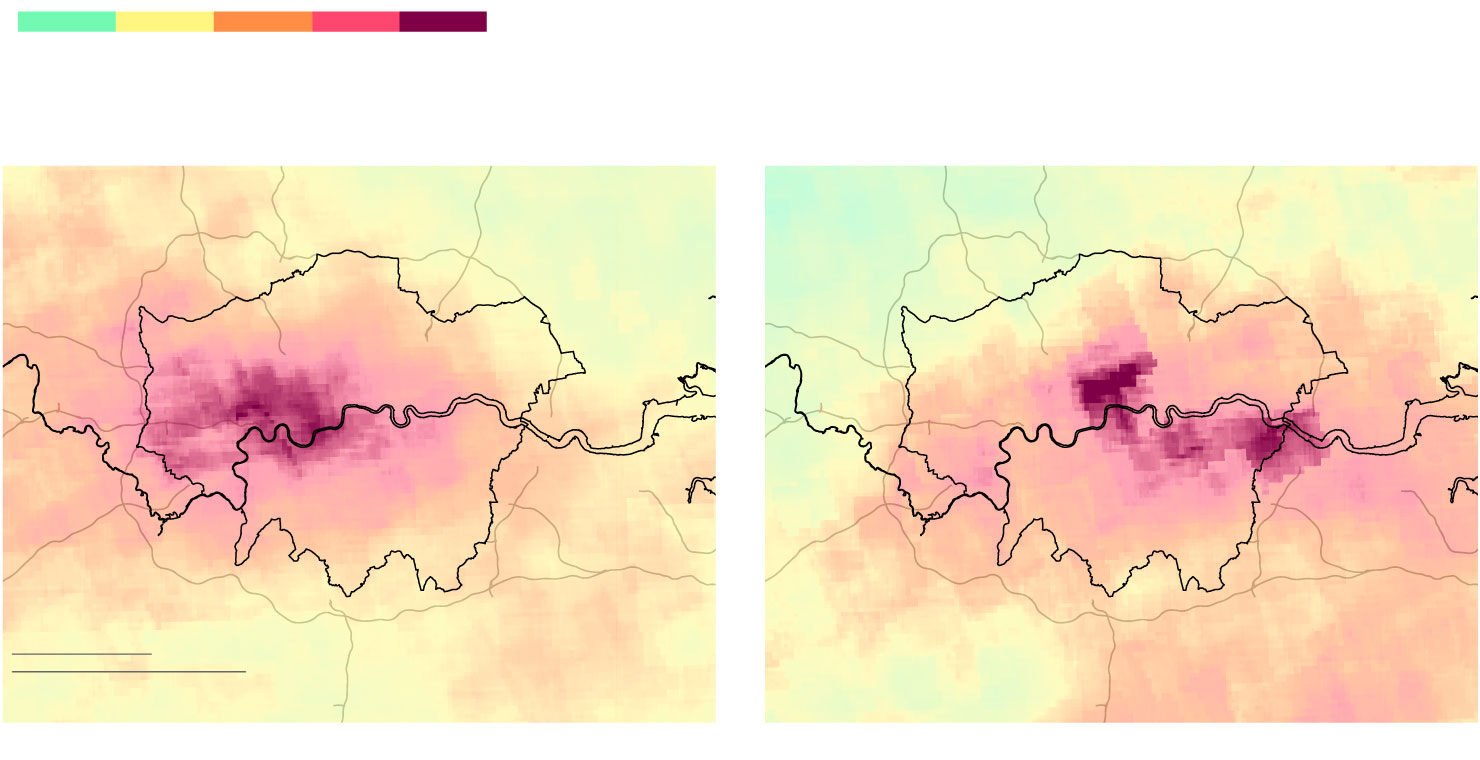
The slowing of London’s traffic may already be visible in the quality of London’s air. “Air quality has started to improve in many U.K. cities, mirroring what has been seen in other countries that have restricted travel and levels of outdoor activity,” says Alastair Lewis, Professor of Atmospheric Chemistry at the University of York. “This is primarily a consequence of lower traffic volumes, and some of the most clear reductions have been in nitrogen dioxide, which comes primarily from vehicle exhaust.”
The maps below show average nitrogen dioxide concentrations from Copernicus’ Tropomi satellite for the month of March compared with the same period in 2019.
London’s Air
50
100
125
150
175 mol/m2
March 1–29, 2020
London
March 1–29, 2019
50
100
125
150
175 mol/m2
March 1–29, 2020
March 1–29, 2019
London
20 km
20 miles

The restrictions will be “under constant review,” said Johnson last Monday. “We will look again in three weeks, and relax them if the evidence shows we are able to,” he said. “I urge you at this moment of national emergency to stay at home, protect our NHS and save lives.”