Trump-Xi Summit at G-20 Could Save the World $1.2 Trillion
The world economy runs the risk of having to foot a $1.2 trillion bill if the U.S.-China trade war escalates.
That’s the calculation by Bloomberg Economics and the challenge confronting U.S. President Donald Trump and his Chinese counterpart Xi Jinping as they prepare to meet at the two-day Group of 20 summit in Osaka, which begins on June 28.
Watching closely will be the countries’ other trading partners, especially those in the Asian supply chain, who are sharing the pain even though a few have already found ways to shift production and benefit from China’s loss.
Global Cost of a Trade War
A replay of the Trump-Xi meeting at the G-20 in Buenos Aires at the end of 2018 could mean an easing of tensions. Tariffs could stay on hold, and Chinese tech-giant Huawei could gain some breathing space from U.S. sanctions.
By contrast, a misstep could trigger 25% tariffs on all trade between the world’s two largest economies. Such an event, coupled with a major market drop, could take a $1.2 trillion bite out of global GDP by the end of 2021, based on calculations by Bloomberg economist Dan Hanson. While not enough on its own to trigger a recession, this would push growth back to the lowest level since the great financial crisis.
Dell Technologies, HP Inc., Intel Corp. and Microsoft Corp. have all opposed the proposed tariffs on laptop computers and tablets, arguing the duties would increase prices for consumers as well as hurt small businesses that rely on them and manufacturers that make them.
Rick Muskat, president and chief operating officer of the New York-based Deer Stags Concepts shoe company, recently warned a group of U.S. trade officials he may have to fire some of his 35 employees or even close the company because his family-owned business can’t quickly move production out of China.
“I am incredibly concerned about the impact this duty could have on them,” Muskat told the panel about his employees.
Even if Trump and Xi stick to tariffs at existing levels, the damage to Chinese, U.S. and global growth is already significant. An analysis by Bloomberg economists Maeva Cousin and Tom Orlik shows that for the thousands of categories of Chinese goods that saw tariffs imposed from July 2018, U.S. imports from China were down 26% year-on-year in the first quarter of 2019.
Imports of Tariffed Goods Plunge
Besides putting pressure on China, tariffs may also be having another effect: Reducing the appeal of locating production in China.
“From China’s perspective, it’s not good,” Trump said in a recent TV appearance, “because all of these companies that are paying the tariff are moving to Vietnam and other countries in Asia.” In the first quarter of 2019, sales of product categories where China faces tariffs were up by 30% in Taiwan, more than 20% in Vietnam, and by 17% in South Korea relative to the same period last year—a sharp acceleration from the growth rates recorded in the few quarters before the tariffs were introduced. In dollar terms, however, the additional imports from 10 Asian supply-chain countries covered less than half of the drop in imports from China.
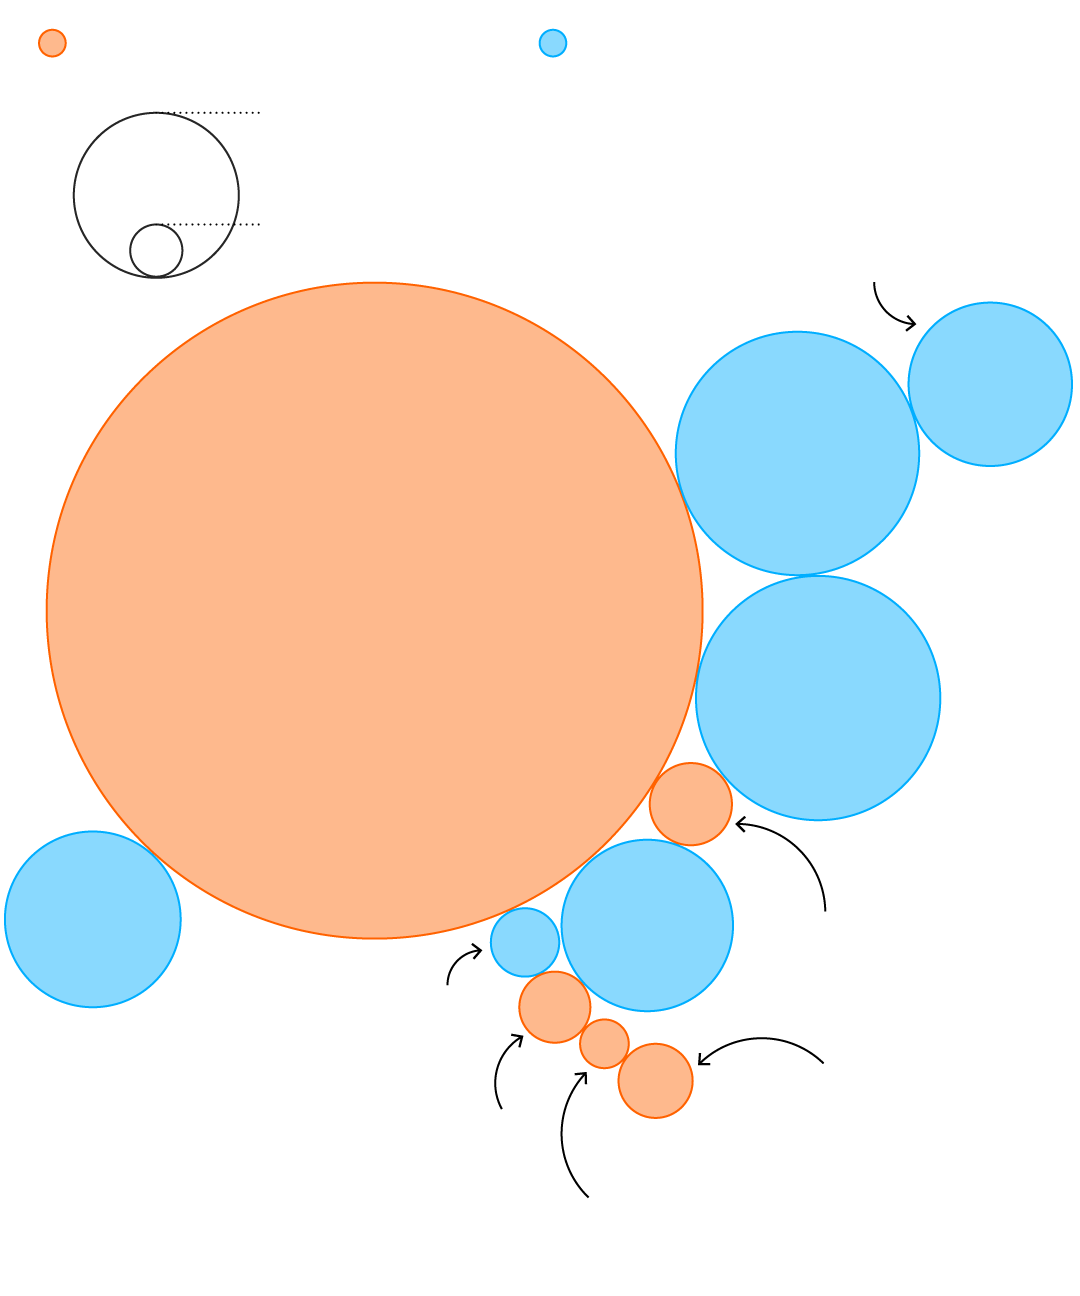
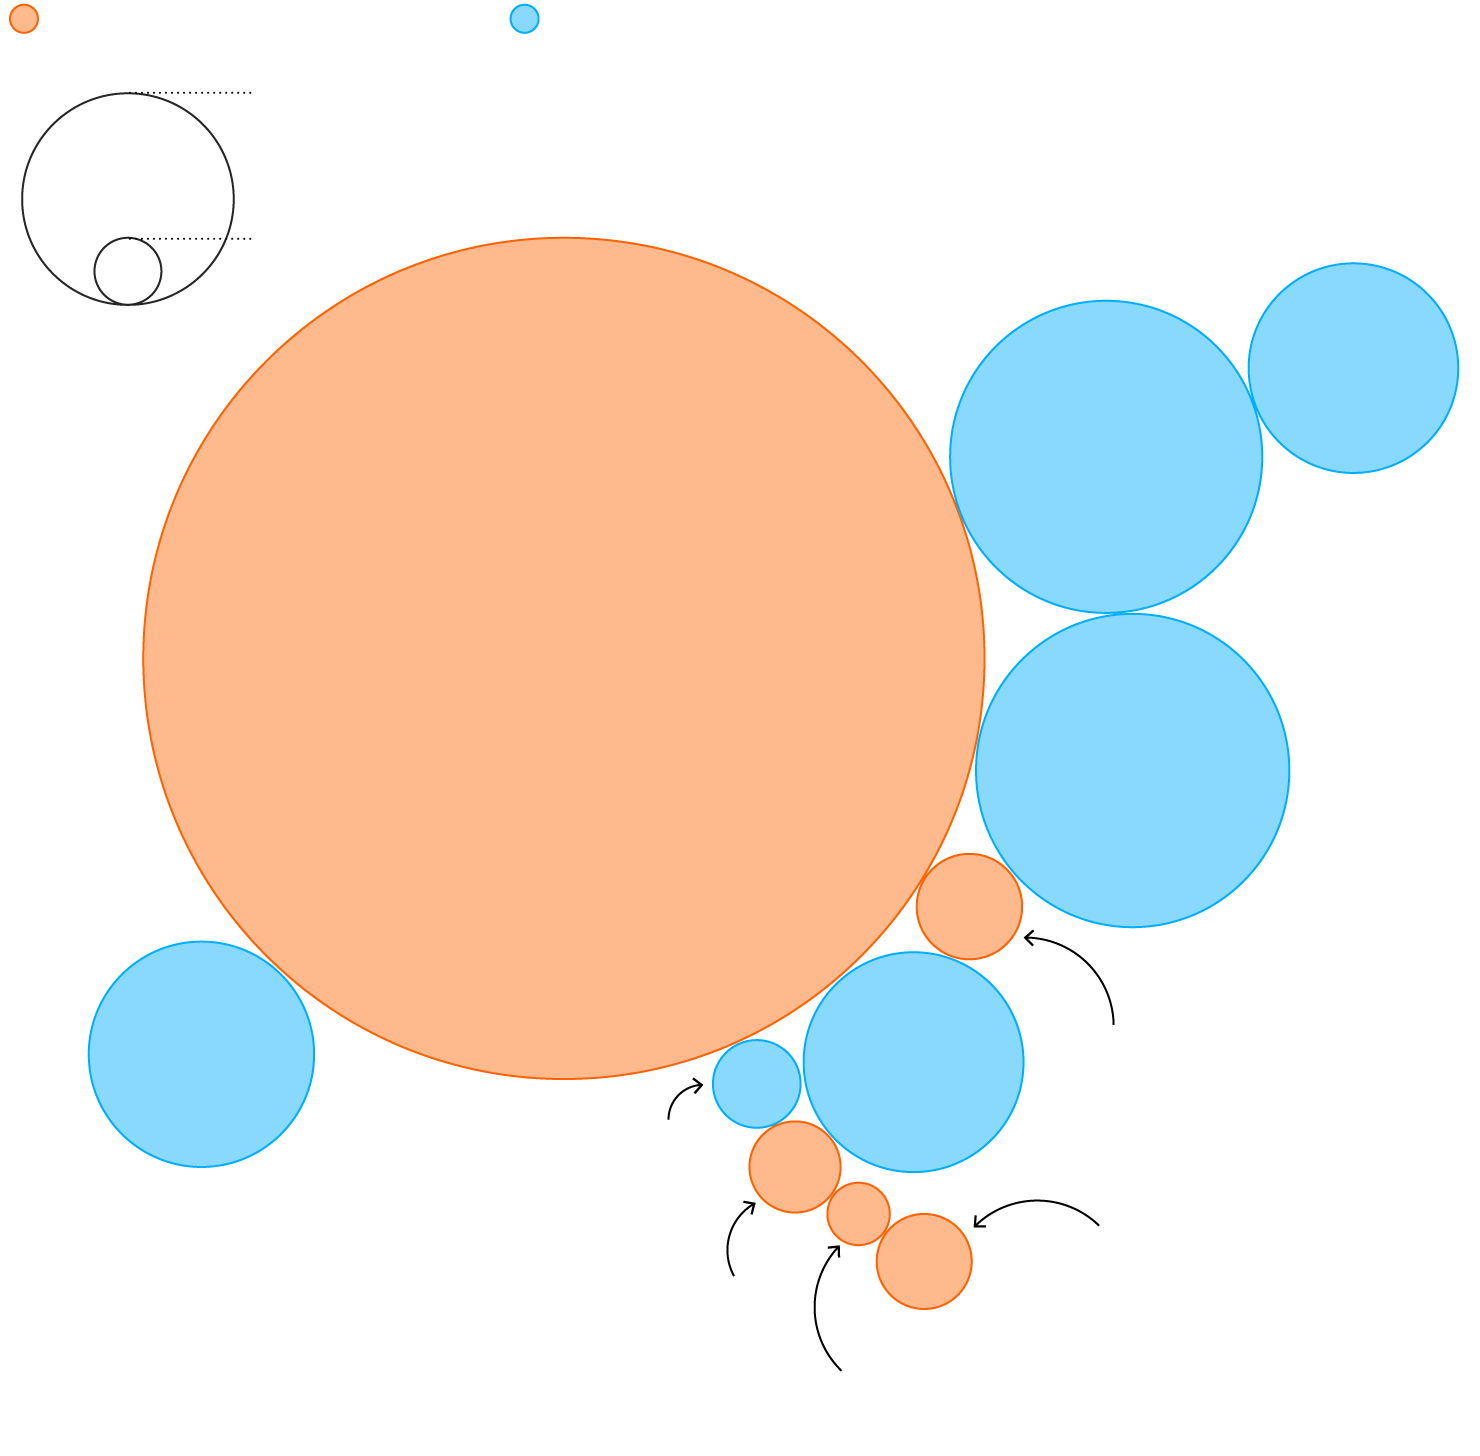
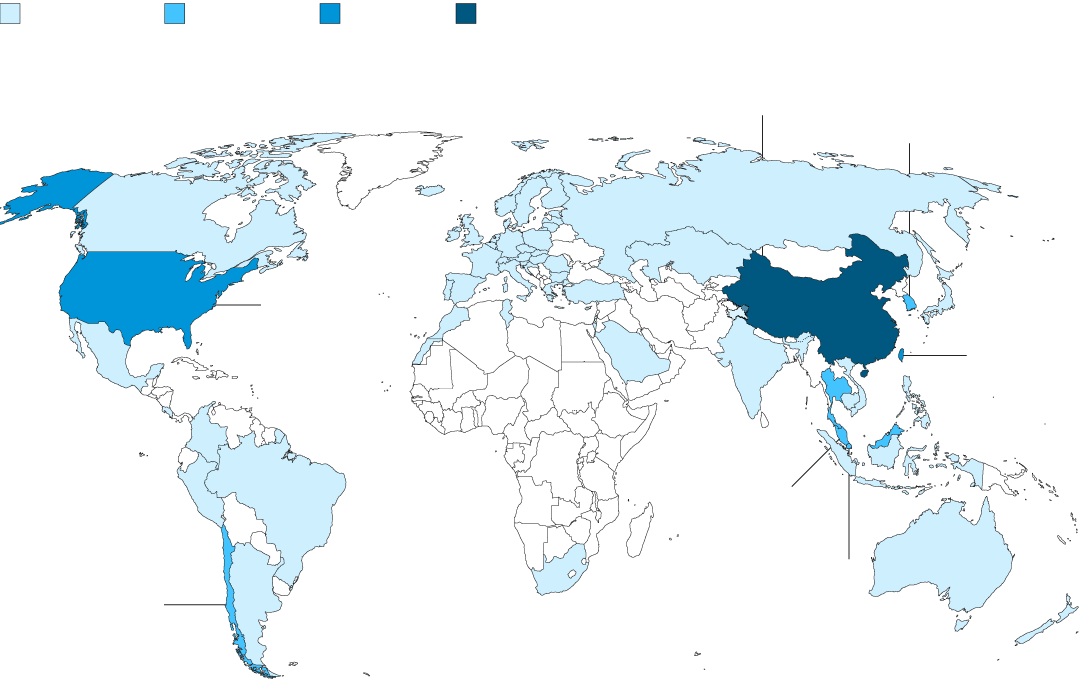
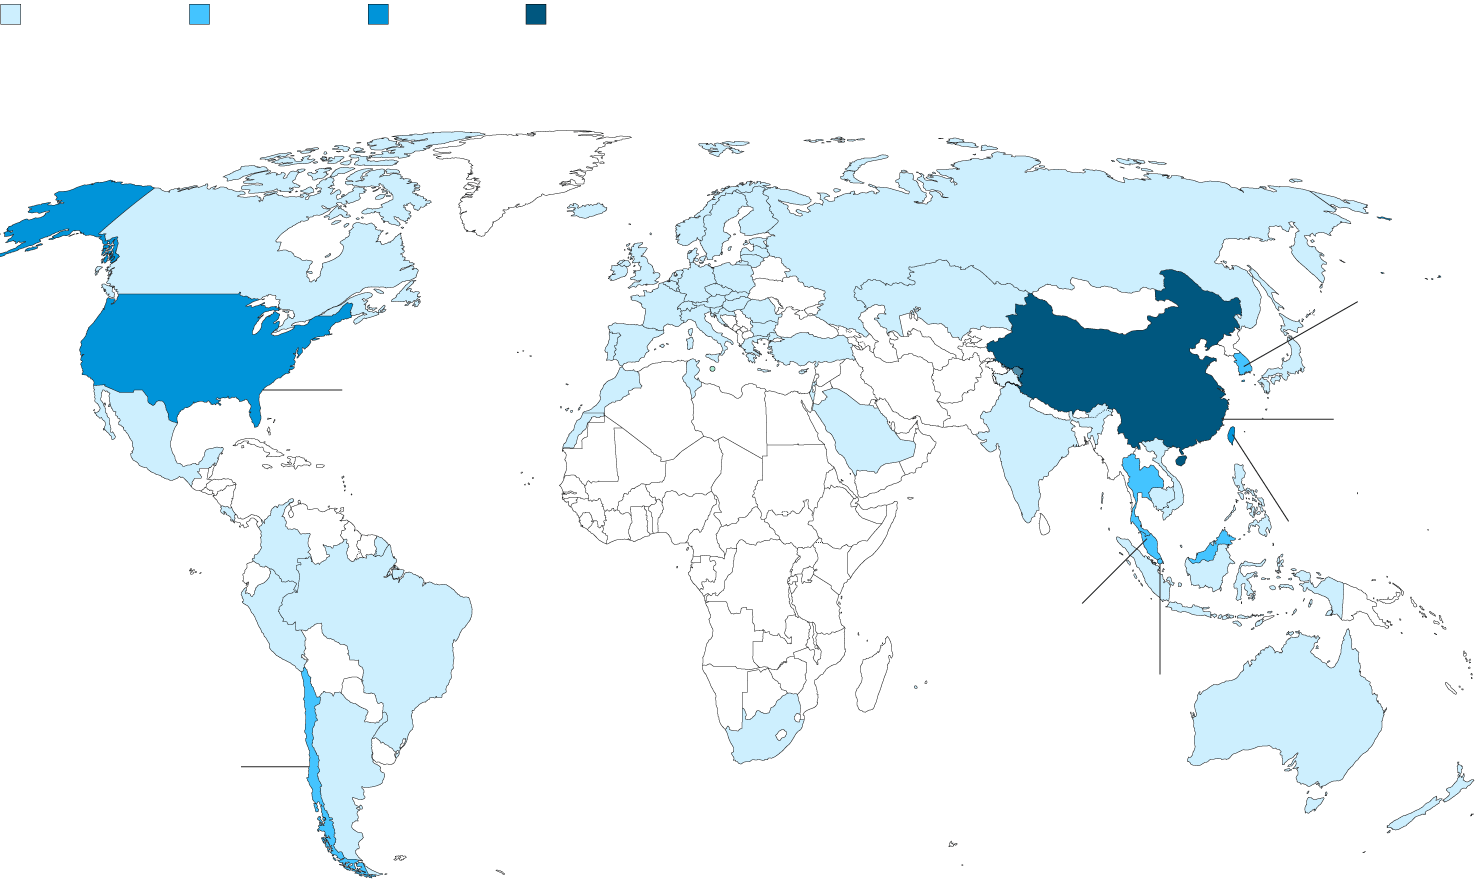
Exports Shift to China’s Neighbors
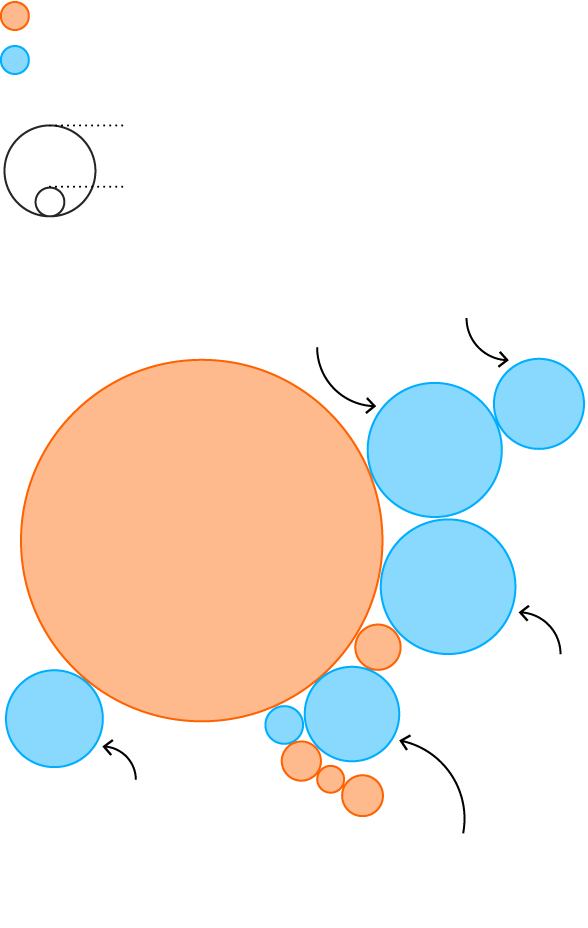
Drop in exports of tariffed goods
Rise in exports of tariffed goods
$1B change in imports
of tariffed goods
$100M
+$981M
+$2.2B
Japan
South Korea
–$15.8B
China
+$2.2B
Taiwan
+$1.1B
India
+$1.1B
Vietnam
Drop in exports of tariffed goods
Rise in exports of tariffed goods
$1B change in imports of tariffed goods
+$981M
$100M
Japan
+$2.2B
South Korea
–$15.8B
China
+$2.2B
Taiwan
+$1.1B
+$1.1B
–$248M
India
Vietnam
Hong Kong
+$172M
Thailand
–$202M
–$185M
Indonesia
Malaysia
–$87M
Singapore
Drop in exports of tariffed goods
Rise in exports of tariffed goods
$1B change in imports of tariffed goods
$100M
+$981M
Japan
+$2.2B
South Korea
–$15.8B
China
+$2.2B
Taiwan
+$1.1B
+$1.1B
–$248M
India
Vietnam
Hong Kong
+$172M
Thailand
-$202M
Indonesia
–$185M
Malaysia
–$87M
Singapore
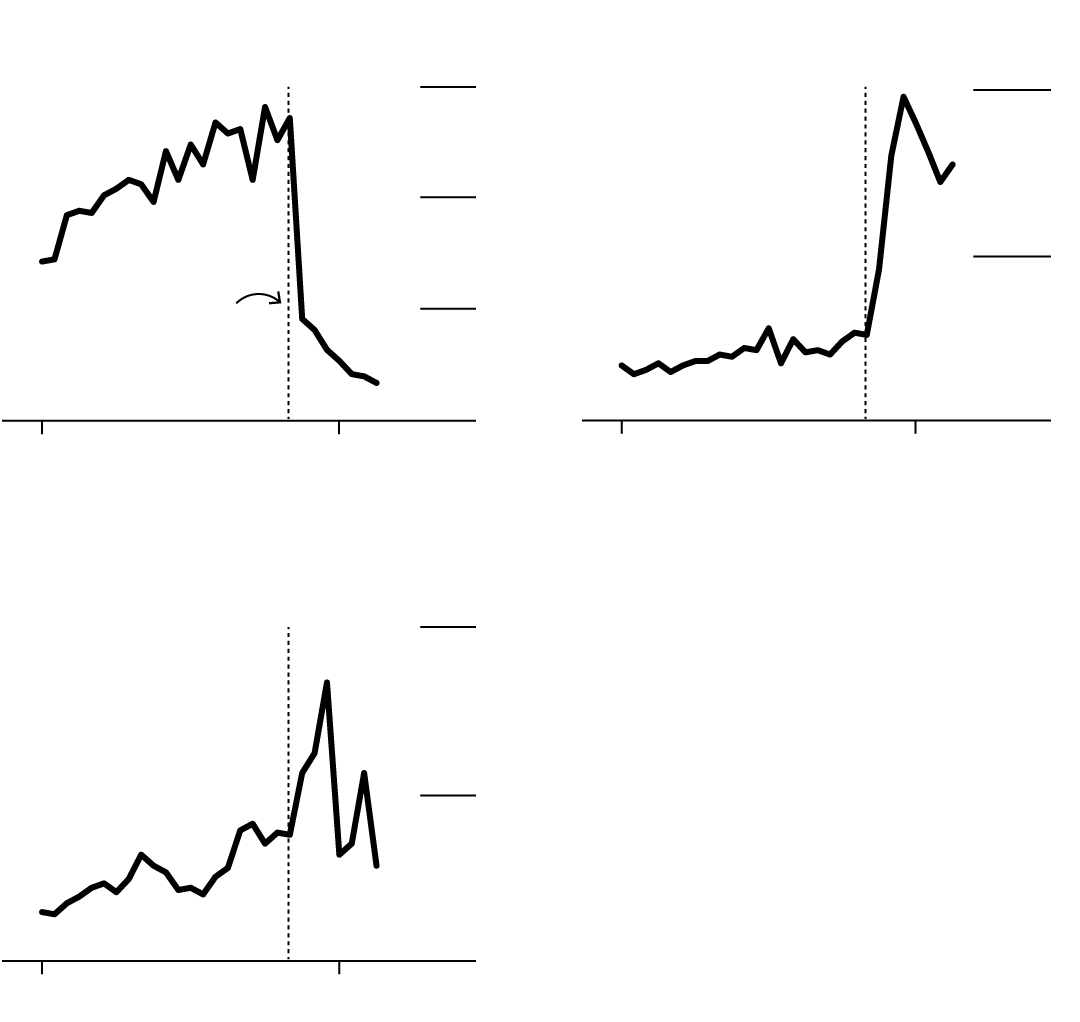
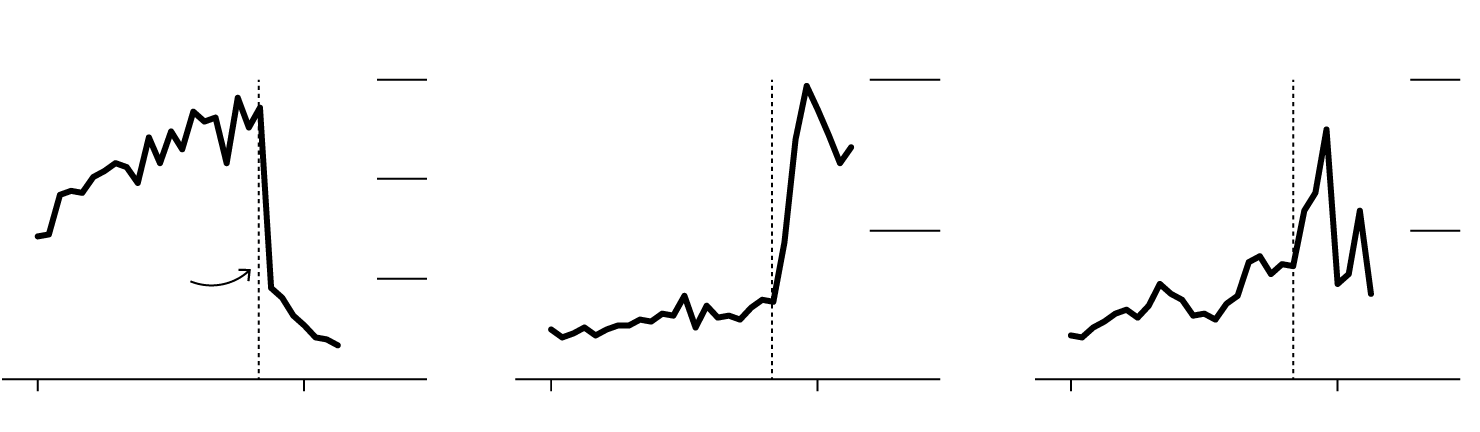
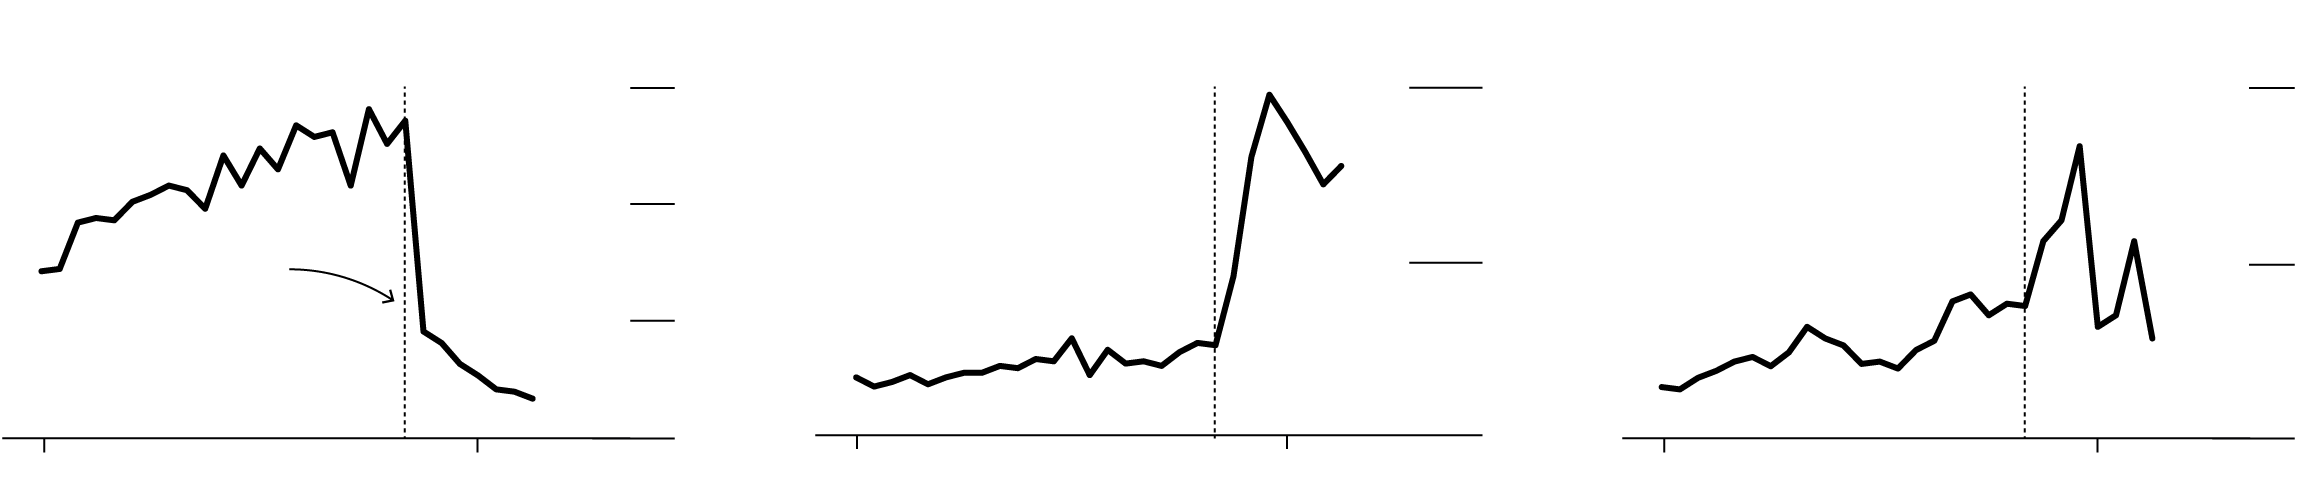
There is some evidence that supply chains are shifting. In the first quarter of 2019, Taiwan and South Korea saw sales of electronics components accelerate as final assembly relocated from China back home. In the same period, Vietnam saw sales of furniture rise—a sign that tariffs have accelerated the shift of low valued-added manufacturing out of China.
Giant Manufacturing Co. saw the writing on the wall early on. The world’s biggest bicycle maker started moving production of U.S.-bound orders out of its China facilities to its home base in Taiwan as soon as it heard Trump threaten tariff action in September.
Supply Chain Readjustments Across Southeast Asia
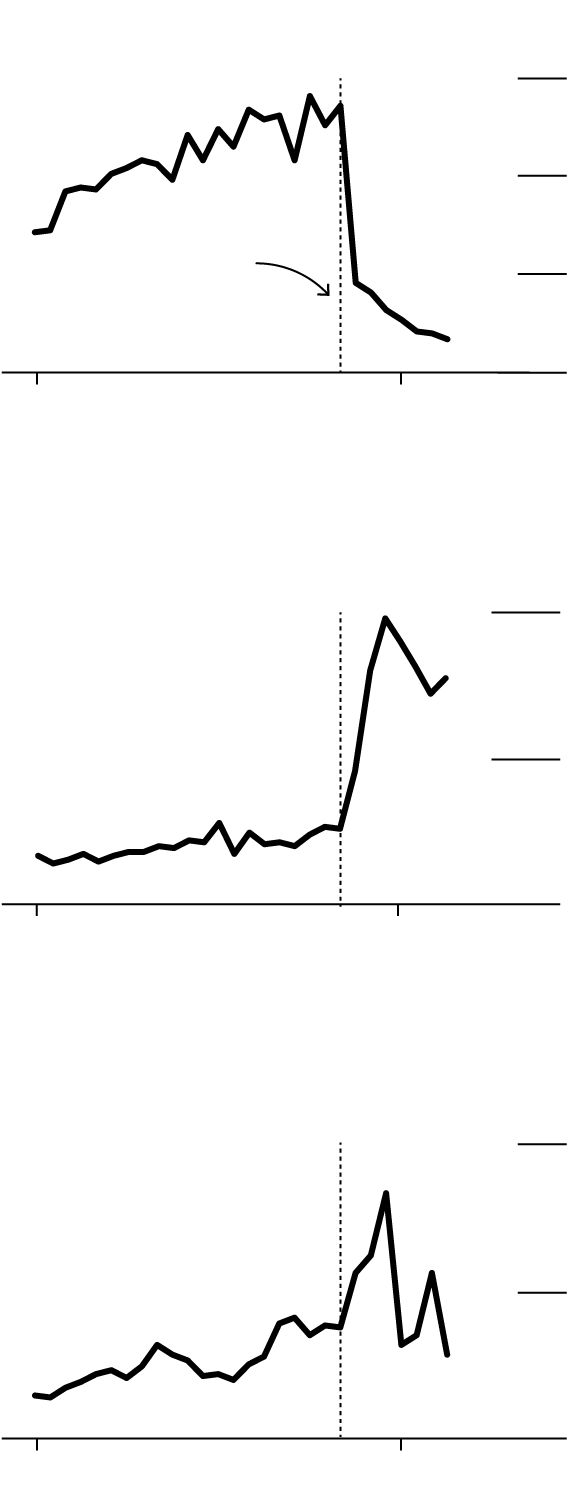
China
$1.5B
1.0
0.5
Tariffs go into effect
0
2017
2019
Taiwan
$400M
200
0
2017
2019
South Korea
$1.0B
0.5
0
2017
2019
China
Taiwan
$1.5B
$400M
1.0
200
0.5
Tariffs go into effect
0
0
2017
2019
2017
2019
South Korea
$1.0B
0.5
0
2017
2019
Taiwan
China
South Korea
$400M
$1.5B
$1.0B
1.0
200
0.5
0.5
Tariffs go into effect
0
0
0
2017
2019
2017
2019
2017
2019
Taiwan
China
South Korea
$400M
$1.5B
$1.0B
1.0
200
0.5
Tariffs go into effect
0.5
0
0
0
2017
2019
2017
2019
2017
2019
There’s evidence of other dodges and diversions. Imports of TVs from China, which are not subject to tariffs, have soared, while imports of tariffed TV parts have plummeted. A similar trend is evident in imports of tariffed and non-tariffed categories of liquid crystal displays—evidence of tariff dodging by reclassification of products, or buyers looking for near-substitutes to keep costs down.
Workarounds abound. The overwhelming impression, though, is that supply chains are struggling to adapt. In the tariffed categories, U.S. imports from other countries are up, but not by nearly enough to offset the drop in Chinese supply.
That’s not a huge surprise. Even relatively simple products like clothing must be produced to demanding specifications if they are to meet the needs of U.S. buyers. Workers need to be trained. Machines purchased. Supplies secured. Quality checked. None of that happens overnight.
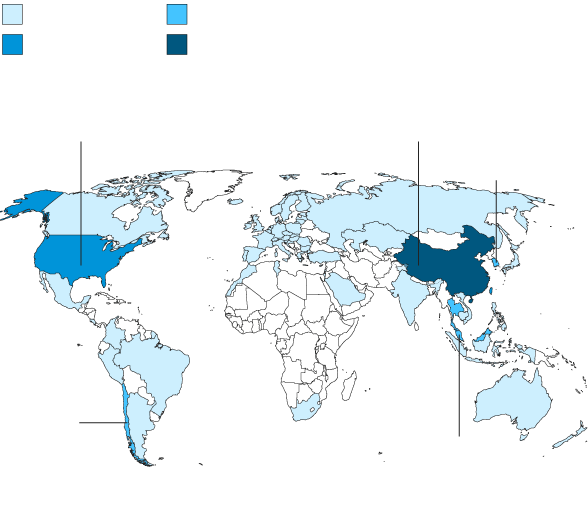
Modest gains for third countries in exports of the tariffed categories need to be considered in the wider context of the blow from the disruption and from weaker Chinese and U.S. demand. Bloomberg Economics used data from the Organization for Economic Cooperation and Development to determine which countries are most exposed to the risk.
China tops the list, with 3.9% of GDP tied up in trade with the U.S. The U.S., with a larger economy and smaller role for exports, is less exposed. Still, trade with China is equal to 1.3% of GDP. China’s nearby neighbors—economies like Taiwan, Korea, and Malaysia—face significant exposure through integration into Asia’s electronics supply chain.
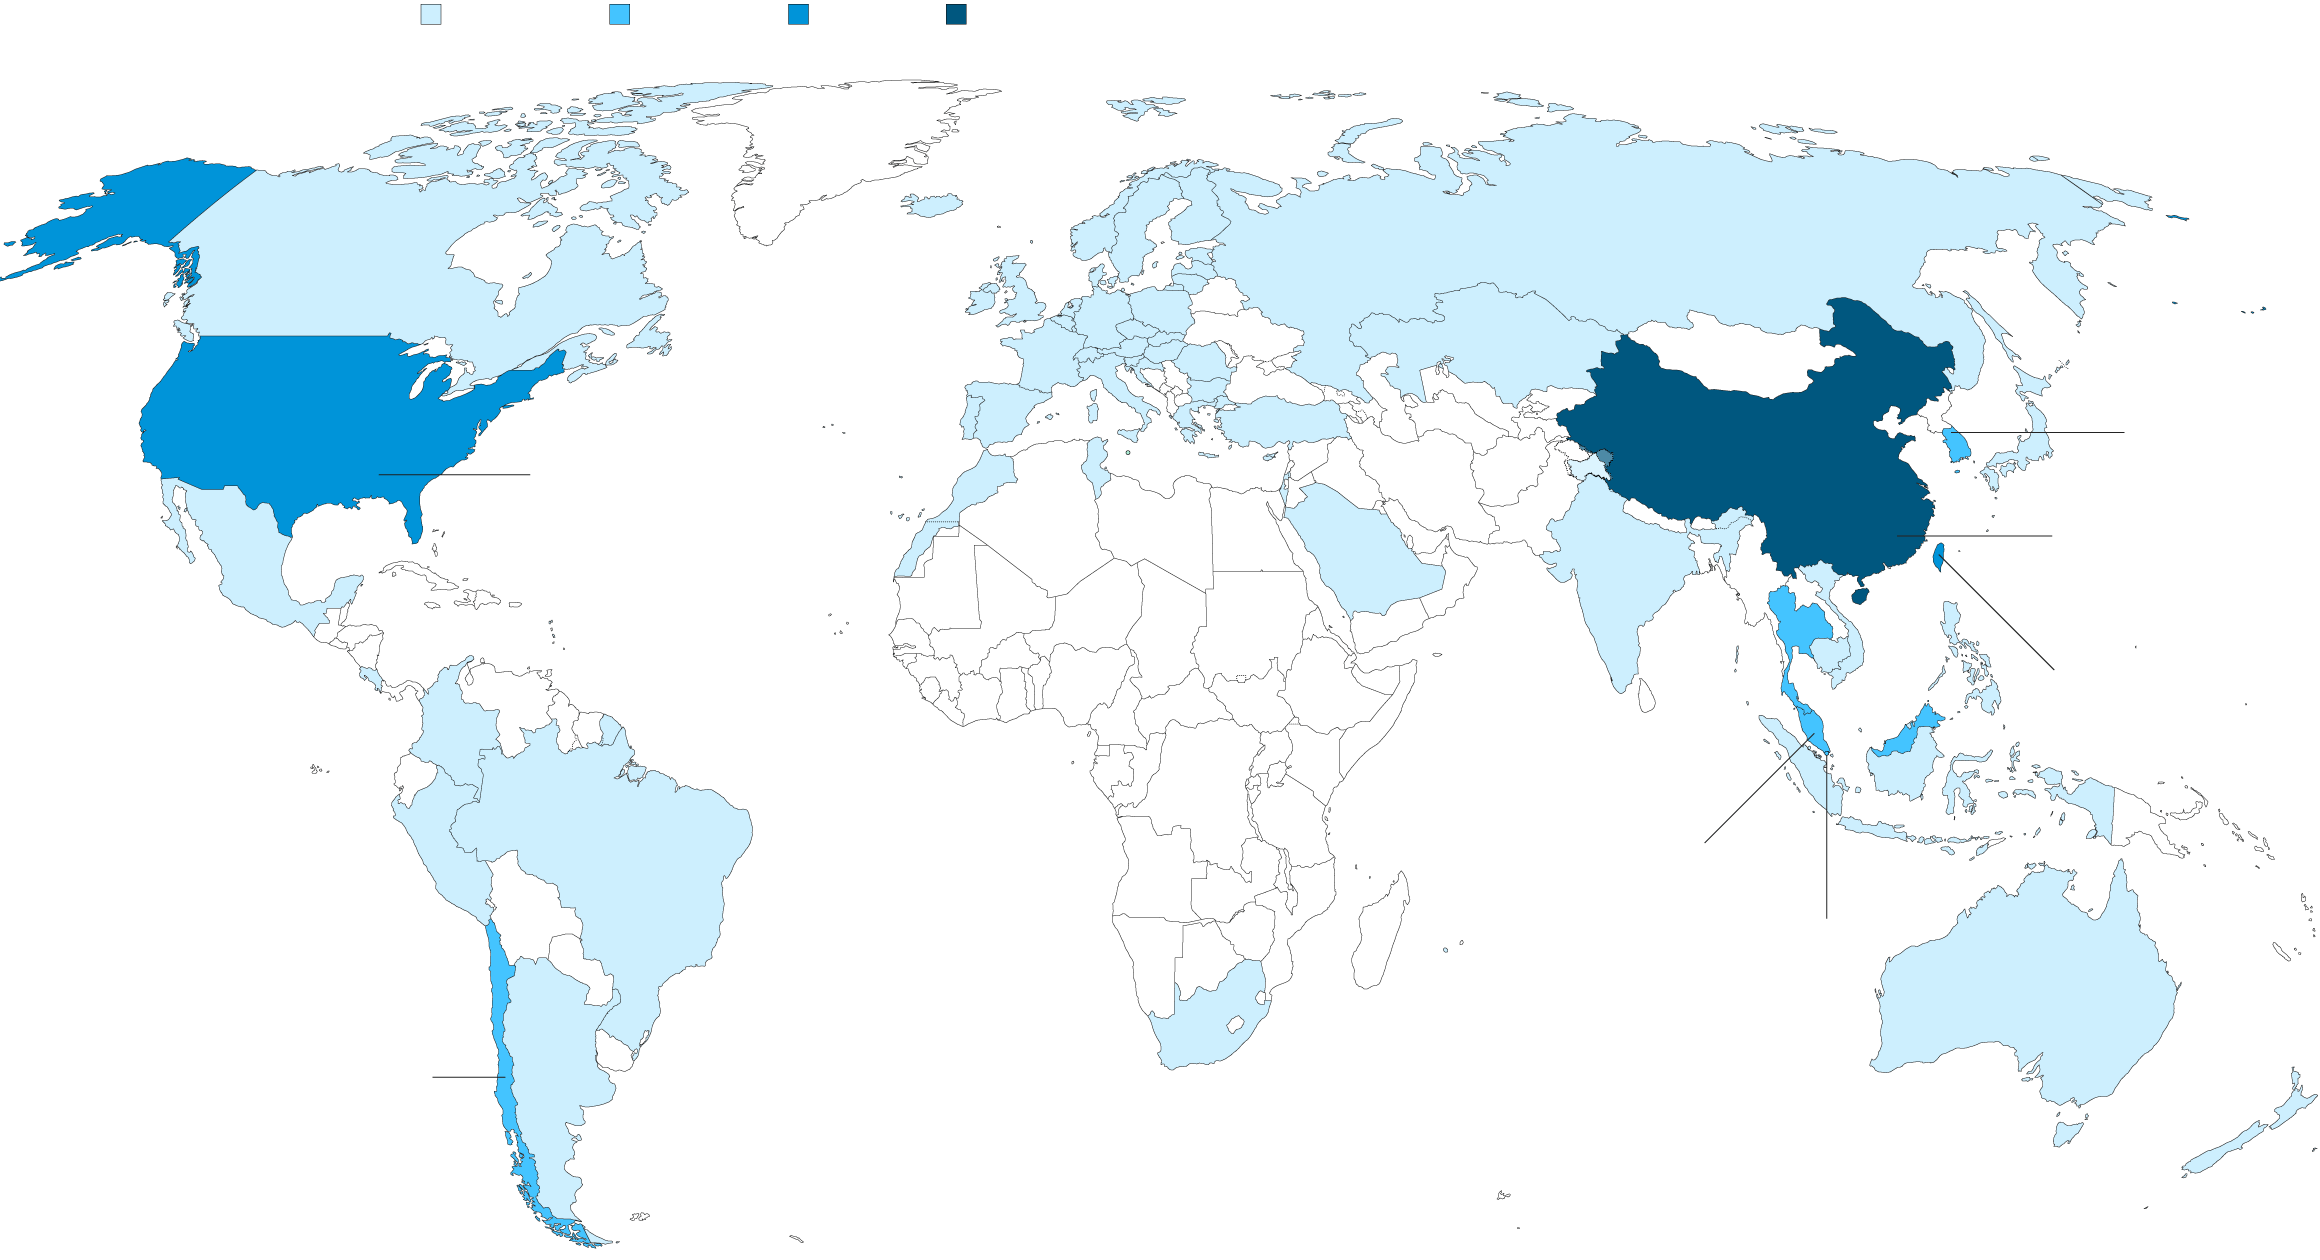
Share of GDP Exposed to China-U.S. Trade Flows
0–0.5%
0.5–1%
More than 2%
1–2%
1.3%
U.S.
3.9%
China
0.8%
South
Korea
0.5%
Chile
0.8%
Malaysia
0–0.5%
0.5–1%
1–2%
More than 2%
3.9%
China
0.8%
South
Korea
1.3%
U.S.
1.7%
Taiwan
0.8%
Malaysia
0.8%
Singapore
0.5%
Chile
0–0.5%
0.5–1%
1–2%
More than 2%
0.8%
South
Korea
1.3%
U.S.
3.9%
China
1.7%
Taiwan
0.8%
Malaysia
0.8%
Singapore
0.5%
Chile
0–0.5%
0.5–1%
1–2%
More than 2%
0.8%
South Korea
1.3%
U.S.
3.9%
China
1.7%
Taiwan
0.8%
Malaysia
0.8%
Singapore
0.5%
Chile
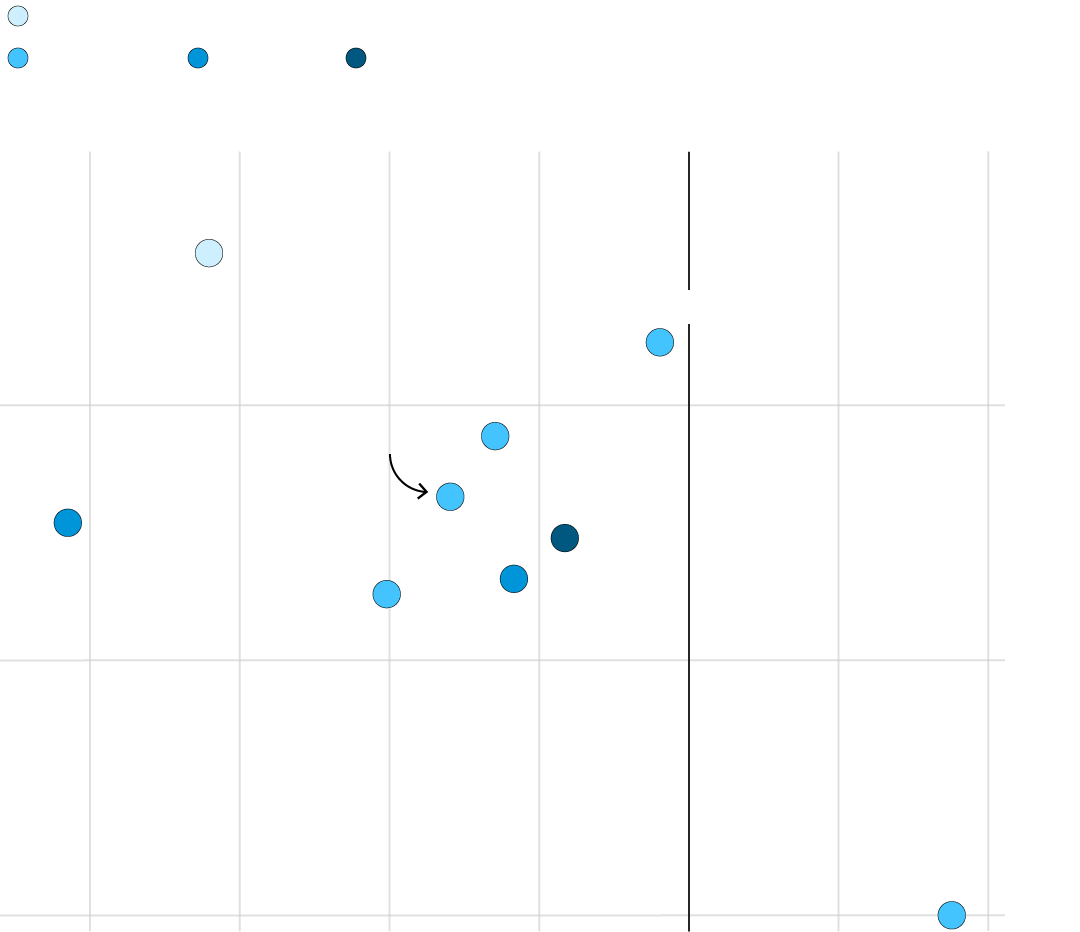
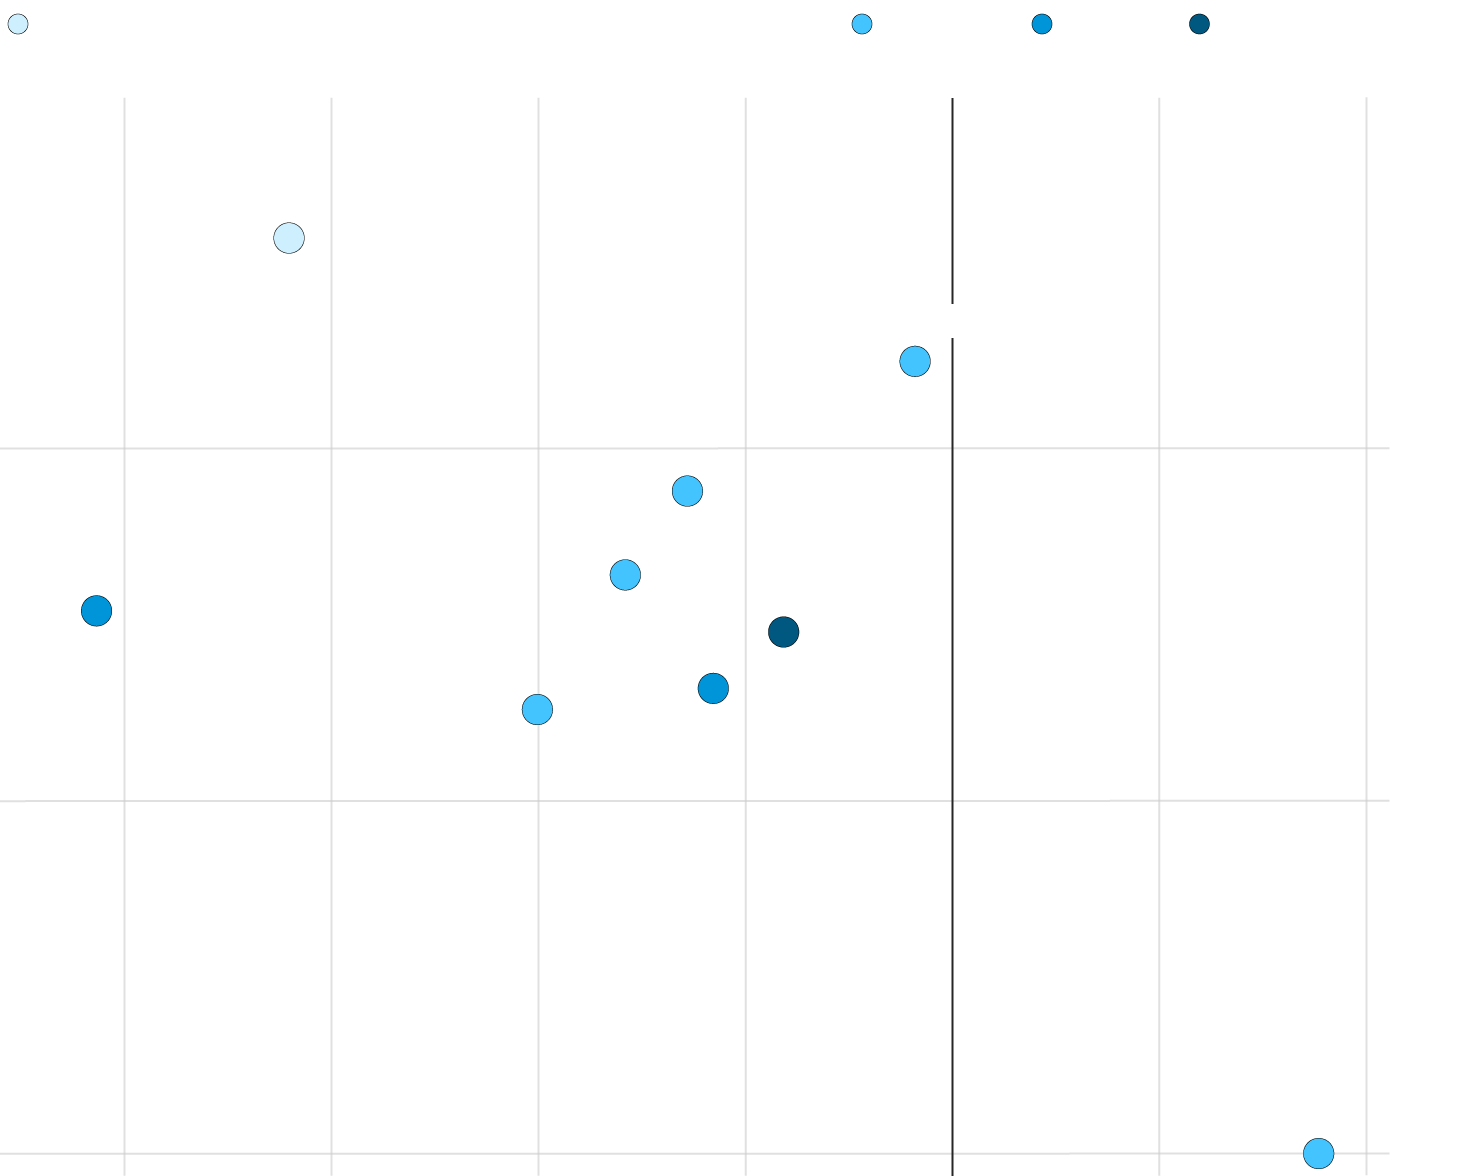
A troubling sign: Countries with high exposure to the trade war haven’t just seen exports drop, they’ve also seen capital spending and manufacturing employment suffer. Eight of the 10 most exposed economies have seen a drop in capital-spending growth since the third quarter of 2018. Lower capital spending doesn’t just dent growth today, it dents growth in the future as well.
Investment and Export Growth Take a Hit
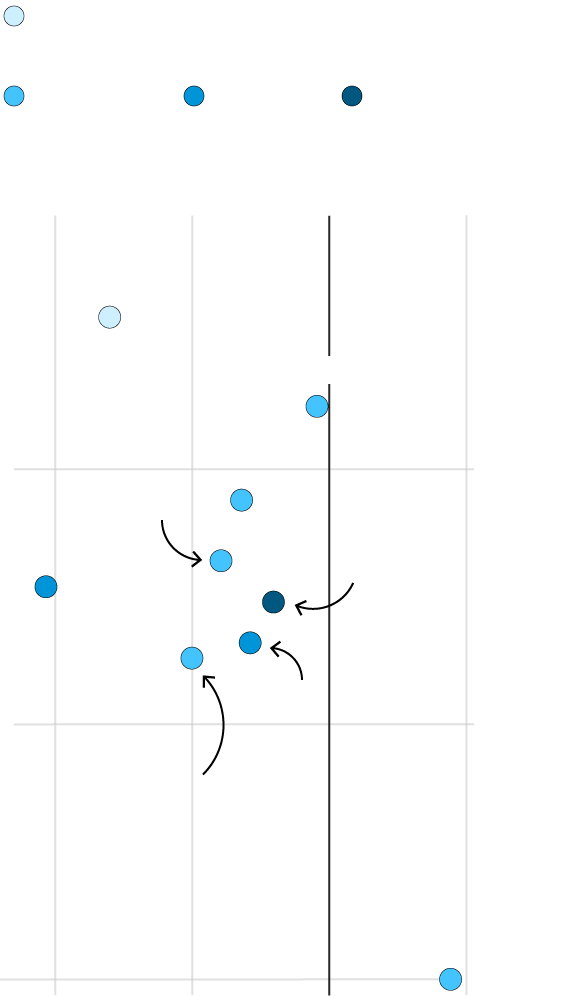
0–0.5% of country GDP
exposed to China-U.S. trade flows
0.5–1%
1–2%
More than 2%
← Drop in Investment Growth
–16pp
–8
0
8
Drop in
Export
Growth
↓
Philippines
Thailand
Chile
–5pp
Malaysia
Taiwan
China
U.S.
–10
South Korea
Singapore
–15
0–0.5% of country GDP exposed to China-U.S. trade flows
0.5–1%
1–2%
More than 2%
8
–16pp
–2
4
0
–8
–4
Drop in
Export
Growth
↓
← Drop in Investment Growth
Philippines
Thailand
Chile
–5pp
Malaysia
Taiwan
China
South Korea
U.S.
–10
Singapore
–15
0.5–1%
1–2%
More than 2%
0–0.5% of country GDP exposed to China-U.S. trade flows
8
–16pp
–12
–8
–4
4
0
← Drop in Investment Growth
Drop in
Export
Growth
↓
Philippines
Thailand
–5pp
Chile
Malaysia
Taiwan
China
U.S.
South Korea
–10
Singapore
–15
Whether it happens at the G-20, or at a later date, if Trump and Xi stay focused on commercial interests a deal remains there for the taking. China and the U.S. would both benefit from a more open Chinese market with stronger protections for intellectual property. This would be an unalloyed positive for the U.S. In China, reformers would see the short-term costs as a price worth paying for a long-term increase in efficiency.
If the negotiation expands out to consider the larger geopolitical issues, a deal looks harder to do. The incentives for Trump, who officially launched his reelection bid last week, to stand tough on China are rising. The lesson of past presidential elections is that bashing Beijing is a vote-winning strategy with few downsides. For Xi, too, domestic politics matter. A deal that looks like a one-sided win for the U.S. would not be acceptable in Beijing.
A Bloomberg survey of 35 economists agrees that some form of compromise is likely. There’s a 50% probability of an extended truce, with existing tariffs remaining in place while talks resume, according to the median estimate. A partial deal that actually winds down tariffs has a 20% probability. That compares to a one-in-four chance of no progress, leading to more U.S. tariffs applied and retaliatory China measures.