The last several decades have delivered major progress for women worldwide, with literacy, life expectancy and pay at or near historic highs. But huge disparities remain, especially in developing countries.
A Bloomberg News analysis of 10 important measures finds that over the past two decades some individual gender gaps have narrowed considerably, though most still persist. These are some of the ways in which the quality of life and opportunities for women are changing—and not always for the better.
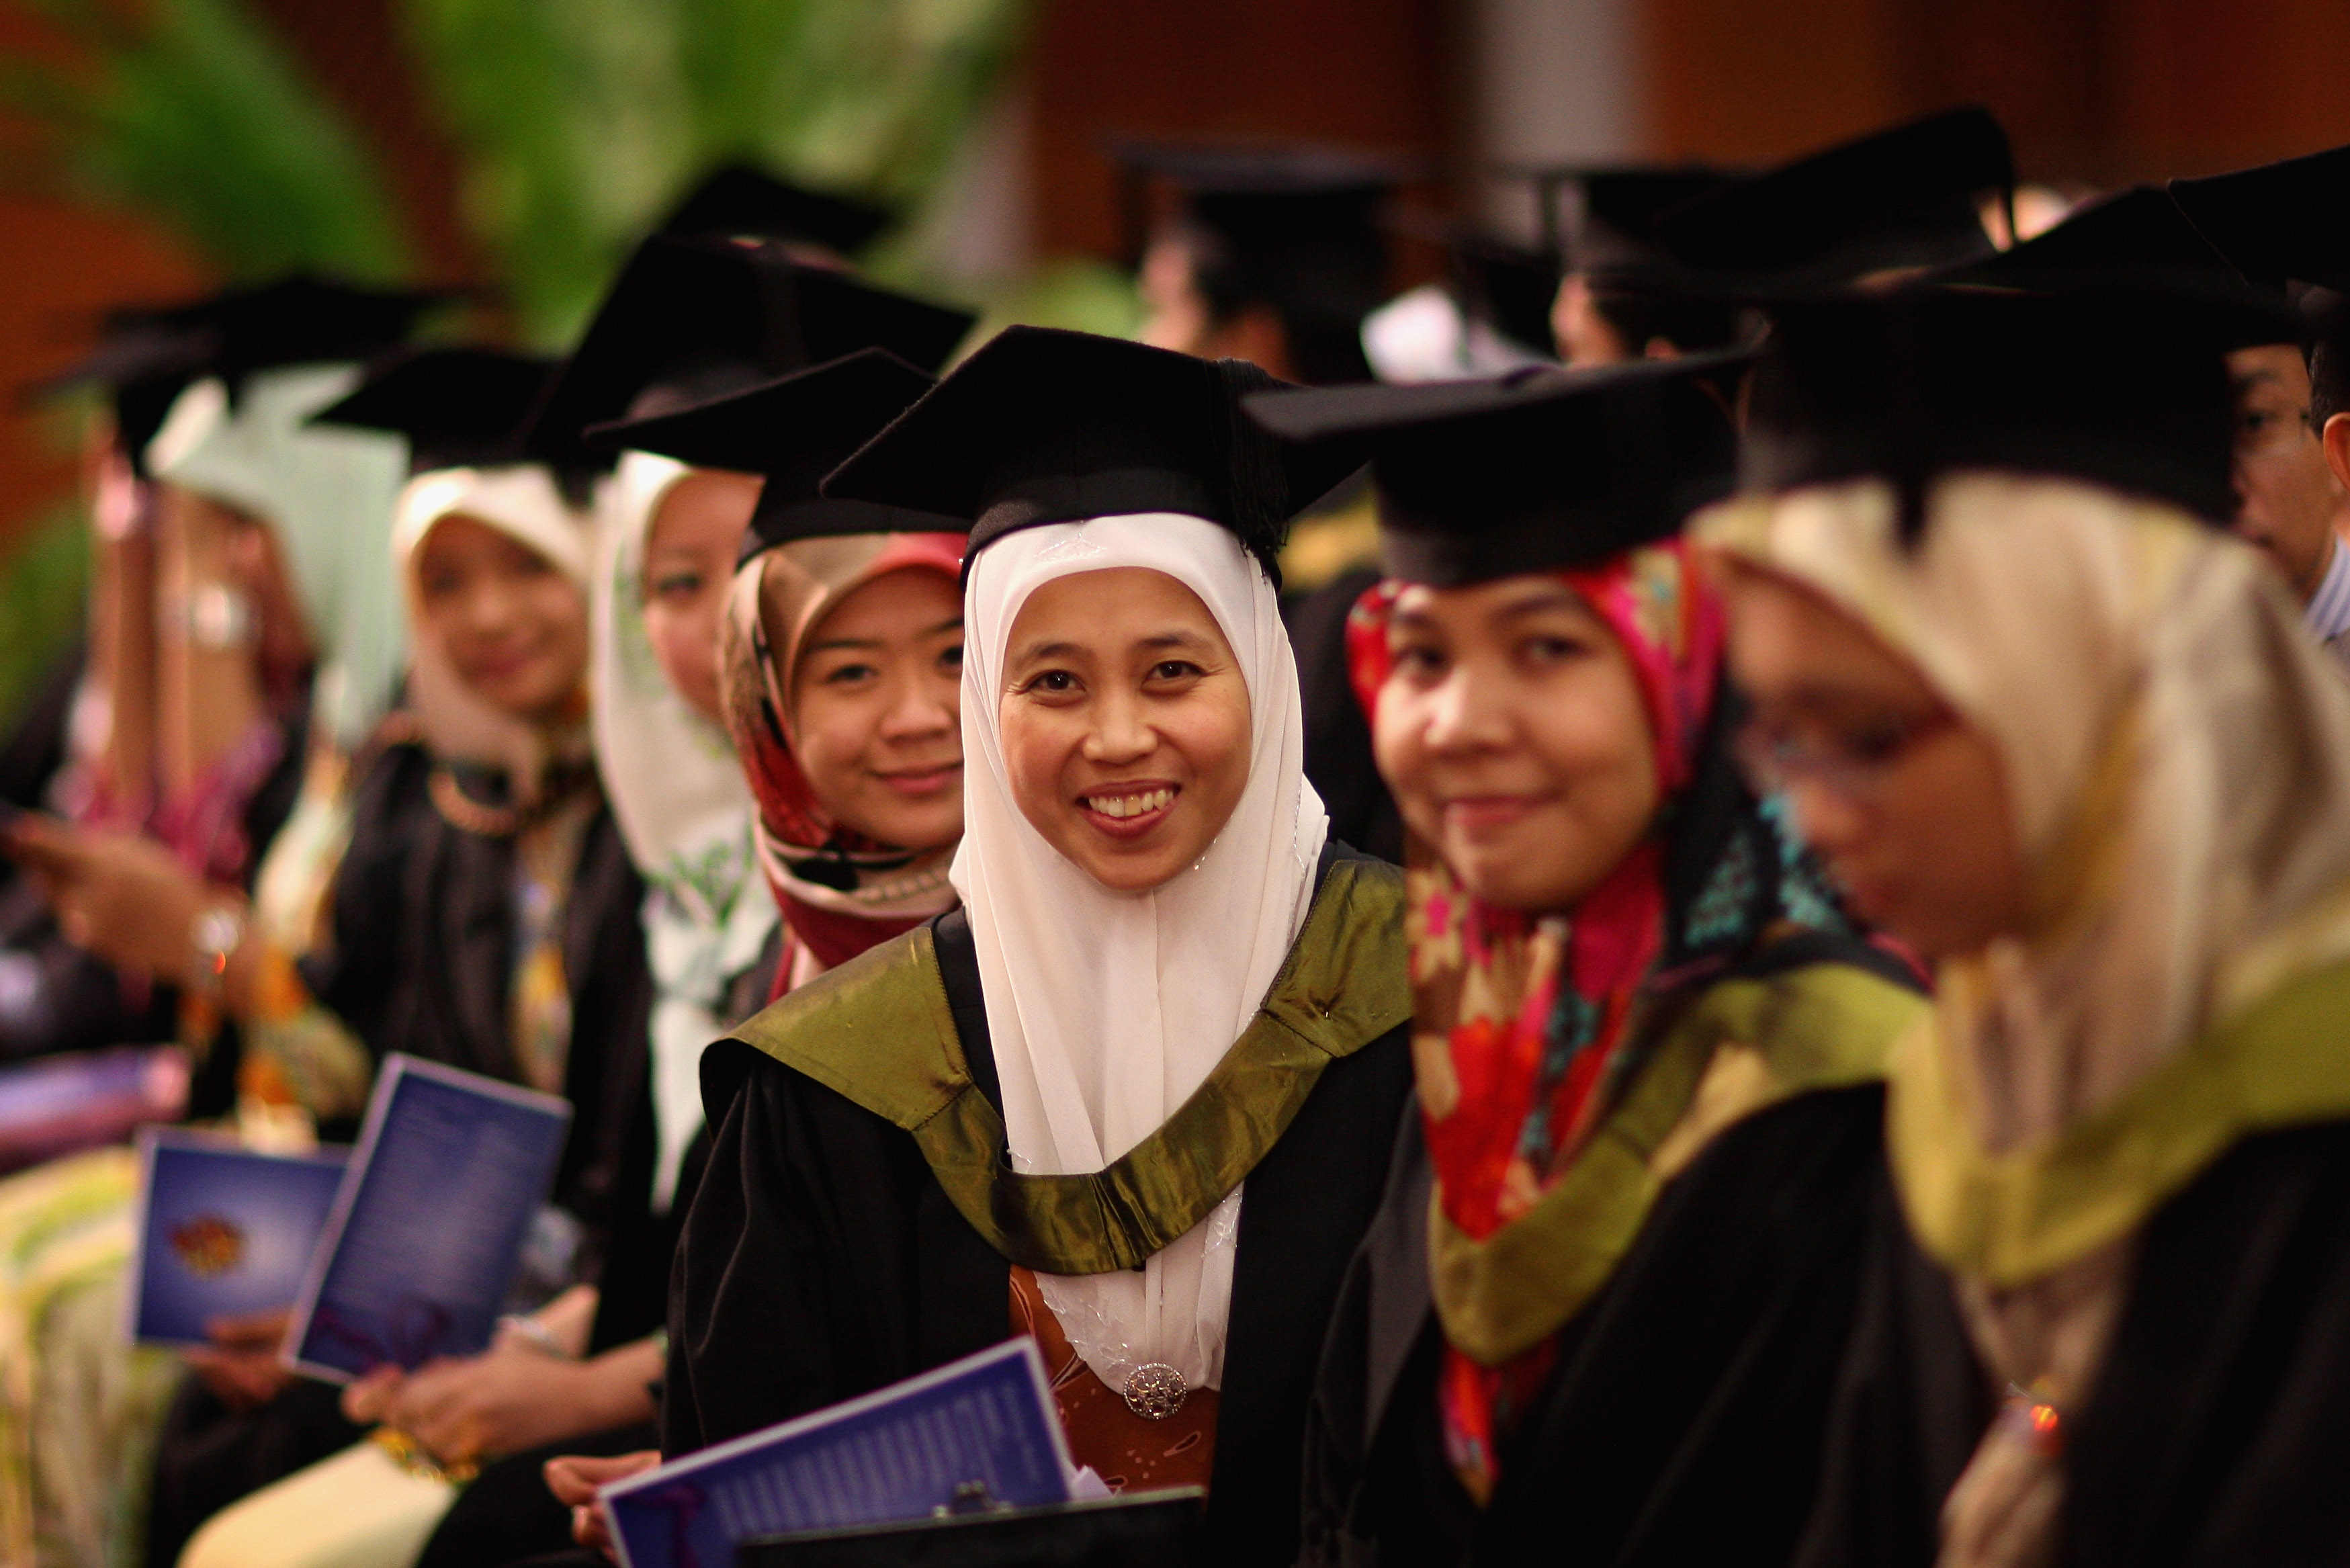
Education
Girls spend more time in school
The gap has closed
As of 2015, girls entering school were expected to complete a little over 12 years of schooling on average worldwide, outpacing their male classmates for the first time. Compare that to 1970, when boys spent almost two years longer in school, on average
School life expectancy, primary to tertiary
Female
Male
Year
Female school life expectancy, primary to tertiary (in years)
Male school life expectancy, primary to tertiary (in years)
1995
8.81
9.92
1996
8.90
9.98
1997
9.03
10.05
1998
9.11
10.06
1999
9.23
10.11
2000
9.38
10.26
2001
9.47
10.31
2002
9.66
10.48
2003
9.99
10.63
2004
10.16
10.81
2005
10.38
10.96
2006
10.55
11.08
2007
10.78
11.27
2008
11.01
11.42
2009
11.15
11.48
2010
11.37
11.70
2011
11.58
11.89
2012
11.80
12.03
2013
12.06
12.12
2014
12.18
12.19
2015
12.26
12.25
2016
12.42
12.34
2017
12.46
12.37
Source: UNESCO
Most progress among developing countries
% of original gap closed
1
Oman
2,947
2
Mauritius
635
3
Albania
519
4
Chile
370
5
Mexico
339
Largest gap among developing countries
years
1
Chad
-3.1
2
Benin
-2.3
3
Togo
-2.3
4
Ivory Coast
-1.9
5
Mali
-1.3
Health
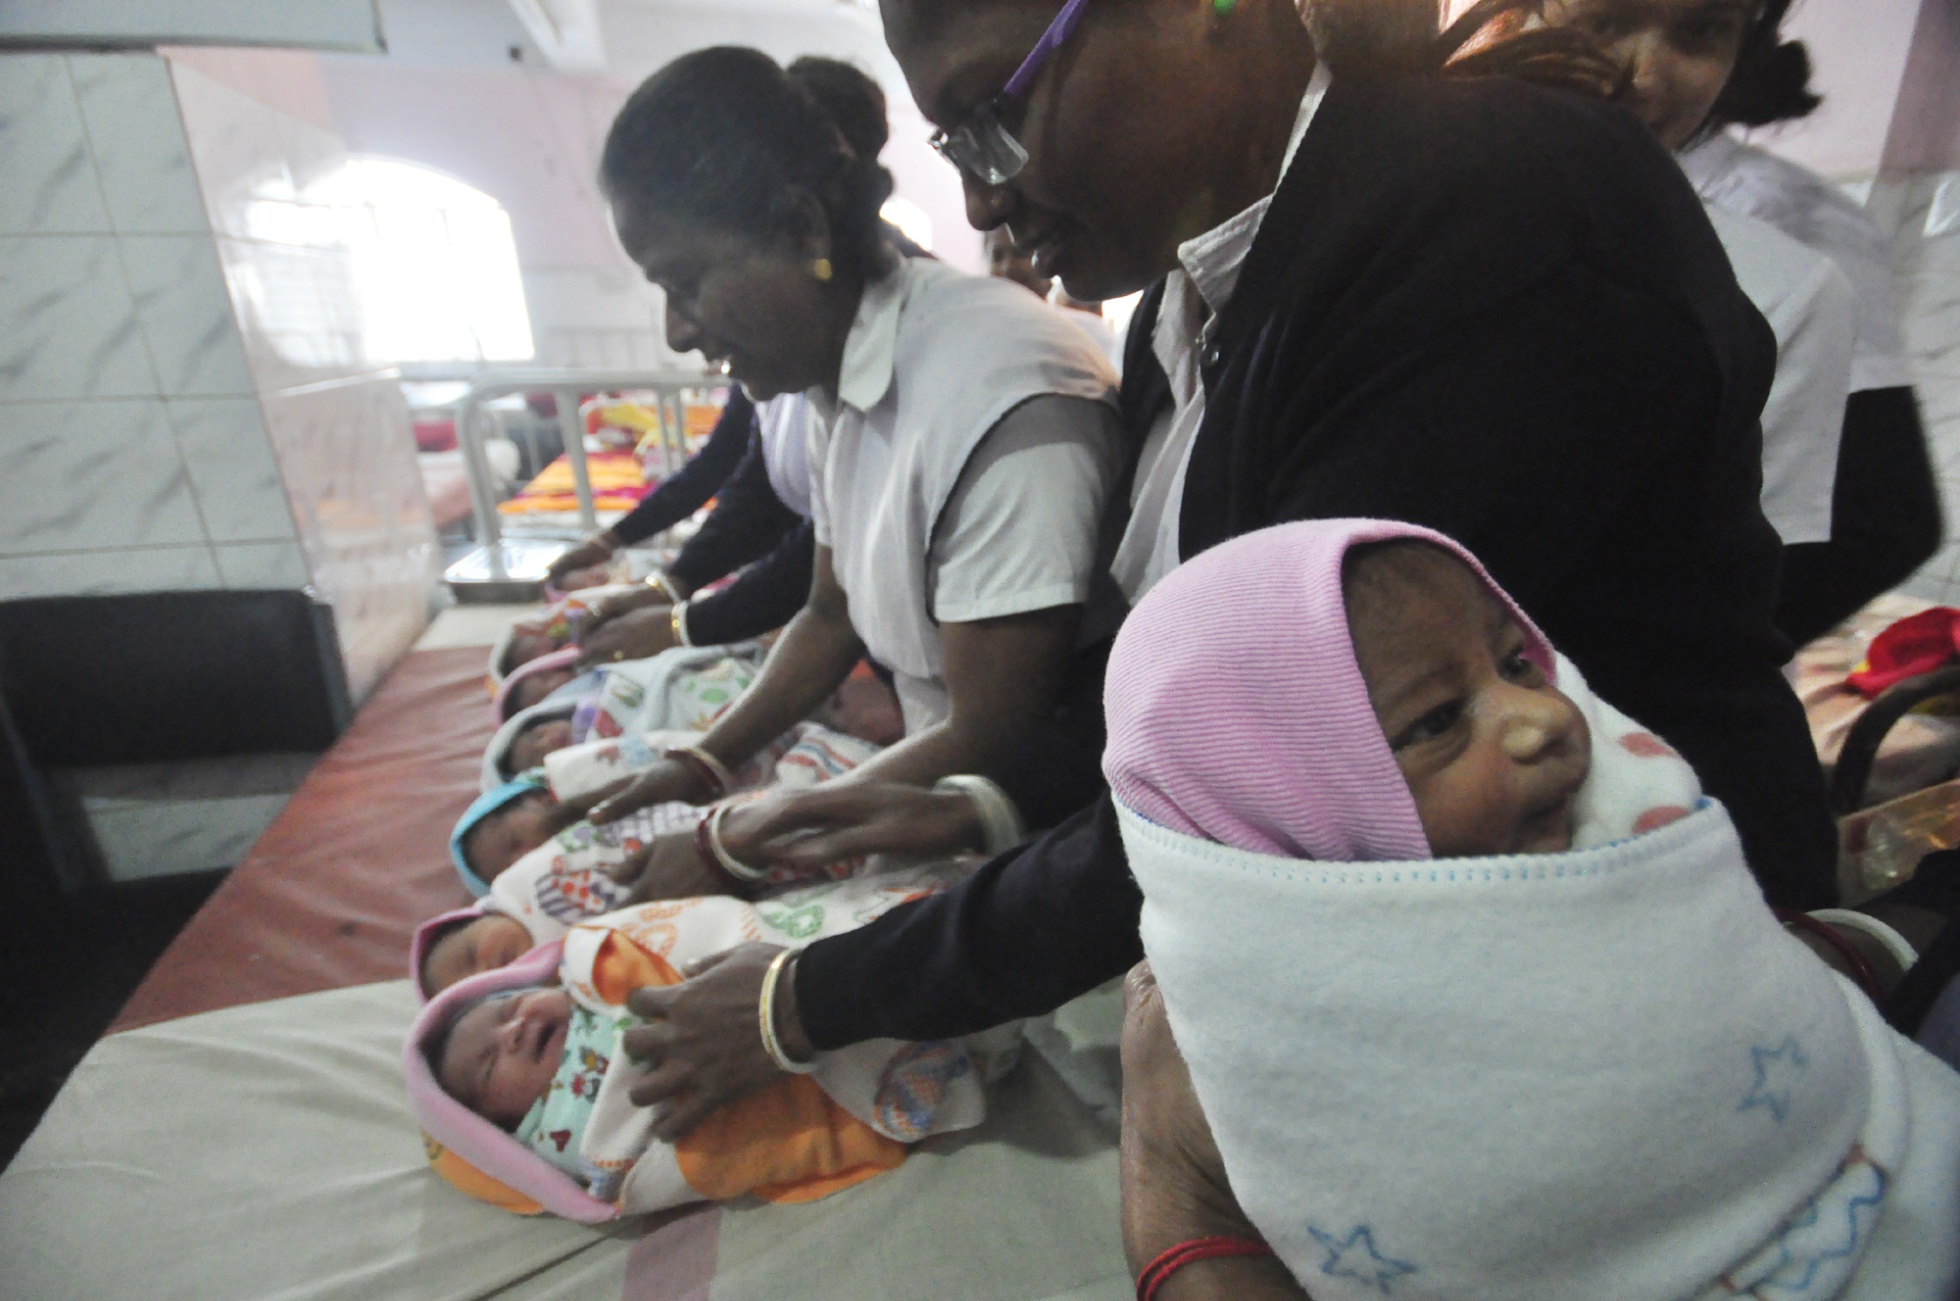
Fewer mothers die in childbirth
The gap has narrowed by 52%
Maternal deaths as a share of live births have fallen by 44 percent since 1990 and by even more in the least developed nations. But the rate there is still twice as high as the global average. Of particular worry is Sub-Saharan Africa, where the rate of maternal deaths remains up to six times higher than the rest of the world in some places.
Maternal deaths per 100,000 live births
Least developed countries
World
Year
Maternal deaths per 100,000 live births, world
Maternal deaths per 100,000 live births, least developed countries
1995
832
369
2000
732
341
2005
614
288
2010
519
246
2015
436
216
Source: UNICEF
Most progress
% of original gap closed
1
Myanmar
643
2
Bolivia
148
3
India
141
4
Bangladesh
136
5
Bhutan
125
Largest gap
times the global rate
1
Sierra Leone
6.3
2
Central African Republic
4.1
3
Chad
4.0
4
Nigeria
3.8
5
South Sudan
3.7
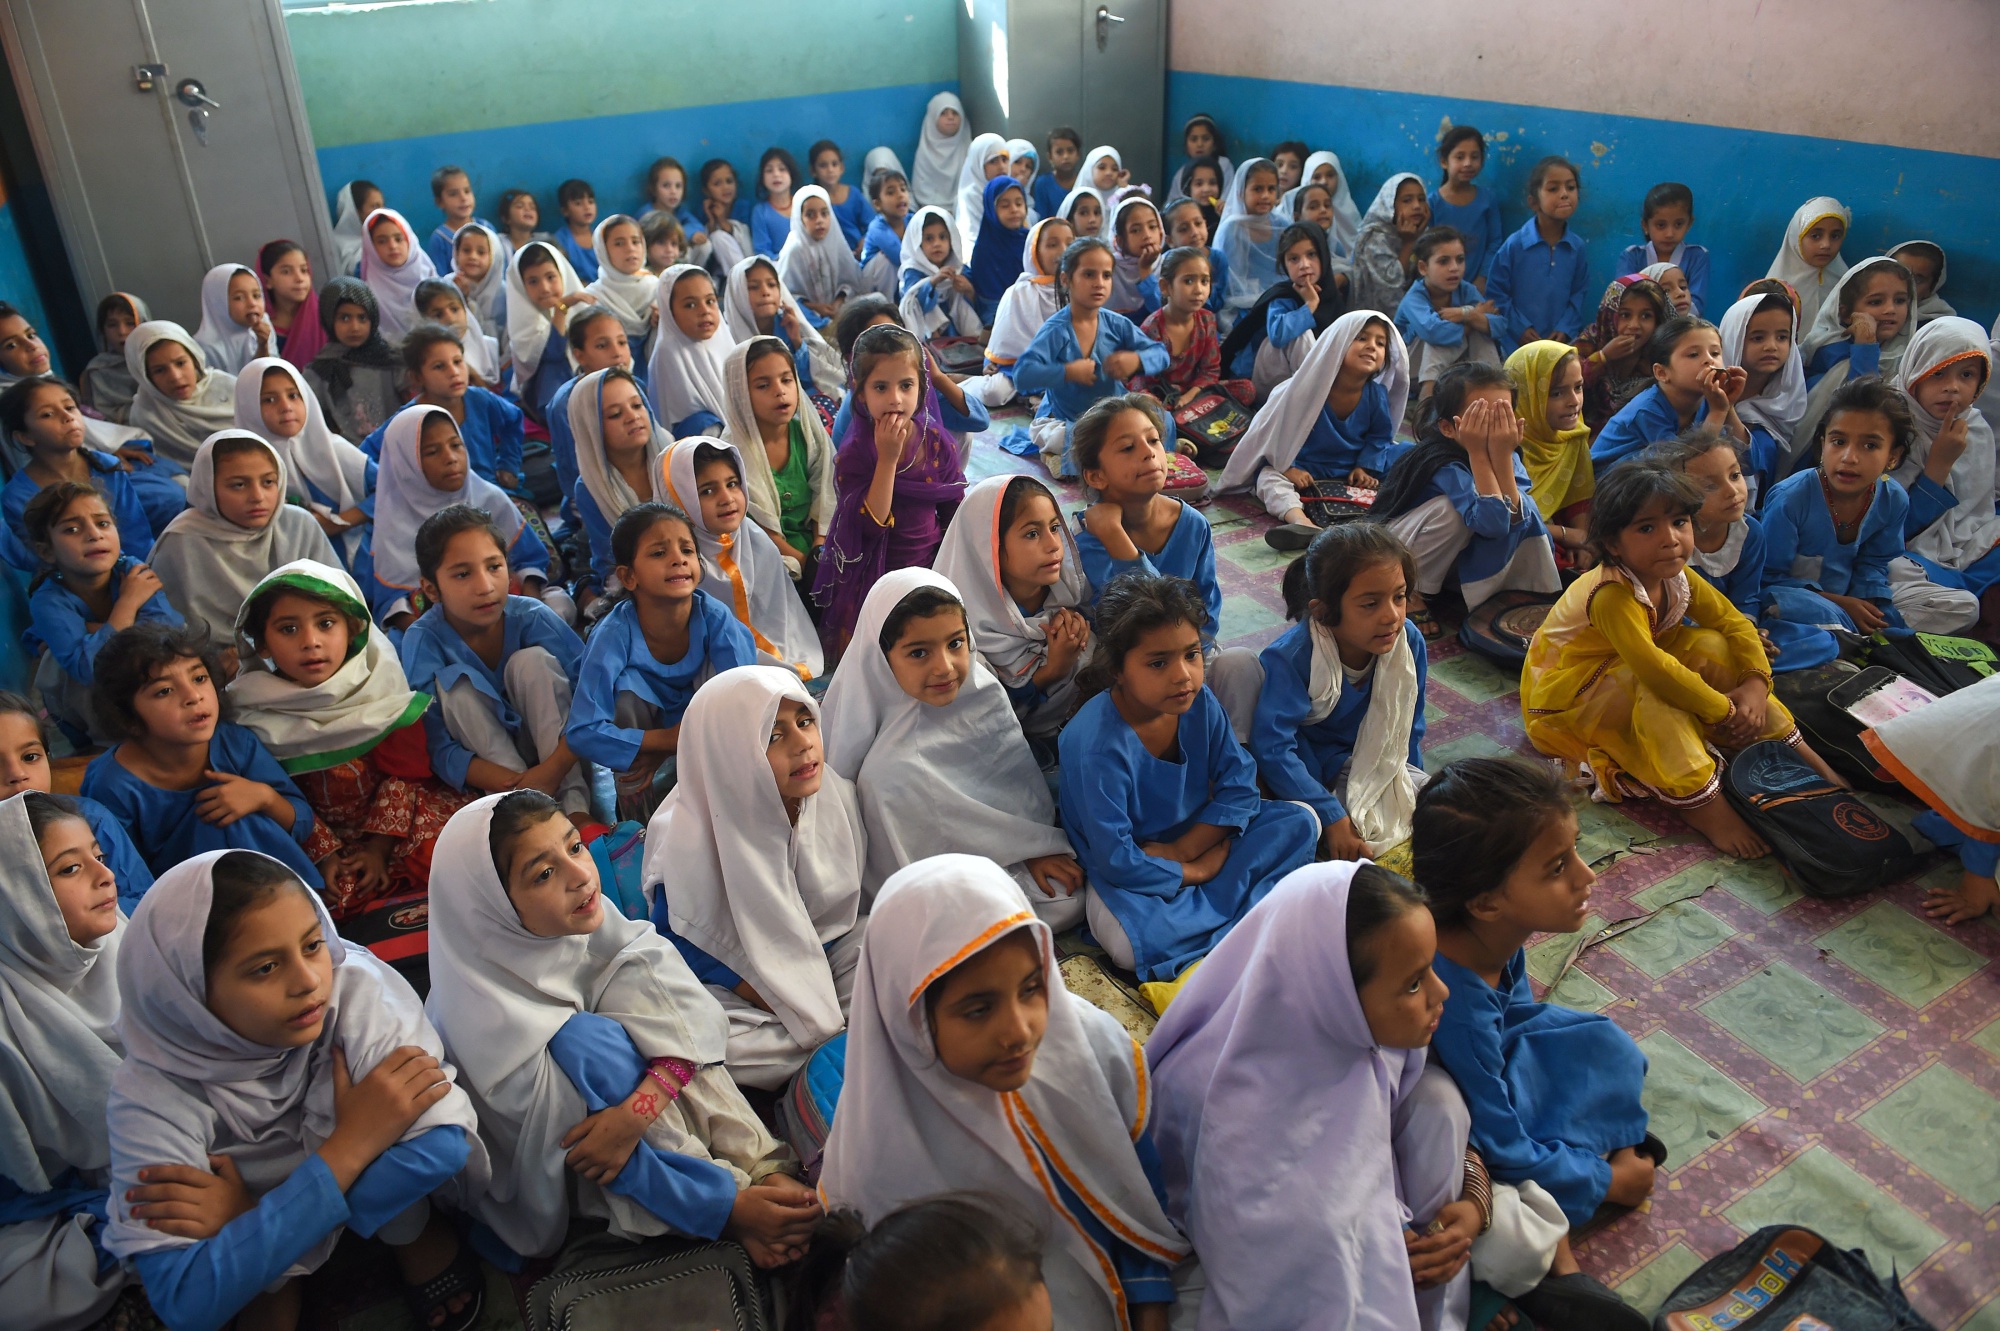
Education
Female literacy is way up
The gap has narrowed by 41%
Globally, nearly 83 percent of adult women were literate as of 2016, a huge increase from the 1970s when only around 61 percent were. While this is still less than the 90 percent literacy rate among adult men, the relative gap has narrowed significantly. Sixty-four countries, or around one in four, had female adult literacy rates above 90 percent.
Adult literacy rate, 15+ years old
Female
Male
Year
Female adult literacy rate, 15+ years old
Male adult literacy rate, 15+ years old
1995
71.42%
83.56%
1996
71.91%
83.83%
1997
74.63%
85.03%
1998
75.78%
86.26%
1999
76.18%
86.48%
2000
76.40%
86.61%
2001
76.75%
86.76%
2002
77.12%
87.07%
2003
77.66%
87.51%
2004
78.19%
87.90%
2005
77.77%
87.94%
2006
78.37%
87.84%
2007
78.96%
88.06%
2008
79.31%
88.34%
2009
79.74%
88.56%
2010
80.49%
88.64%
2011
80.76%
88.46%
2012
81.45%
89.28%
2013
81.63%
89.36%
2014
82.07%
89.55%
2015
82.33%
89.71%
2016
82.66%
89.84%
Source: UNESCO
Most progress
% of original gap closed
1
Qatar
139
2
Azerbaijan
89
3
Turkmenistan
86
4
Kuwait
75
5
Laos
59
Largest gap
percentage pts
1
Mozambique
-28
2
Pakistan
-25
3
Mali
-23
4
Guinea
-22
5
Burkina Faso
-18
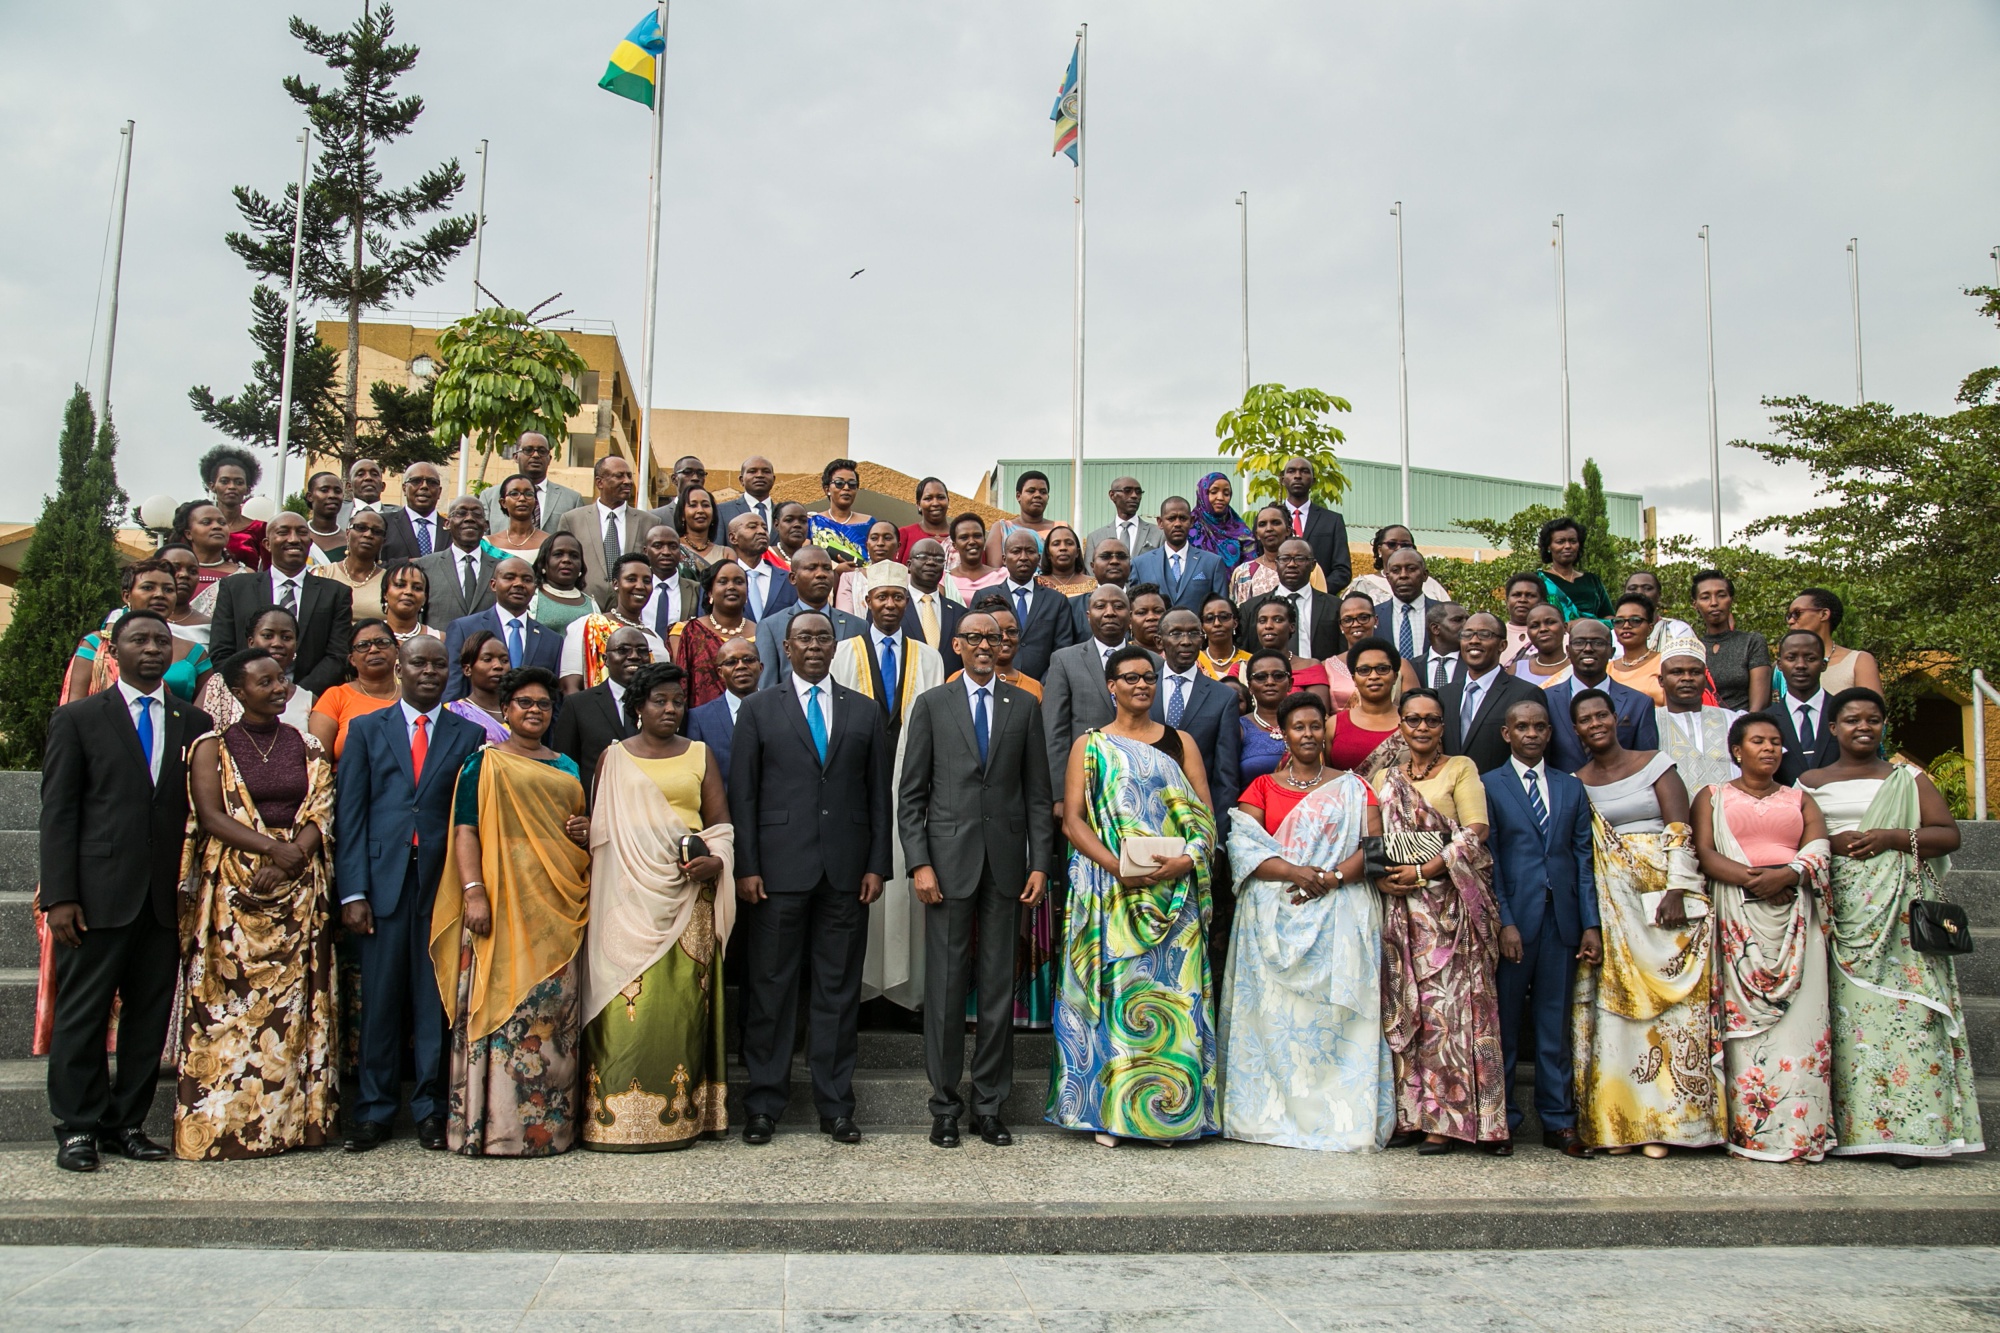
Leadership
More women are bosses
The gap has narrowed by 38%
Management positions are more likely to be held by women compared to twenty years ago, though parity is still a long way off. Eastern Europe and Central America generally performed best on this metric.
Share of senior and middle management jobs, global unweighted average
Female
Male
Year
Female share of senior and middle management jobs, global average
Male share of senior and middle management jobs, global average
1995
21.03%
78.97%
2000
27.79%
72.21%
2005
30.98%
69.02%
2010
31.56%
68.44%
2015
31.72%
68.28%
2016
32.20%
67.80%
Source: UNDP
Most progress
% of original gap closed
1
Fiji
41
2
Poland
36
3
Guatemala
36
4
Mauritius
29
5
Thailand
27
Lowest level
% female share
1
Turkey
16.7
2
Malaysia
20.8
3
Indonesia
21.5
4
Macedonia
27.3
5
Croatia
29.5
Health
Women are living longer
The gap has narrowed by 30%
Women in “low income” countries were living 78 percent as long as women in “high income” countries by 2016, up from 57 percent in 1960. Women outlive men, on average, in every country, by as little as a few months in Bhutan to nearly 11 years longer in Russia.
Life expectancy at birth
High income countries
Low income countries
Year
Female life expectancy at birth, high income countries (in years)
Female life expectancy at birth, low income countries (in years)
1995
79.57
53.57
1996
79.85
53.79
1997
80.14
54.05
1998
80.29
54.35
1999
80.36
54.71
2000
80.59
55.13
2001
80.86
55.62
2002
80.98
56.16
2003
81.07
56.77
2004
81.47
57.42
2005
81.54
58.12
2006
81.83
58.84
2007
82.04
59.58
2008
82.14
60.32
2009
82.39
61.03
2010
82.53
61.70
2011
82.76
62.32
2012
82.83
62.89
2013
82.98
63.43
2014
83.22
63.92
2015
83.08
64.37
2016
83.10
64.78
Source: UNDP
Most progress
% of original gap closed
1
Lebanon
72
2
Rwanda
70
3
Maldives
67
4
Poland
53
5
Oman
52
Largest gap
years
1
Sierra Leone
-30.7
2
Central African Republic
-29.1
3
Chad
-29.0
4
Nigeria
-28.9
5
Ivory Coast
-28.0
Leadership
Female lawmakers pick up more of the vote
The gap has narrowed by 28%
Women held a little more than one in five legislative seats worldwide in 2017, double their share in 1995. In developed countries, women had closer to one in three seats. Only two countries had majority-female legislatures in 2017: Rwanda and Bolivia.
Share of seats in parliament, global unweighted average
Female
Male
Year
Female share of seats in parliament, global average
Male share of seats in parliament, global average
1995
10.64%
89.36%
1997
10.53%
89.47%
2000
11.99%
88.01%
2005
15.57%
84.43%
2010
17.84%
82.16%
2011
18.52%
81.48%
2012
19.12%
80.88%
2013
19.87%
80.13%
2014
20.10%
79.90%
2015
20.61%
79.39%
2016
20.98%
79.02%
2017
21.39%
78.61%
Source: UNDP
Most progress
% of original gap closed
1
Rwanda
117
2
Nicaragua
89
3
Senegal
79
4
Mexico
76
5
Ecuador
74
Lowest level
% female share
1
Micronesia
0.1
2
Papua New Guinea
0.1
3
Kuwait
3.1
4
Lebanon
3.1
5
Thailand
4.8
Work
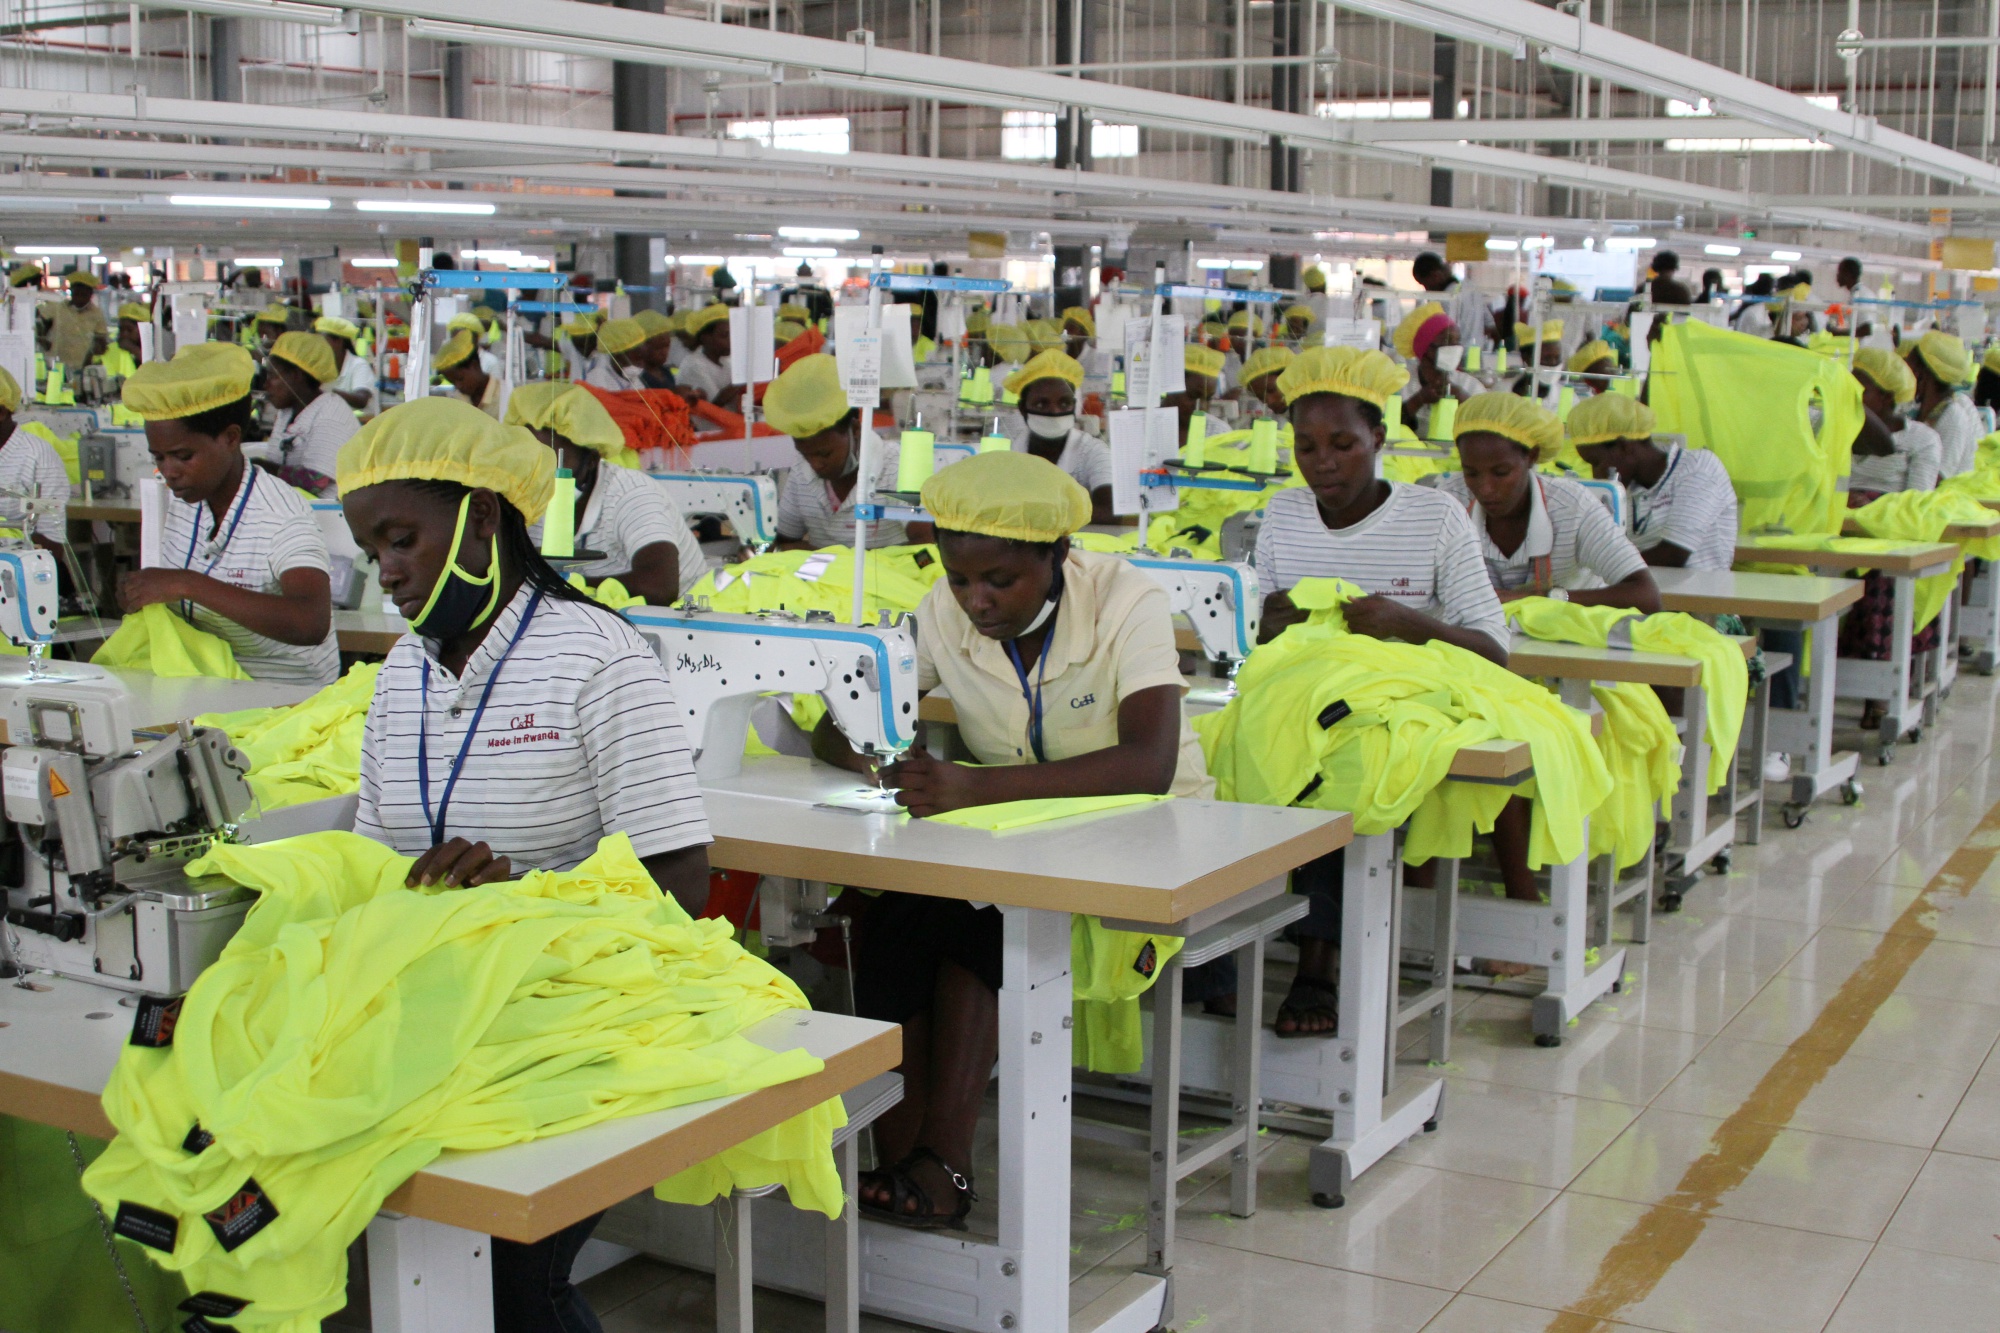
Women are less likely to be in the workforce
The gap has narrowed by 4%
The share of women participating in the workforce globally has fallen over the past few decades, from a little over 51 percent in 1995 to less than 49 percent in 2015. But an even larger drop in male labor-force participation over that same period means the gap has narrowed somewhat. Besides wealthier Scandinavian countries, those closest to parity were almost all in Sub-Saharan Africa.
Labor force participation rate
Female
Male
Year
Female labor force participation rate (ILO modelled estimates)
Male labor force participation rate (ILO modelled estimates)
1995
51.50%
79.30%
1996
51.50%
79.10%
1997
51.40%
79.00%
1998
51.30%
78.80%
1999
51.40%
78.70%
2000
51.30%
78.50%
2001
51.20%
78.20%
2002
51.20%
77.90%
2003
51.10%
77.70%
2004
51.10%
77.50%
2005
51.10%
77.40%
2006
50.90%
77.20%
2007
50.50%
77.00%
2008
50.20%
76.80%
2009
49.90%
76.60%
2010
49.40%
76.20%
2011
49.20%
76.00%
2012
49.00%
75.90%
2013
49.00%
75.80%
2014
48.90%
75.60%
2015
48.80%
75.50%
2016
48.90%
75.30%
2017
48.70%
75.20%
2018
48.50%
75.10%
Source: ILO
Most progress
% of original gap closed
1
Benin
82
2
Rwanda
79
3
Equatorial Guinea
73
4
Liberia
67
5
Azerbaijan
61
Largest gap
percentage pts
1
Afghanistan
-68
2
Yemen
-63
3
Syria
-59
4
Pakistan
-57
5
Saudi Arabia
-57
Work
Women still earn less
The gap has narrowed by 0.2%
In 2017, women were making 58 percent as much as men were, as measured by gross national income per capita, up from 44 percent in 1995. Of the 25 countries where women earned at least 75 percent of what men did, 15 were in Africa.
Estimated gross national income per capita (PPP), global unweighted average
Female
Male
Year
Estimated gross national income per capita (PPP), female ($2011)
Estimated gross national income per capita (PPP), male ($2011)
1995
$7,527.10
$16,944.46
2000
$8,778.94
$18,657.49
2005
$10,080.02
$20,117.91
2010
$11,270.83
$20,611.27
2015
$12,409.17
$21,650.99
2017
$12,742.58
$22,140.58
Source: UNDP
Most progress
% of original gap closed
1
Burundi
213
2
Namibia
68
3
Brunei
62
4
Belize
51
5
Libya
48
Largest gap
less in dollars
1
Qatar
76,797
2
United Arab Emirates
59,157
3
Saudi Arabia
56,524
4
Kuwait
53,906
5
Oman
38,036
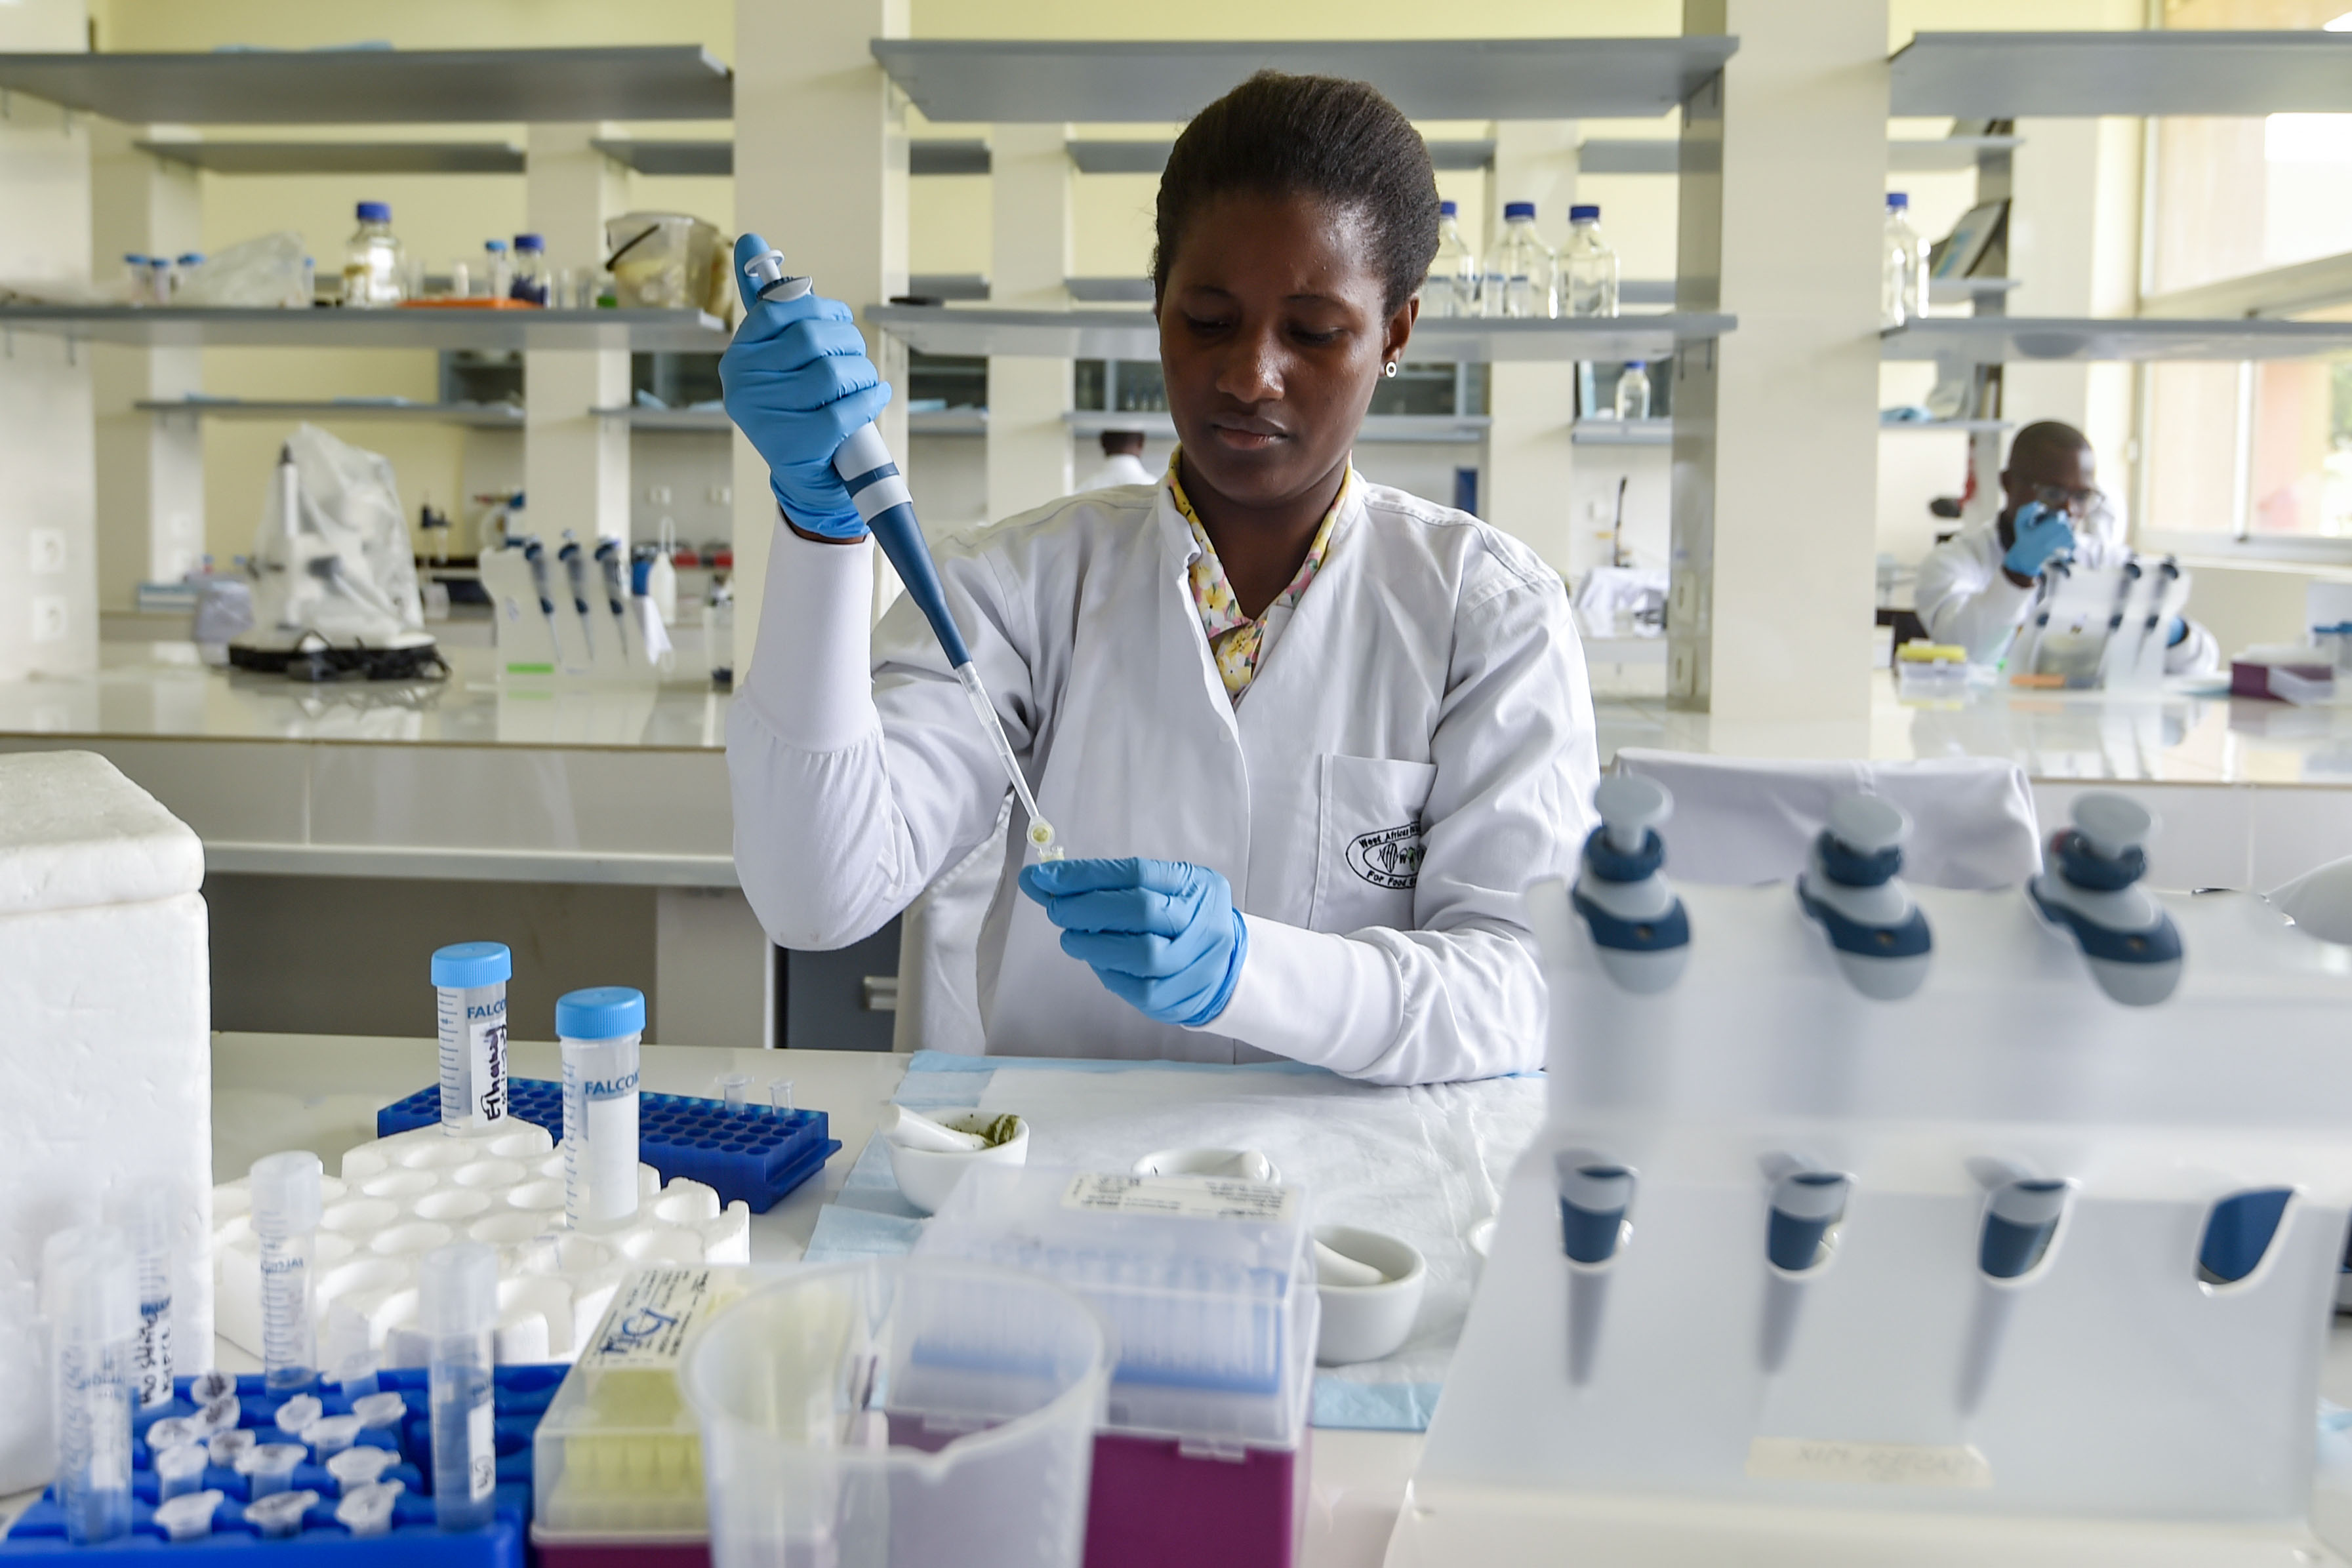
Education
STEM fields lean heavily male
The gap has widened
Available data on the share of female university graduates in so-called STEM fields—science, technology, engineering and mathematics—shows a decline for all but tech majors over the last 20 years.
Share of university graduates from Natural Sciences, Mathematics and Statistics programs, global unweighted average
Female
Male
Year
Female share of university graduates from Natural Sciences, Mathematics and Statistics programs, global average
Male share of university graduates from Natural Sciences, Mathematics and Statistics programs, global average
1999
5.20%
94.80%
2001
4.66%
95.34%
2003
4.42%
95.58%
2005
4.47%
95.53%
2007
4.64%
95.36%
2009
4.72%
95.28%
2011
5.11%
94.89%
2013
4.82%
95.18%
2015
5.00%
95.00%
2017
4.53%
95.47%
Source: UNESCO
Most progress
% of original gap closed
1
Georgia
12.3
2
Brunei
9.5
3
Albania
8.6
4
Bermuda
8.0
5
Hungary
5.0
Lowest level
% female share
1
El Salvador
1.0
2
Laos
1.0
3
Honduras
1.1
4
Guatemala
1.2
5
Colombia
1.3
Work
More women are unemployed
The gap has widened
Women globally were unemployed at a rate 0.9 percentage point higher than men in 2018, up from a 0.6 percentage point gap in 1991. Many individual countries have seen real improvements, however, with women now experiencing lower unemployment rates than men in 24 New Economy countries, including China, Russia and Nigeria.
Countries listed under each indicator are among “emerging market and developing economies” as classified by the International Monetary Fund.
Overall progress was calculated by comparing the relevant gap in the most recent available year to the gap in 1995, except in the STEM graduate category, where a starting point of 1999 was used. All indicators compare female versus male averages except for maternal mortality and life expectancy, which compare the female average between different parts of the world.
Country-specific progress was calculated using the same time periods as the global progress calculation, where possible. For life expectancy, progress was calculated by comparing the earliest available data in the 1995-99 period to the most recent available data in the 2014-18 period. For the literacy and STEM graduate categories, progress was calculated by comparing the earliest available data in the 1999-2003 period to the most recent available data in the 2014-18 period. For the managerial jobs category, progress was calculated by comparing the most recent available data in the 2014-18 period to the earliest available datapoint at least five years prior. Country-specific figures for largest gap or lowest level are for the most recent year available.