How Big Is North Korea’s Economy? Pick a Number, Any Number
The Mass Games performed in Pyongyang in 2013. Photographer: Jonas Gratzer/LightRocket/Getty Images
Donald Trump and Kim Jong Un’s landmark summit on June 12 has spurred hope that North Korea may finally open its economy. That could also be a boon for economists, who know next to nothing about how it actually works.
North Korea stopped releasing detailed statistical data in the 1960s, and for the next four decades the only hard economic numbers came from limited revenue and spending figures in annual national budget reports. The government removed absolute numbers altogether in the early 2000s, and since then has only offered year-on-year percentage changes for various oddly described sectors. They look like this:
Increase in spending from 2017 to 2018

↑7.3%
↑6.0%
Science
and technology
investment
Public health
↑5.9%
↑5.5%
Education
Overall national
economy*
↑5.1%
↑5.1%
Total expenditures
Sports
↑4.9%
↑4.9%
Forest restoration
campaign
Improving economic
independence**
↑3.0%
Literature and art

↑7.3%
↑6.0%
↑5.9%
Science
and technology
investment
Public health
Education
↑5.5%
↑5.1%
↑5.1%
Overall national
economy*
Total expenditures
Sports
↑4.9%
↑4.9%
↑3.0%
Improving economic
independence**
Forest restoration
campaign
Literature and art

↑7.3%
↑6.0%
↑5.9%
↑5.5%
↑5.1%
Science
and technology
investment
Public health
Education
Overall national
economy*
Total expenditures
↑5.1%
↑4.9%
↑4.9%
↑3.0%
Sports
Improving economic
independence**
Forest restoration
campaign
Literature and art

↑5.1%
↑4.9%
↑4.9%
↑3.0%
↑7.3%
↑6.0%
↑5.9%
↑5.5%
↑5.1%
Science
and technology
investment
Public health
Education
Overall national
economy*
Total
expenditures
Sports
Improving
economic
independence**
Forest
restoration
campaign
Literature
and art
**Officially, “Strengthening the independence and Juche character of the national economy and improving the standard of people’s living.”
The dearth of information has left economists with little option but to combine these patchy figures with inexact estimates of agricultural and industrial output based on satellite photographs, thermal imaging and, according to Marcus Noland, an expert on North Korea at the Peterson Institute for International Economics, possibly a network of spies in the country. Noland has written that he’s “only half-joking” when he tells people he makes up his data on the country.
South Korea’s central bank—considered the most authoritative source for North Korean economic data—uses figures compiled by the government and intelligence agencies to make estimates. That includes everything from water flows at dams to smoke coming out of chimneys to the size of rice paddy crops, according to Lee Seog-Ki, senior research fellow at the Korea Institute for Industrial Economics & Trade, a think tank run by South Korea’s trade industry.
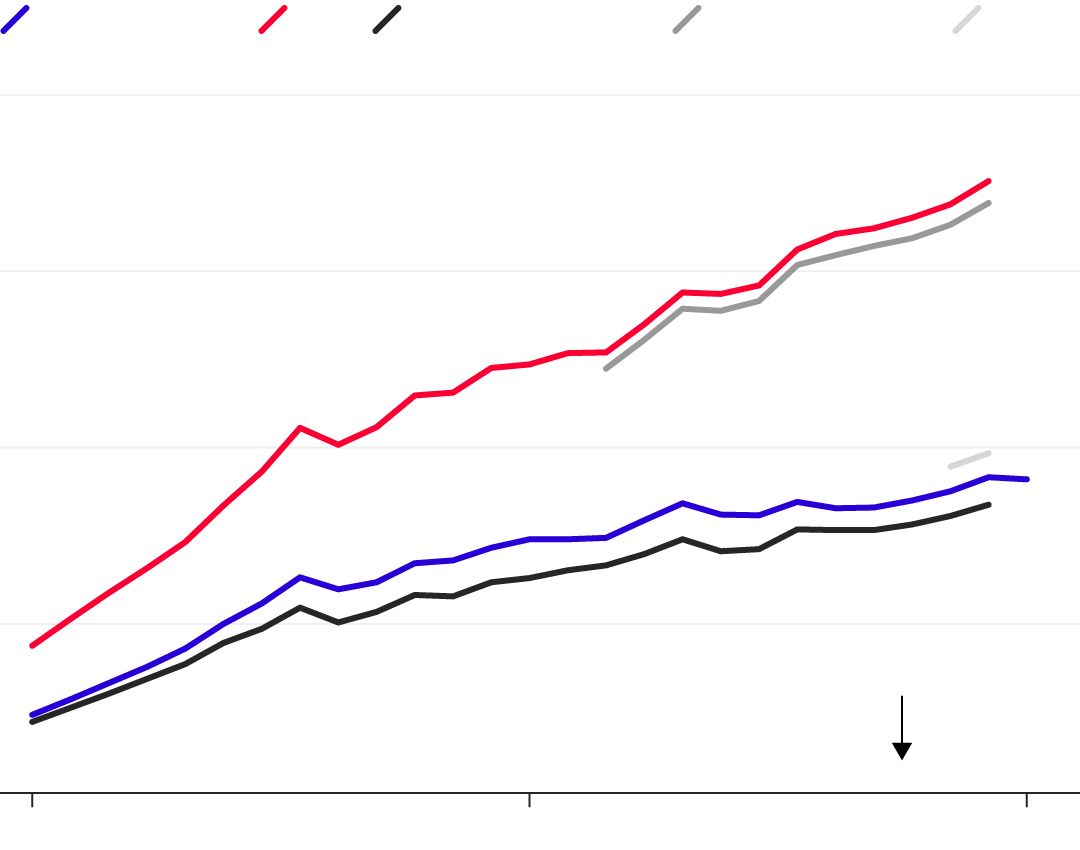
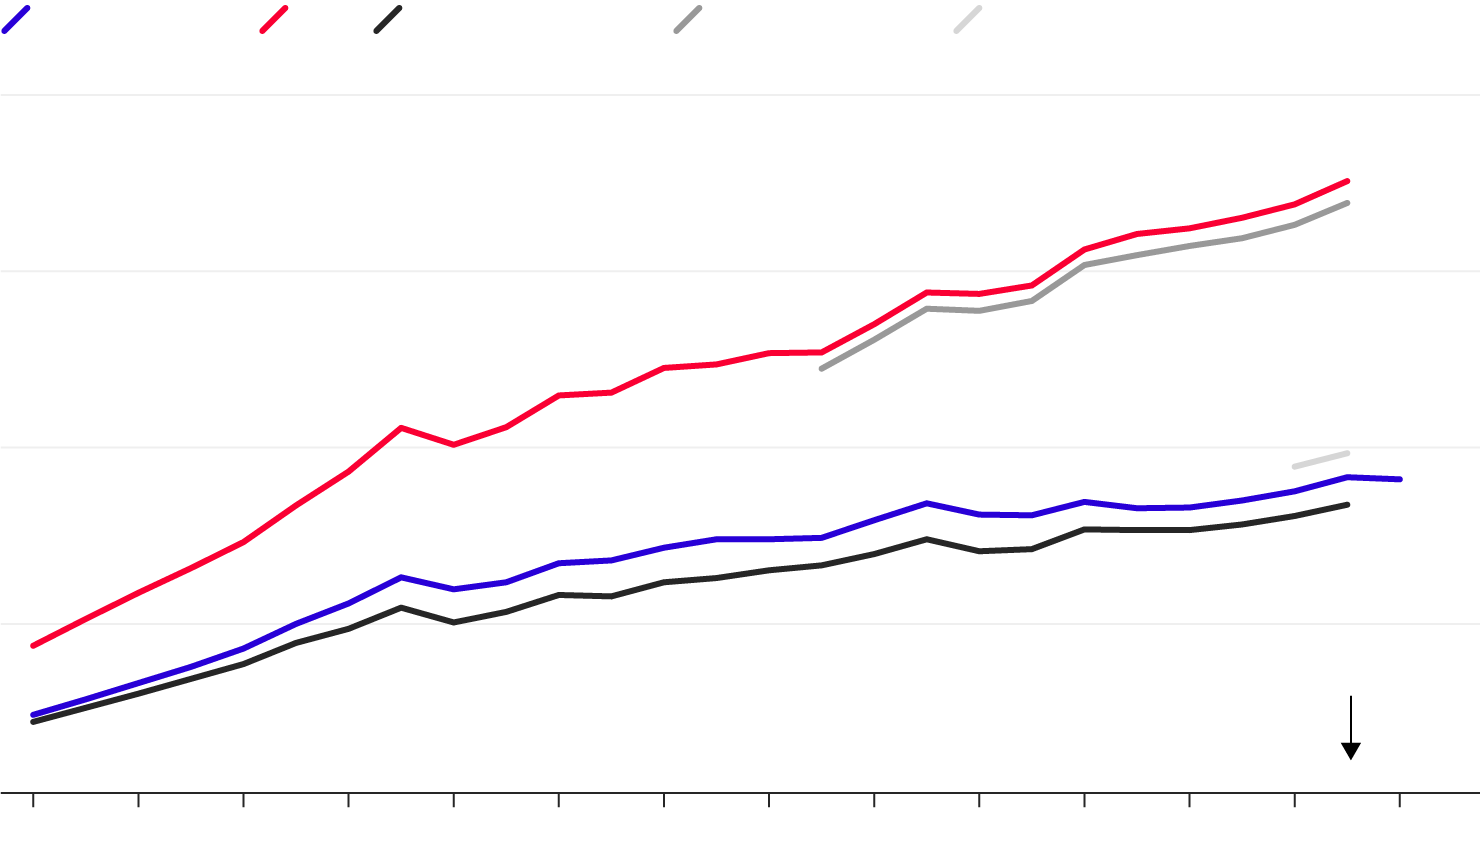
Once numbers are produced, often they aren’t comparable. One estimate might present gross domestic product in local currency, another in current-year dollars, and still another in inflation-adjusted dollars. Since most projections use the same units for North Korea and South Korea—and South Korea has generally reliable statistics—we can use GDP ratios of the two countries to show how varied the North Korea estimates are:
South Korea/North Korea GDP ratio, according to...

Bank of Korea
UN
Maddison
Project
U.S. State Dept.
CIA
100
75
50
25
GDPs closer in size
1
1990
2003
2016
Bank of Korea
UN
Maddison Project
U.S. State Dept.
CIA
100
75
50
25
GDPs closer in size
1
1990
2003
2016
Bank of Korea
UN
Maddison Project
U.S. State Dept.
CIA
100
75
50
25
GDPs closer in size
1
1990
1992
1994
1996
1998
2000
2002
2004
2006
2008
2010
2012
2014
2016

Over a 26-year run, the Bank of Korea has estimated North Korea’s economy to be roughly 1.8 times the size the United Nations thinks it is. While such wild deviations would sound unreasonable for any other country, agencies are upfront about how much uncertainty is involved. The CIA, for instance, acknowledges that its GDP estimate (adjusted for purchasing power parity) of $40 billion has been “rounded to the nearest $10 billion.”
The lack of data makes it nearly impossible to know how much money the average North Korean citizen earns per year. Here are the figures for 2011, a year that allows the closest comparison among agencies with no adjustment, given the availability of data:
2011 North Korea GDP per capita, 2011 USD, according to...

$1,718
$1,197
Maddison Project
Bank of Korea
$612
$571
U.S. State Dept.
UN (2010 USD)

$1,718
$1,197
$612
$571
Maddison Project
Bank of Korea
U.S. State Dept.
UN (2010 USD)

$1,718
$1,197
$612
$571
Maddison Project
Bank of Korea
U.S. State Dept.
UN (2010 USD)

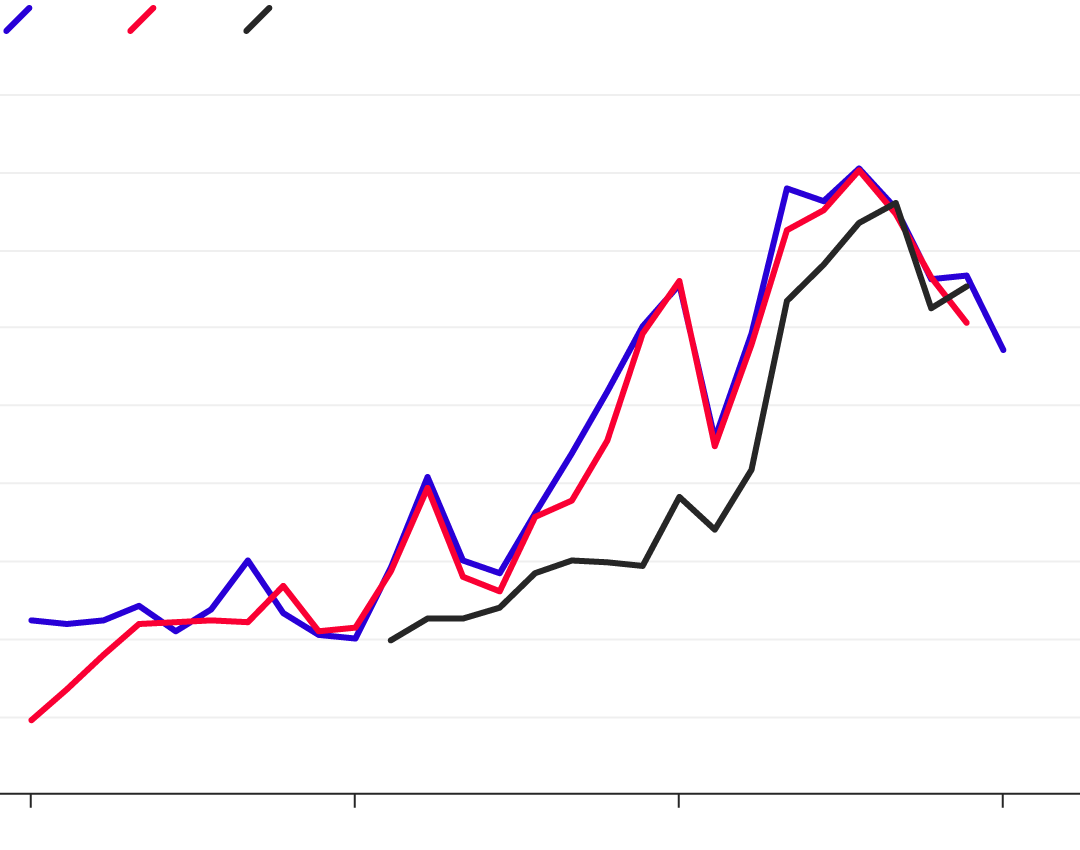
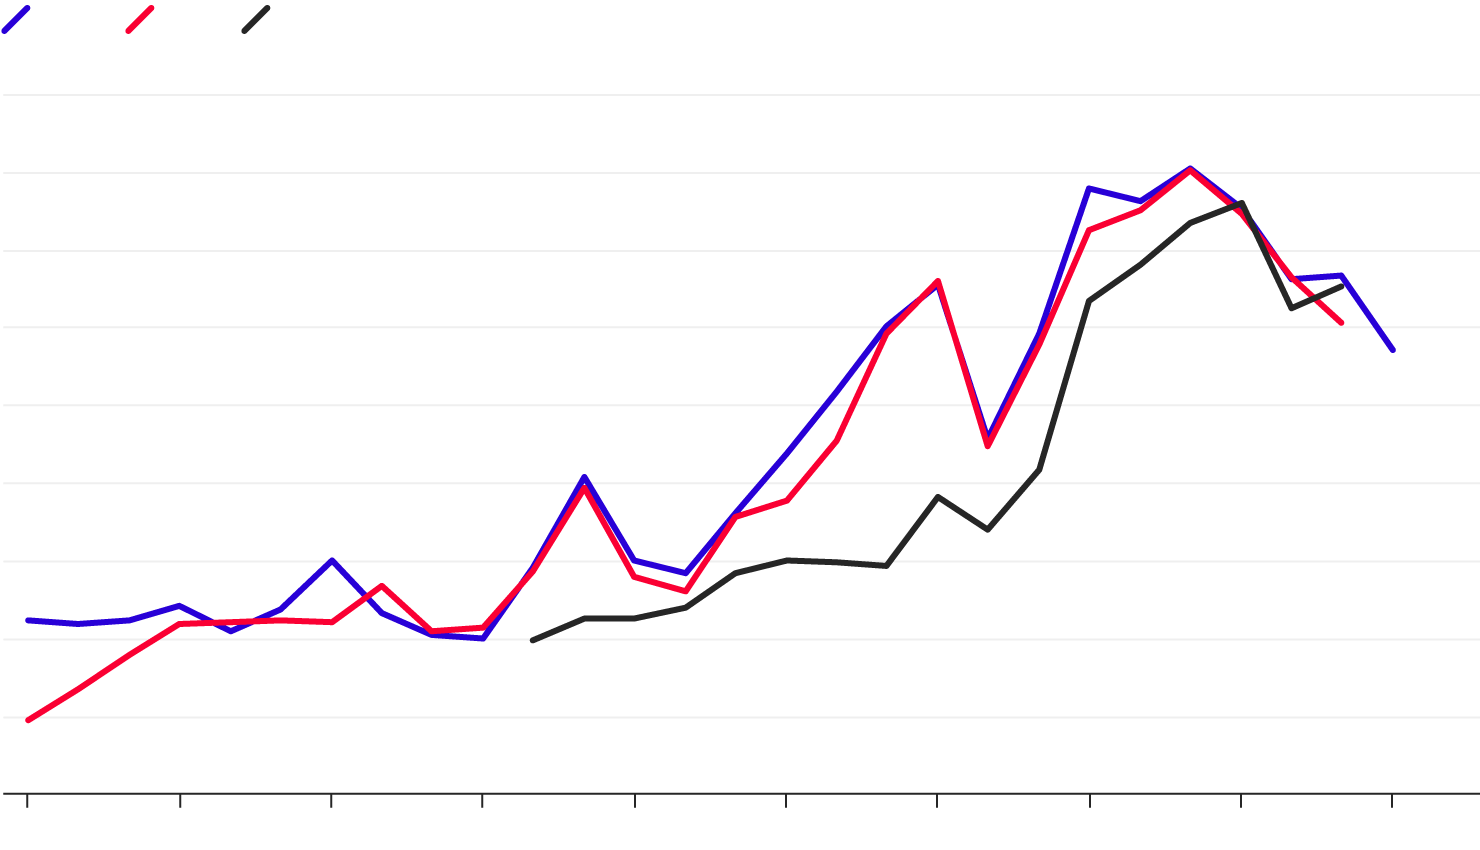
Trade statistics aren’t much more reliable, even though other countries must report their imports and exports with North Korea. That’s due to a number of reasons: Governments sometimes confuse the two Koreas when reporting trade, and they may be tempted to keep some transactions hidden with a rogue regime under international sanctions.
Total trade in goods by North Korea, according to...
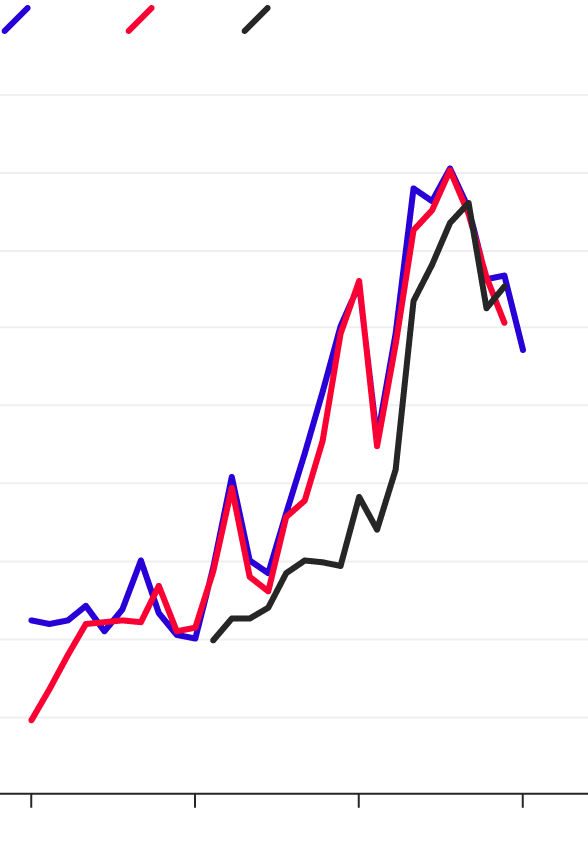
IMF
UN
KOTRA
$9B
8
7
6
5
4
3
2
1
0
1999
2008
2017
1990
IMF
UN
KOTRA
$9B
8
7
6
5
4
3
2
1
0
1999
2008
2017
1990
IMF
UN
KOTRA
$9B
8
7
6
5
4
3
2
1
0
1996
1999
2002
2005
2008
2011
2014
2017
1990
1993

So if the numbers on North Korea’s economy are so flawed, then why do agencies bother to publish anything at all? Rüdiger Frank, who has studied North Korea since spending a semester in Pyongyang in the early 1990s, says it comes down to supply and demand: “If you keep asking for numbers, they will eventually be produced.”