How ETFs Became the Market
If you work in exchange-traded funds, memories of 2008 aren’t all doom and gloom.
Lehman Brothers’ collapse in September of that year ushered in a new era for ETFs. And they've been on a roll ever since. Assets in the low-cost portfolios that trade like stocks and typically track an index have swelled to $5 trillion globally, up from less than $700 billion before the financial crisis. Meanwhile, the number of funds has more than doubled as they gradually account for bigger and bigger pieces of the equity, bond and commodity markets.
Although they started trading in the U.S. in 1993, the financial crisis marked a turning point for ETFs. Banks were forced to shed large inventories to bolster their balance sheets. And retail investors who’d lost their shirts went looking for ways to diversify their risk. ETFs offered both a solution.
By packaging slices of the market into tradeable vehicles, ETFs became the go-to instrument for professionals seeking instant, liquid exposure to markets around the world. Mom-and-pop savers, meanwhile, got a cheap, transparent way to buy companies for the long haul.
But in remaking financial markets in their image, ETFs have fueled a fear that indexed investing will trigger the next crisis. Evidence for that is patchy, but the allegations—that ETFs sever securities from their fundamentals, that they encourage volatility, that they erode market efficiency to the point of Marxism—feed a debate that ETF lovers and phobics alike have to embrace.
Big Trades
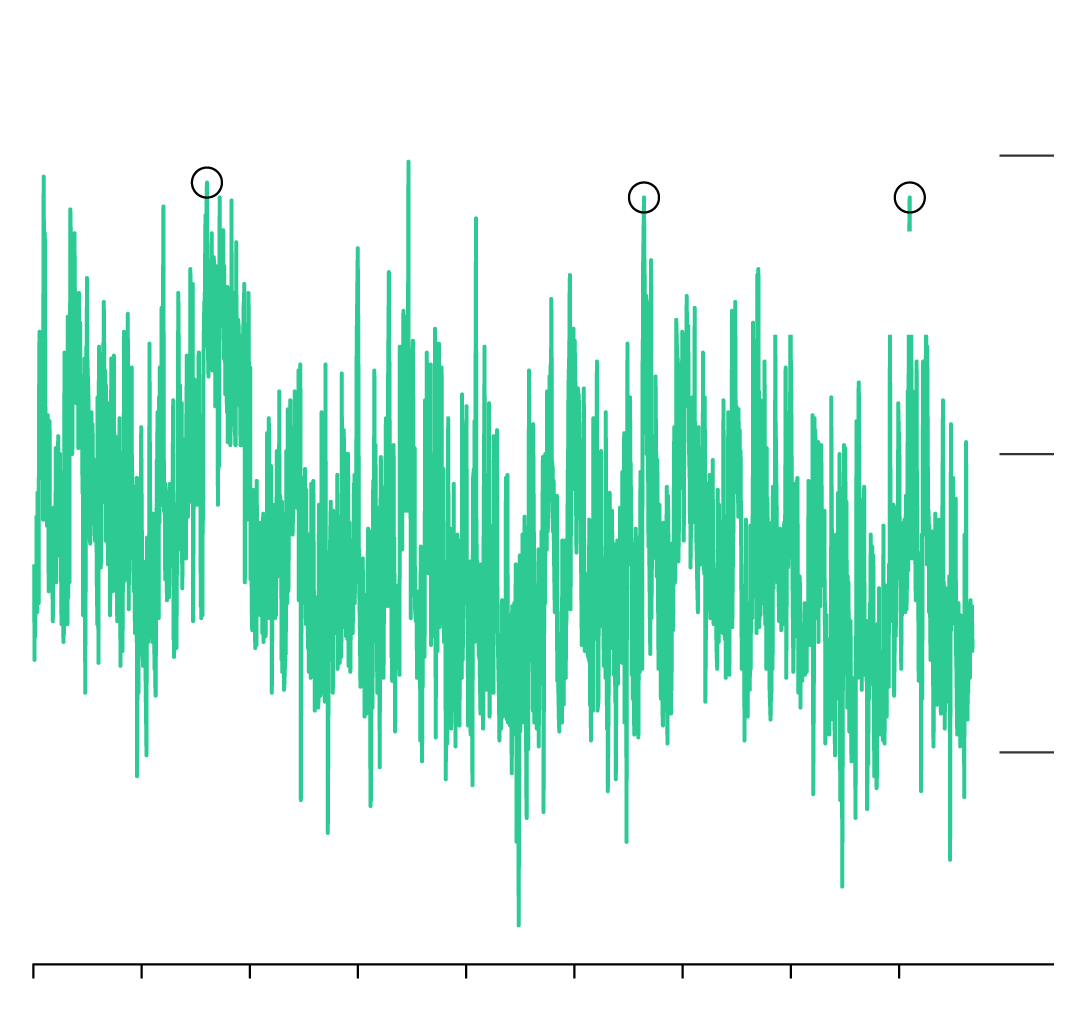
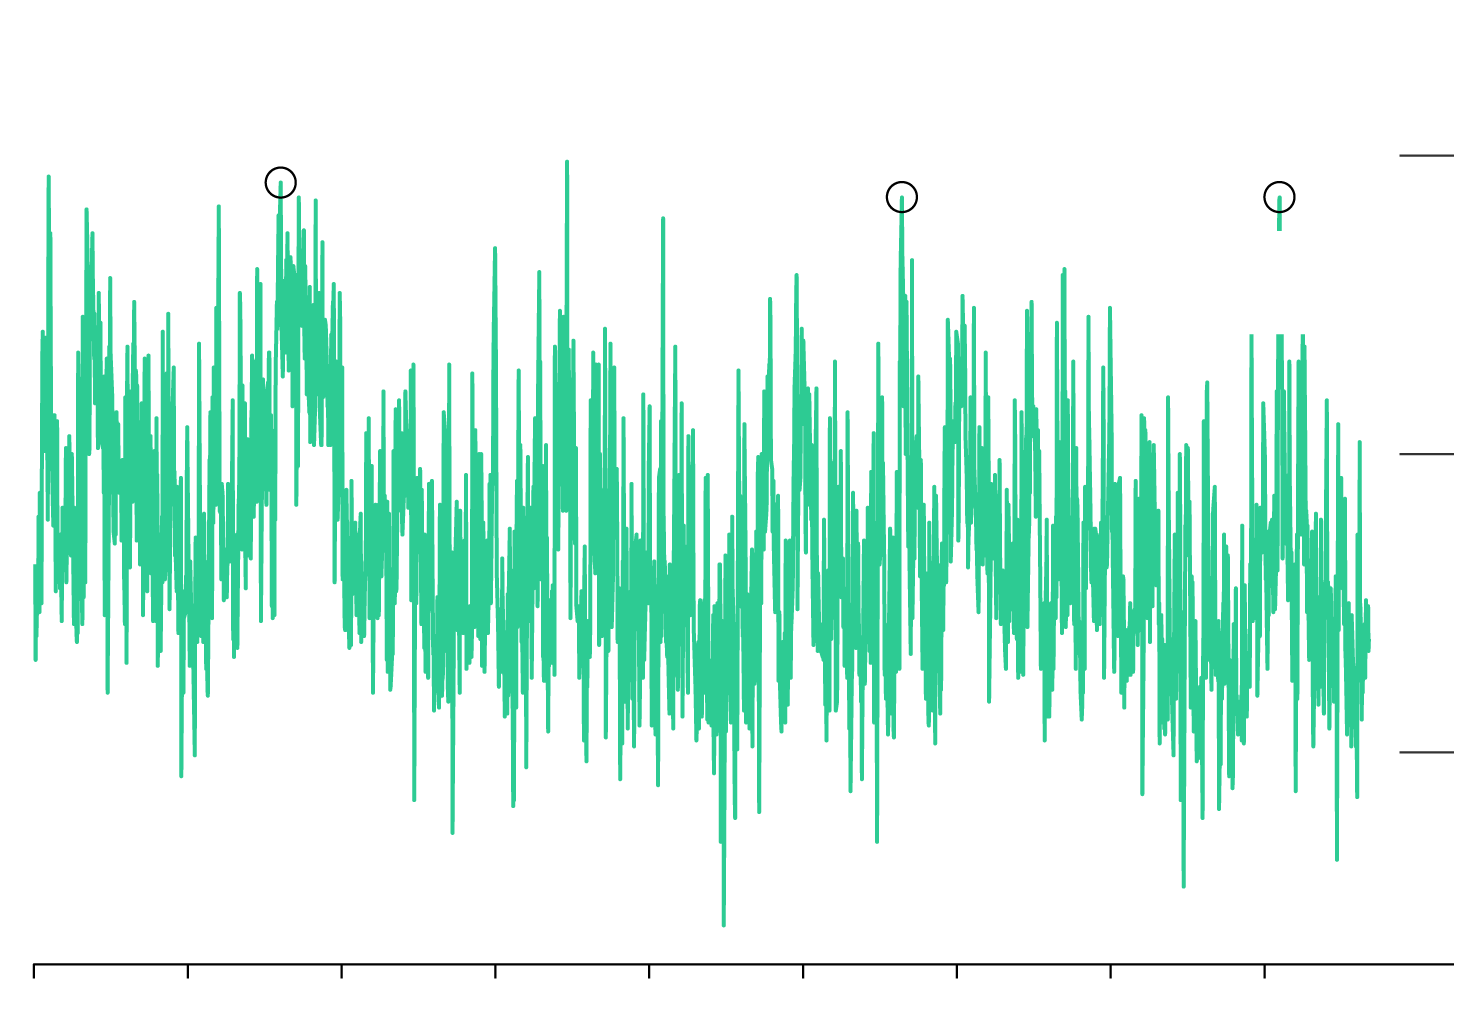
Trading in ETFs usually accounts for about a quarter of the daily volume in U.S. stock markets, but that can leap to nearly 40 percent on some days. These spikes typically coincide with surprise events or policy changes, with ETFs providing a speedy way to pursue a new opportunity or protect against emerging risks.
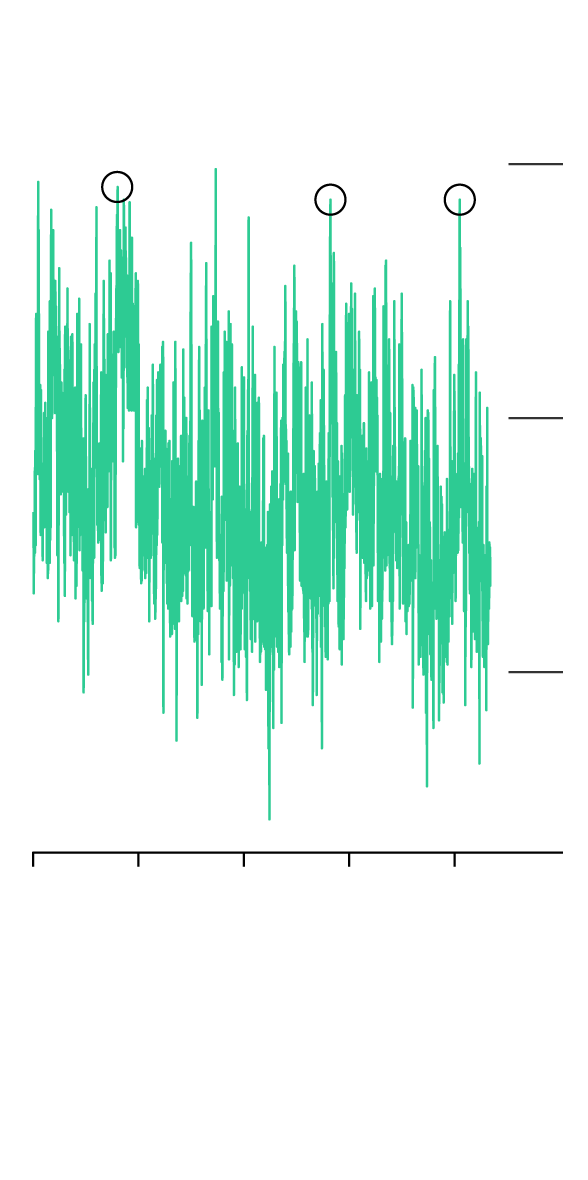
ETF turnover as % of total U.S. equity turnover
40
%
1
3
2
30
20
0
2010
2012
2014
2016
2018
1. August 5–10, 2011: S&P downgrades U.S. credit rating
2. August 21–27, 2015: China’s central bank devalues the yuan, roiling markets
3. February 5–6, 2018: U.S. stocks plunge the most in 6½ years
ETF turnover as % of total U.S. equity turnover
August 21–27, 2015:
China’s central bank devalues the yuan, roiling markets
August 5–10, 2011:
S&P downgrades U.S. credit rating
40
%
February 5–6, 2018:
U.S. stocks plunge the most in 6½ years
30
20
0
2010
2011
2012
2013
2014
2015
2016
2017
2018
ETF turnover as % of total U.S. equity turnover
August 21–27, 2015:
China’s central bank devalues the yuan, roiling markets
August 5–10, 2011:
S&P downgrades U.S. credit rating
40
%
February 5–6, 2018:
U.S. stocks plunge the most in 6½ years
30
20
0
2010
2011
2012
2013
2014
2015
2016
2017
2018
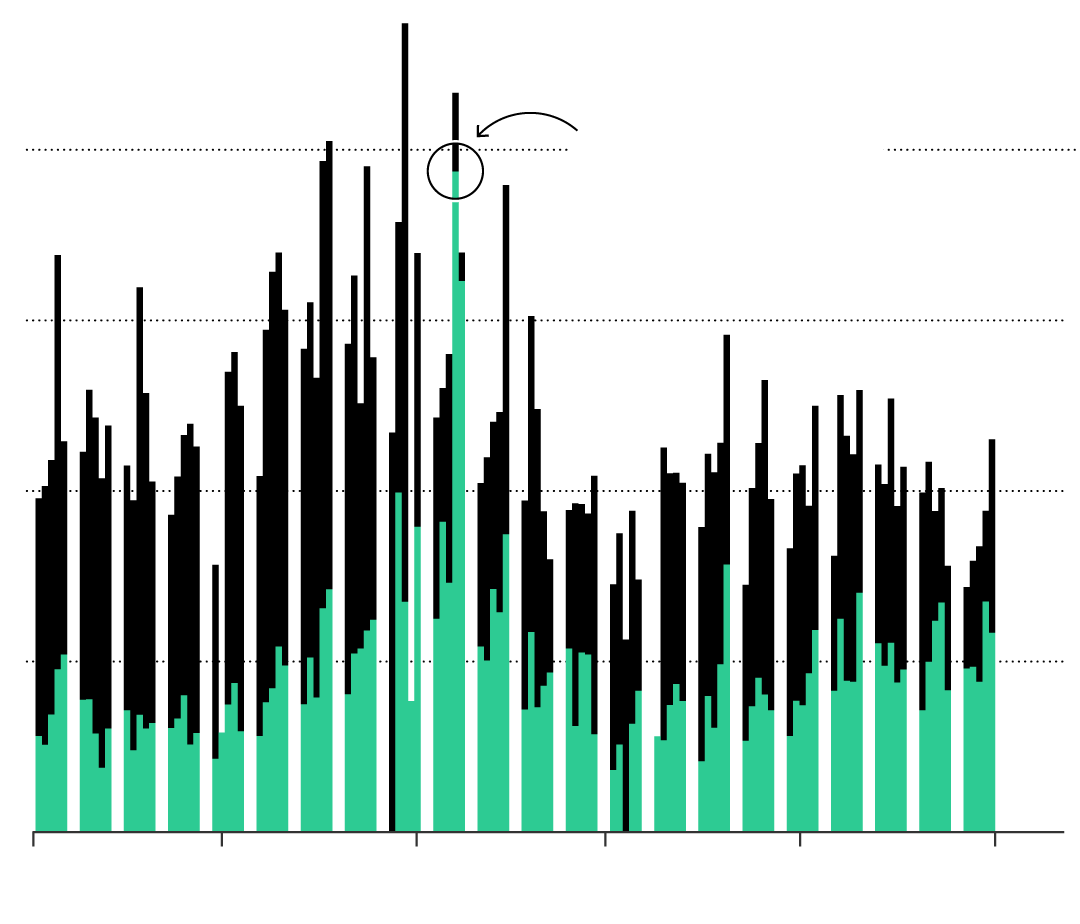
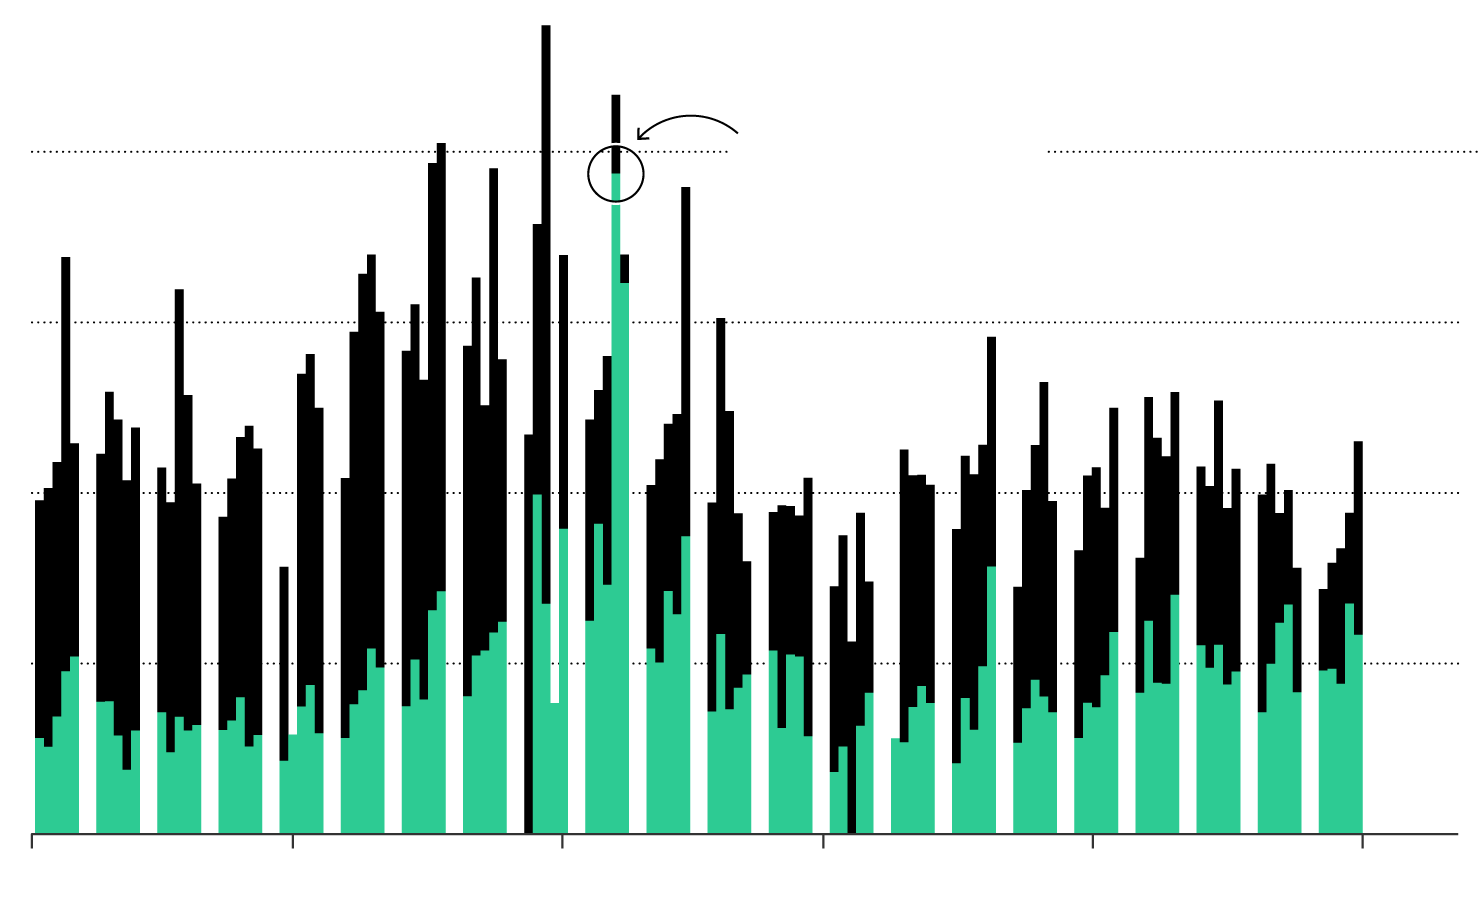
With the push of a button, traders at banks or the high-frequency firms that have largely taken their place driving markets can bet on news in the U.S., as well as issues affecting nations around the world. Think political crises in Brazil or economic sanctions on Turkey. ETFs proved useful when Greece’s local market shut down during the sovereign debt crisis, giving investors an outlet to trade. At times like these, ETFs step up and can absorb more volume than the local market itself.
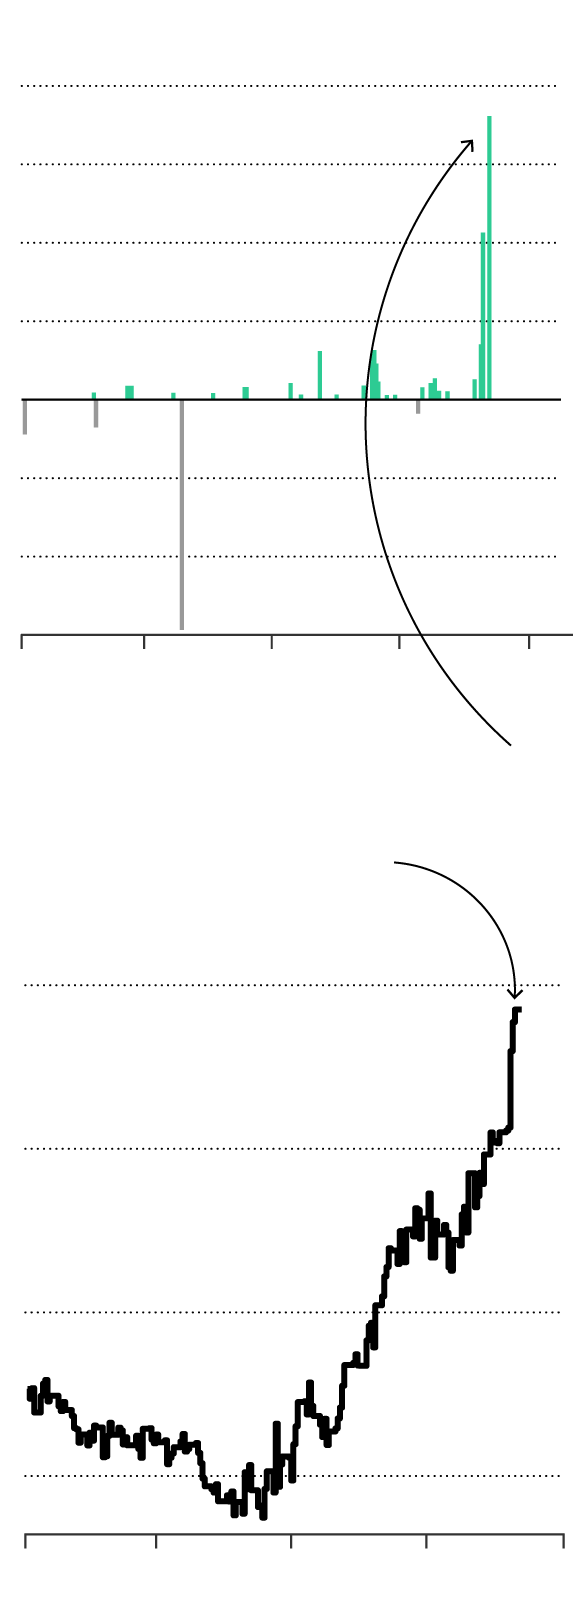
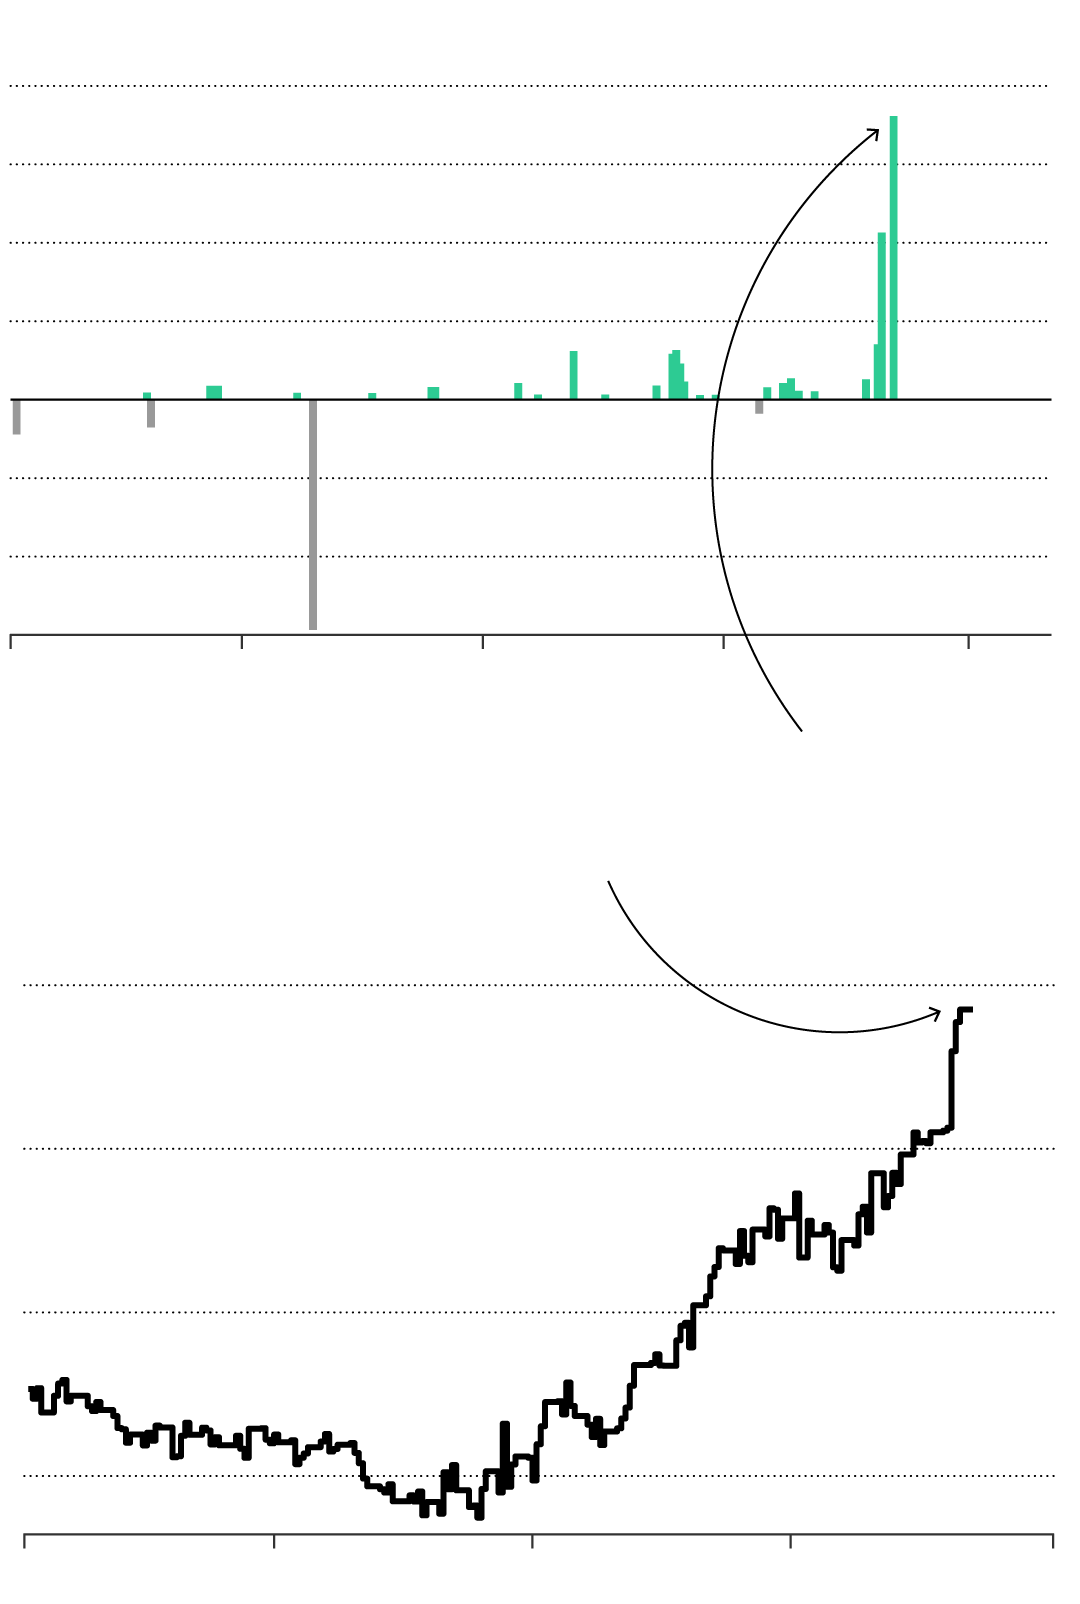
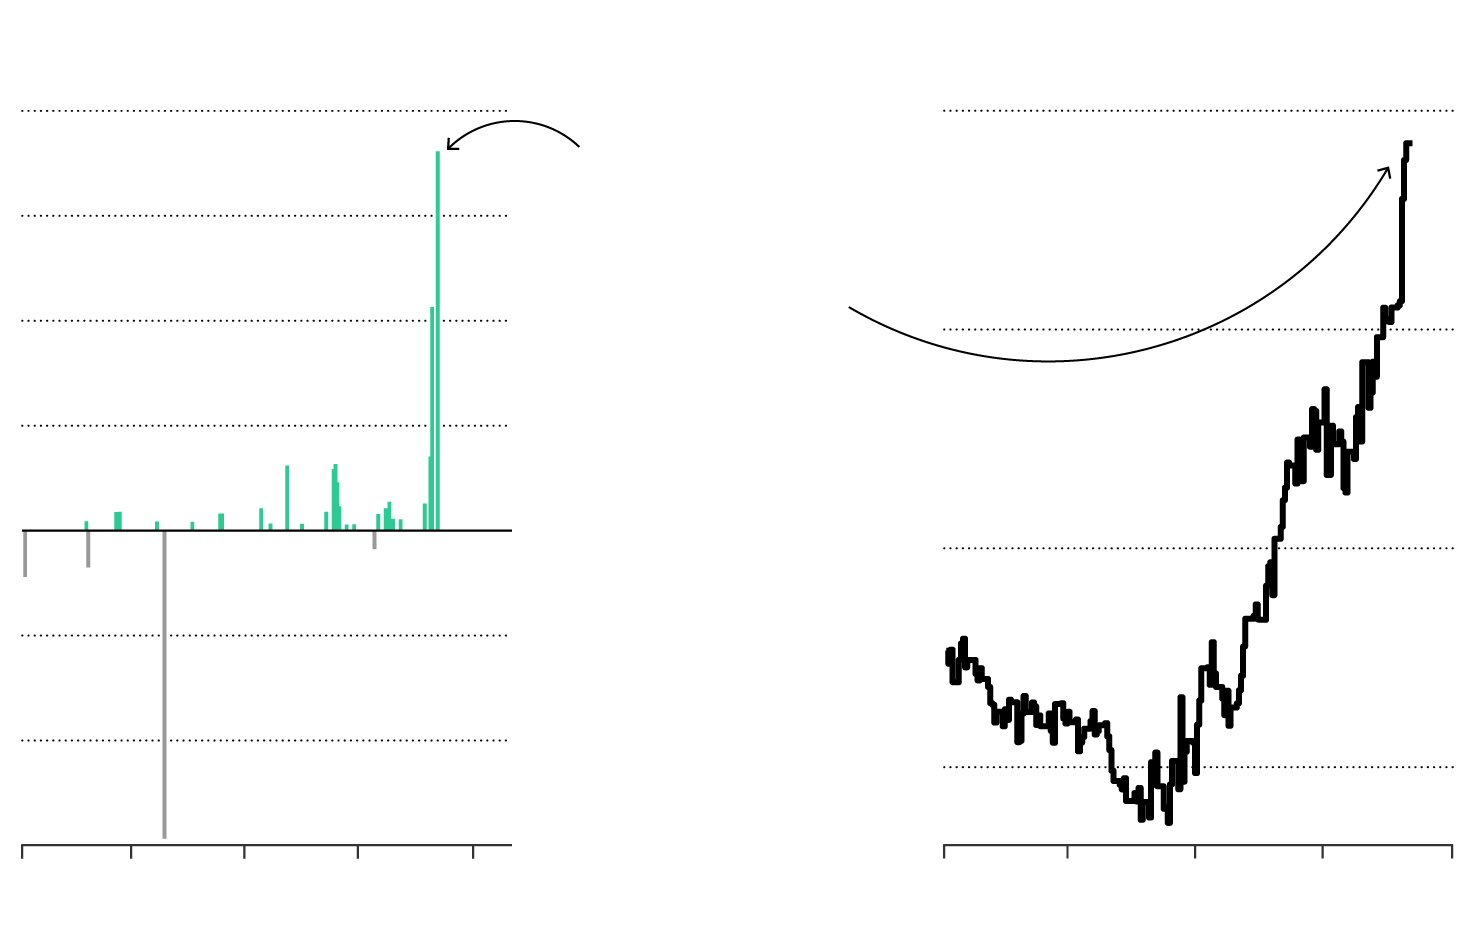
Turkey ETF inflows
$100M
75
50
25
0
–25
−50
−75
Jan
2018
Mar
May
Jul
Sep
BlackRock’s Turkey ETF saw its largest inflow in five years last month as investors sought to bet against the nation’s companies by creating shares to short.
Turkey ETF shares shorted
5M
4
3
2
Jan
Mar
May
Jul
Sep
Turkey ETF inflows
$100M
75
50
25
0
–25
−50
−75
Jan
2018
Mar
May
Jul
Sep
BlackRock’s Turkey ETF saw its largest inflow in five years last month as investors sought to bet against the nation’s companies by creating shares to short.
Turkey ETF shares shorted
5M
4
3
2
Jan
Mar
May
Jul
Sep
Turkey ETF inflows
Turkey ETF shares shorted
$100M
5M
BlackRock’s Turkey ETF saw its largest inflow in five years last month as investors sought to bet against the nation’s companies by creating shares to short.
75
50
4
25
0
3
–25
−50
2
−75
Jan
2018
Jan
Mar
May
Jul
Sep
Mar
May
Jul
Sep
- Ibovespa equity index turnover
- ETF turnover

$4B
June 7, 2018
Brazil ETF turnover of $3,871,406,080
3
2
1
0
Apr
2018
May
Jun
Jul
Aug
Sep
$4B
June 7, 2018
Brazil ETF turnover of $3,871,406,080
3
2
1
0
Apr
2018
May
Jun
Jul
Aug
Sep
$4B
June 7, 2018
Brazil ETF turnover of $3,871,406,080
3
2
1
0
Apr
2018
May
Jun
Jul
Aug
Sep
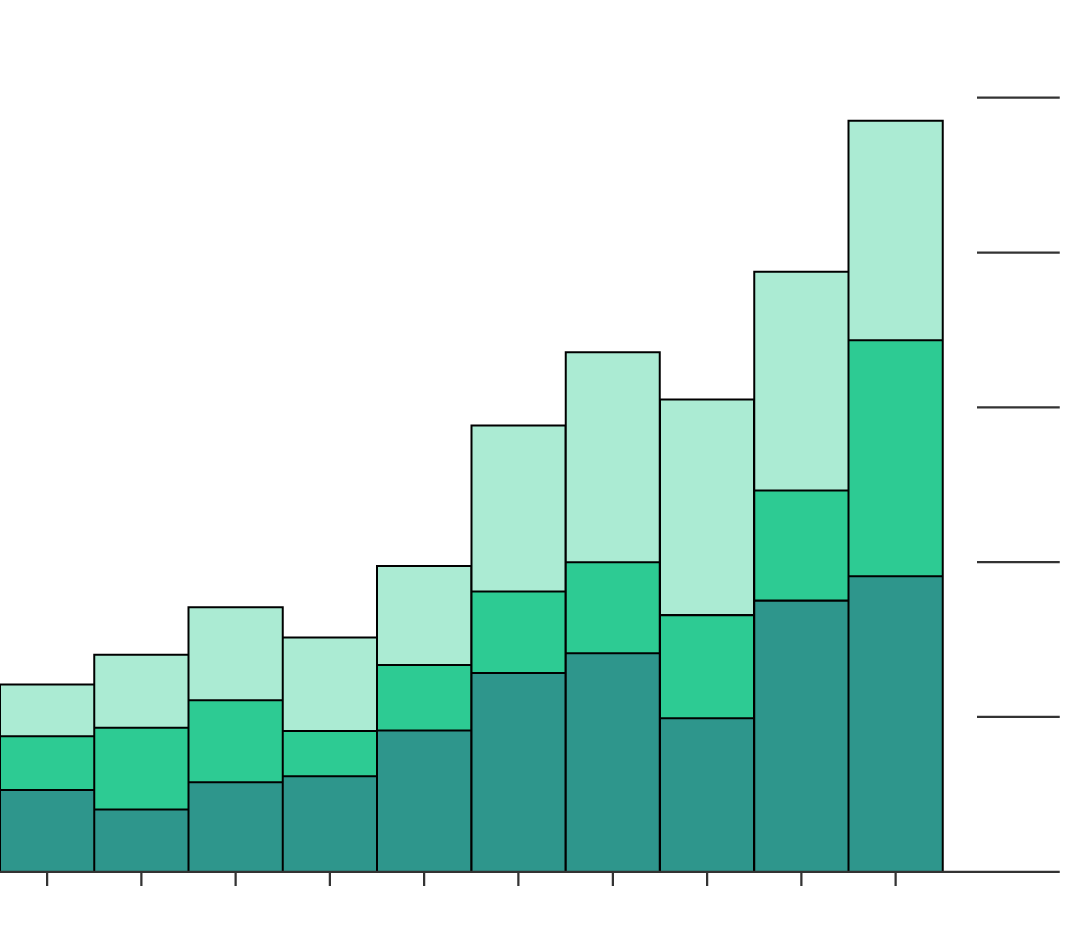
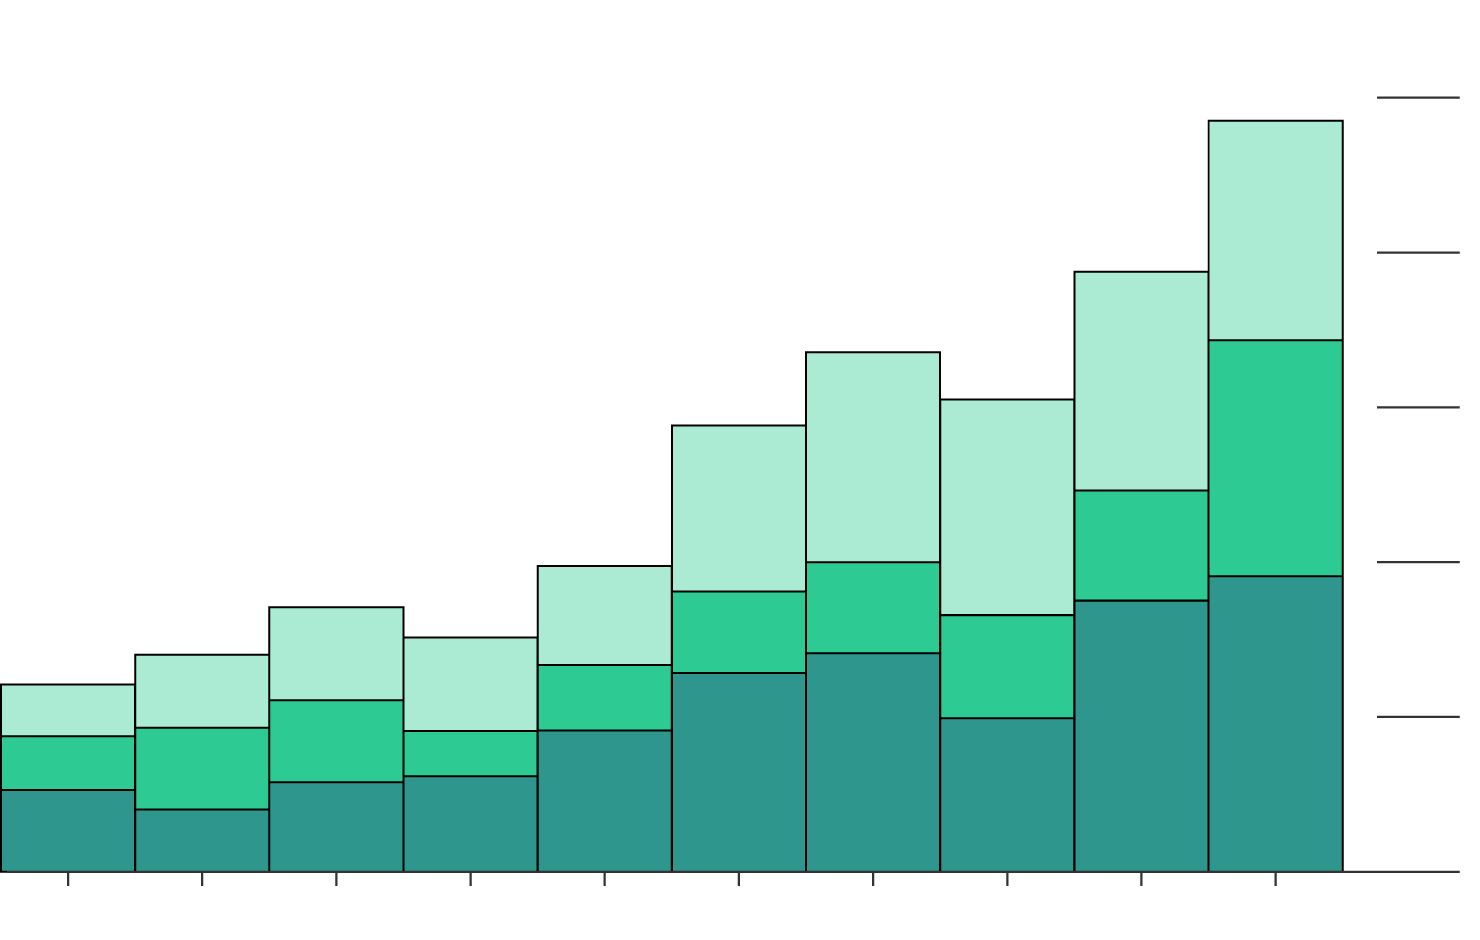
Maturing Uses
This reach has helped lure new investors who have traditionally advocated for active management. Hedge funds, pension plans and insurers are increasingly using these funds to trade in and out of positions and as the low-cost core of their portfolios. Other institutions are using ETFs in lieu of futures or credit-default swaps, and some are even using these vehicles to more efficiently buy or sell the underlying securities.
- Insurance company
- Pension fund
- Hedge fund
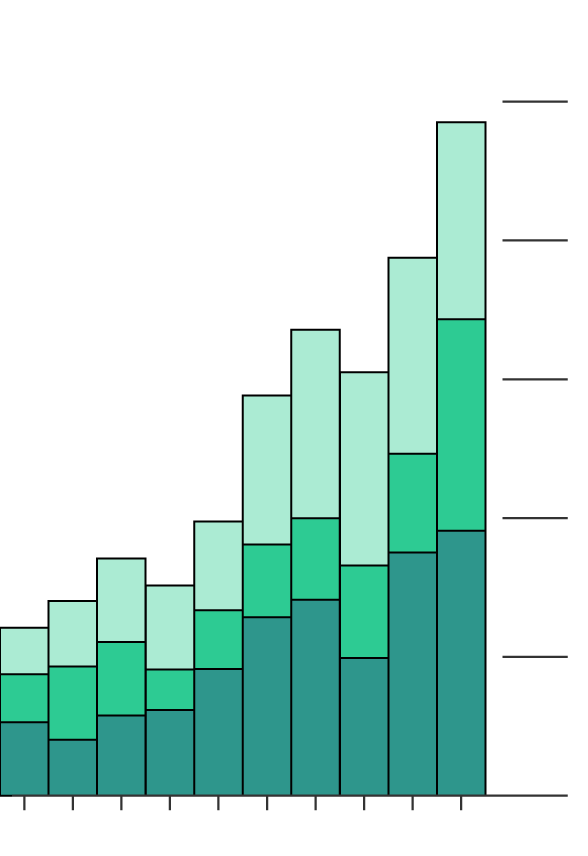
ETF assets held
$125
B
100
75
50
25
0
’08
’09
’10
’11
’12
’13
’14
’15
’16
’17
ETF assets held
$125
B
100
75
50
25
0
2008
2009
2010
2011
2012
2013
2014
2015
2016
2017
ETF assets held
$125
B
100
75
50
25
0
2008
2009
2010
2011
2012
2013
2014
2015
2016
2017
To satisfy these sophisticates, issuers have added new products miles removed from the humble S&P 500 Index. Want a leveraged bet on volatility? Or an inverse geared wager on the death of the mall? Anyone with a brokerage account can now play alongside the professionals. Both also have their pick of a swath of so-called smart-beta strategies tracking indexes that shun traditional market-capitalization weightings. These products promise targeted access to momentum stocks or undervalued companies.
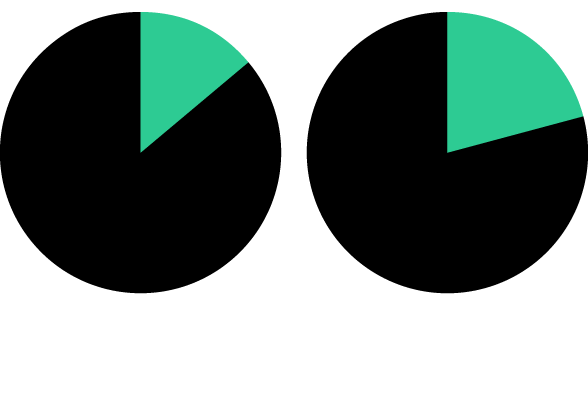
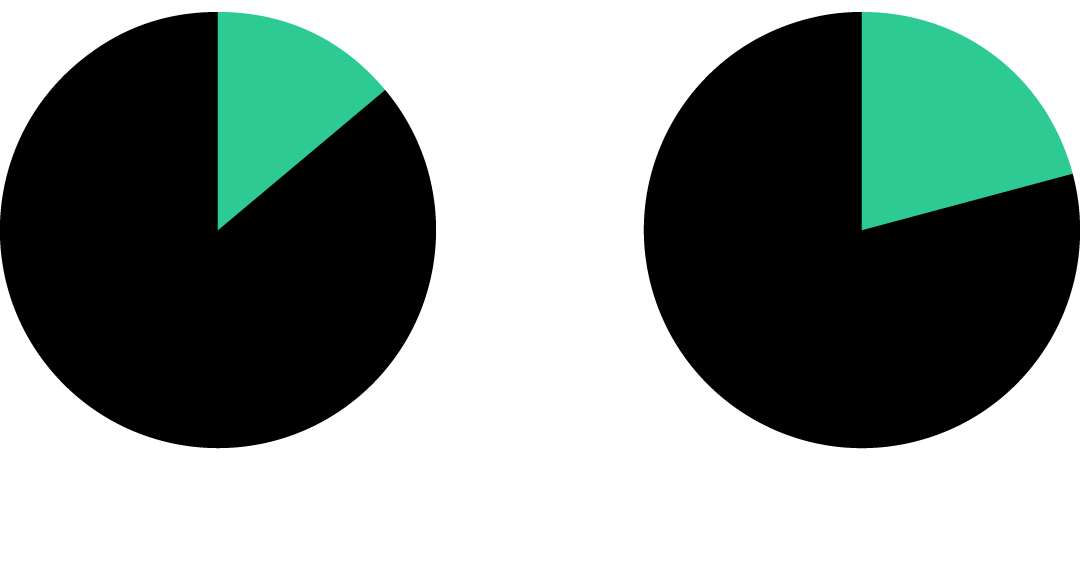
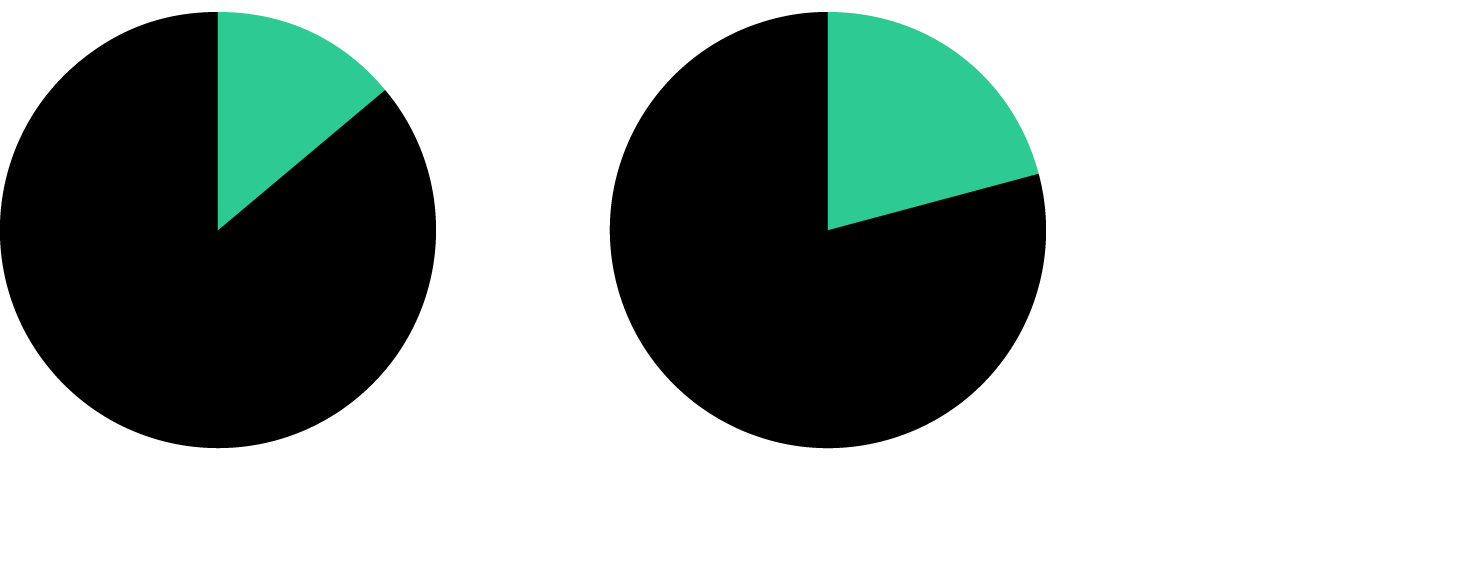
13.9%
2008
20.9%
2017
13.9%
2008
20.9%
2017
13.9%
2008
20.9%
2017
But even as ETFs grow more sophisticated in terms of products, users and uses, ordinary investors still account for more than half of the assets. The reality is that if your grandma owns an emerging-markets ETF, she’s sitting alongside the likes of Bridgewater Associates and a Singaporean sovereign wealth fund. Issuers are committed to making sure that retail money sticks around, cutting fees on ETFs to as low as 30 cents for every $1,000 invested.
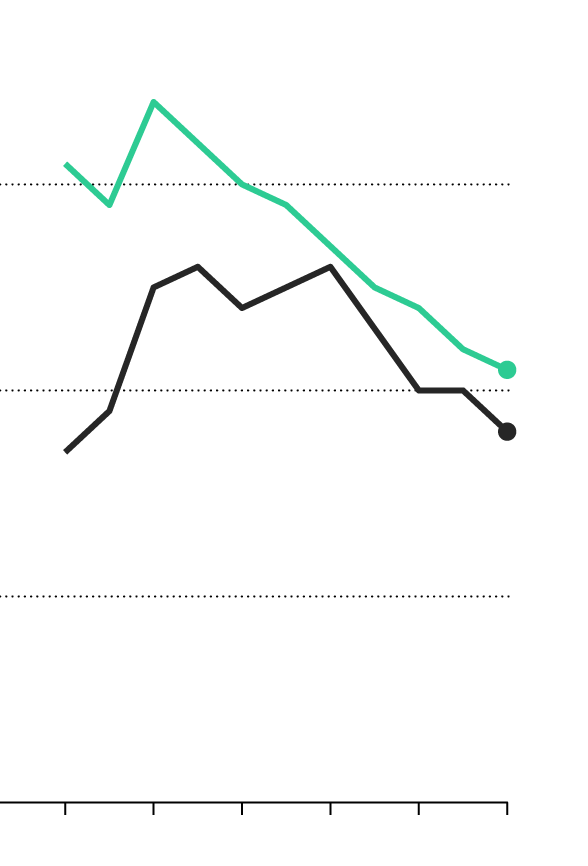
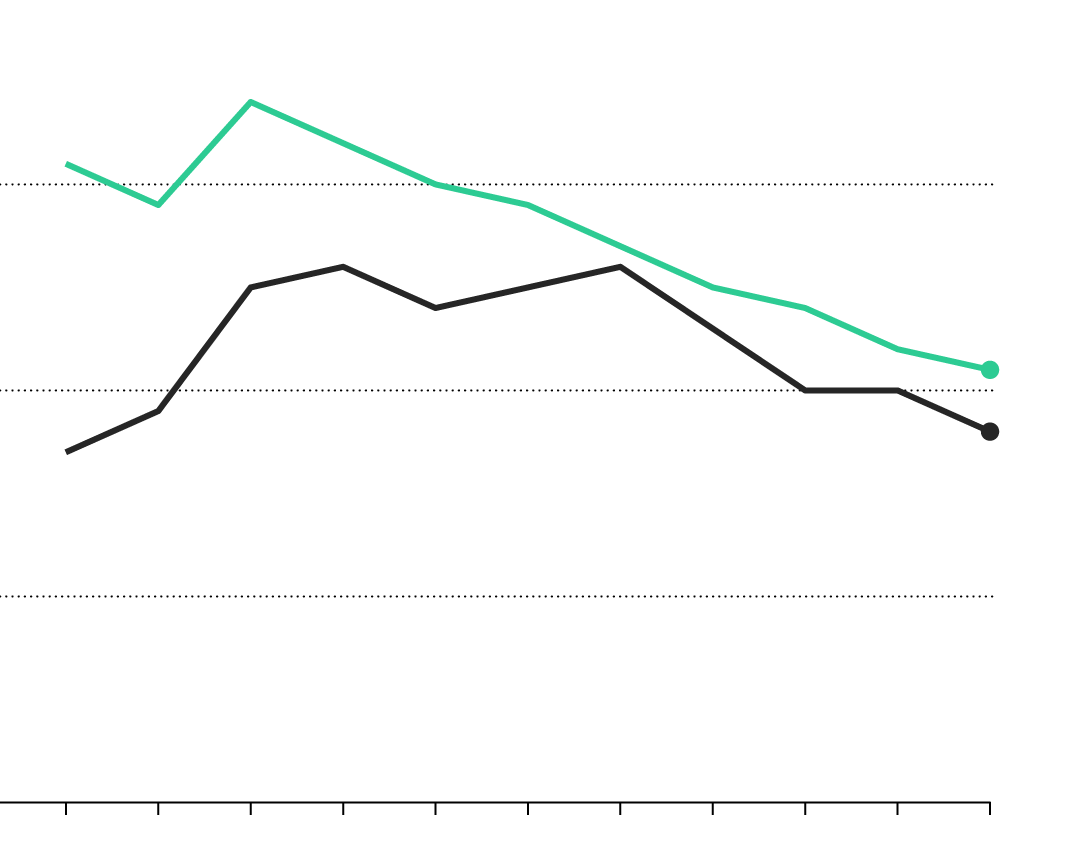
Asset-weighted average expense ratios for U.S.-listed ETFs, in basis points
30
21 bps
Equity ETFs
20
18 bps
Bond ETFs
10
0
2007
2009
2011
2013
2015
2017
Asset-weighted average expense ratios for U.S.-listed ETFs, in basis points
30
21 bps
Equity ETFs
20
18 bps
Bond ETFs
10
0
2007
2008
2009
2010
2011
2012
2013
2014
2015
2016
2017

Asset-weighted average expense ratios for U.S.-listed ETFs, in basis points
30
21 bps
Equity ETFs
20
18 bps
Bond ETFs
10
0
2007
2008
2009
2010
2011
2012
2013
2014
2015
2016
2017
Different investment profiles and horizons arguably make funds more stable, but protecting the little guy is something U.S. regulators are thinking about as ETFs top $3.7 trillion in assets. For issuers now looking to expand globally, it’s one risk they’ll need to address to successfully spread around the world.

$3.7T
United States of America
$394.8B
United Kingdom
$309.9B
Japan
France
Germany
Israel
Canada
S. Korea
Switzerland
Hong Kong
Other countries
China

$3.7T
United States of America
Switzer-
land
China
Germany
Canada
$394.8B
United Kingdom
$309.9B
Japan
Hong
Kong
Other
countries
Israel
France
South
Korea

$394.8B
United Kingdom
$3.7T
United States of America
$309.9B
Japan
Germany
France
Canada
Israel
Switzerland
Hong
Kong
South
Korea
Australia
Other
countries
China
Taiwan
Note: As of September 7, 2018.