The Global Economy Is Still Feeling the Lehman Fallout 10 Years Later
The collapse of Lehman Brothers and subsequent global financial crisis sent shockwaves through the world economy, many of which still reverberate a decade later.
The deepest international recession since the Great Depression prompted central banks to deliver massive and unorthodox monetary stimulus, while governments either eased fiscal policy or delivered austerity depending on the country.
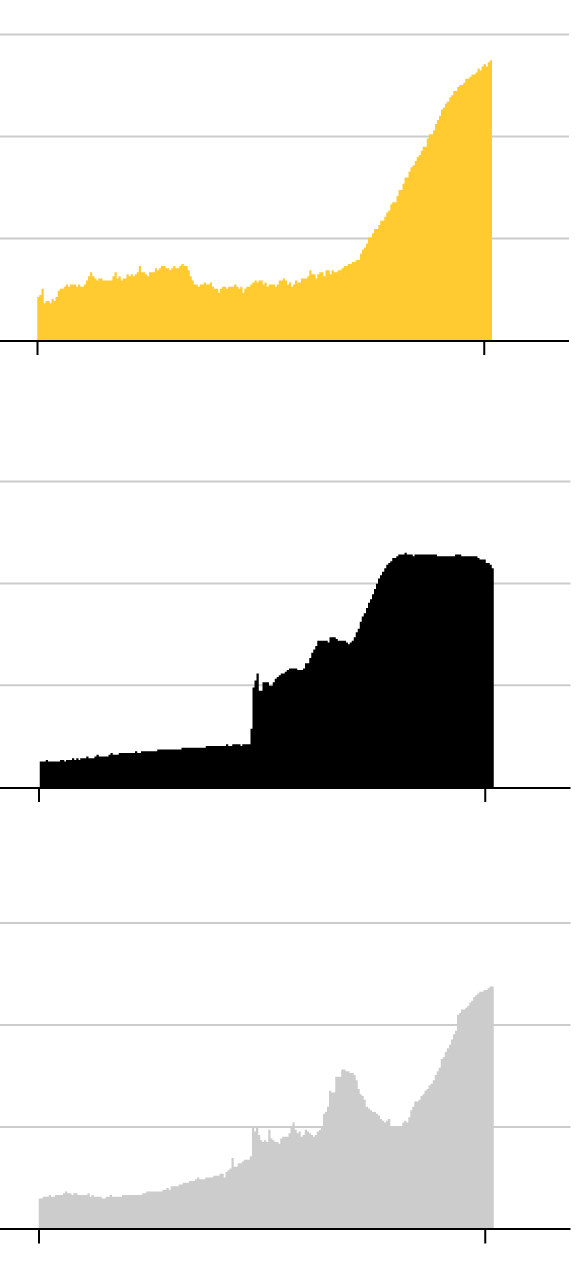
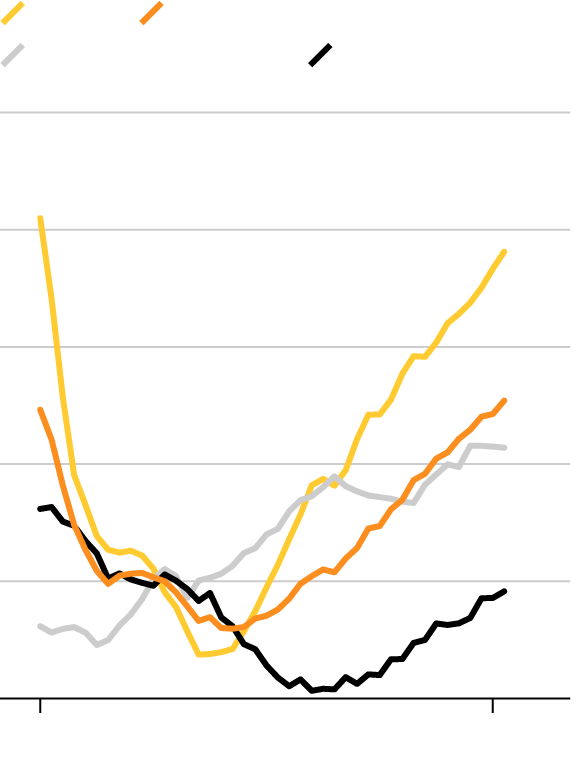
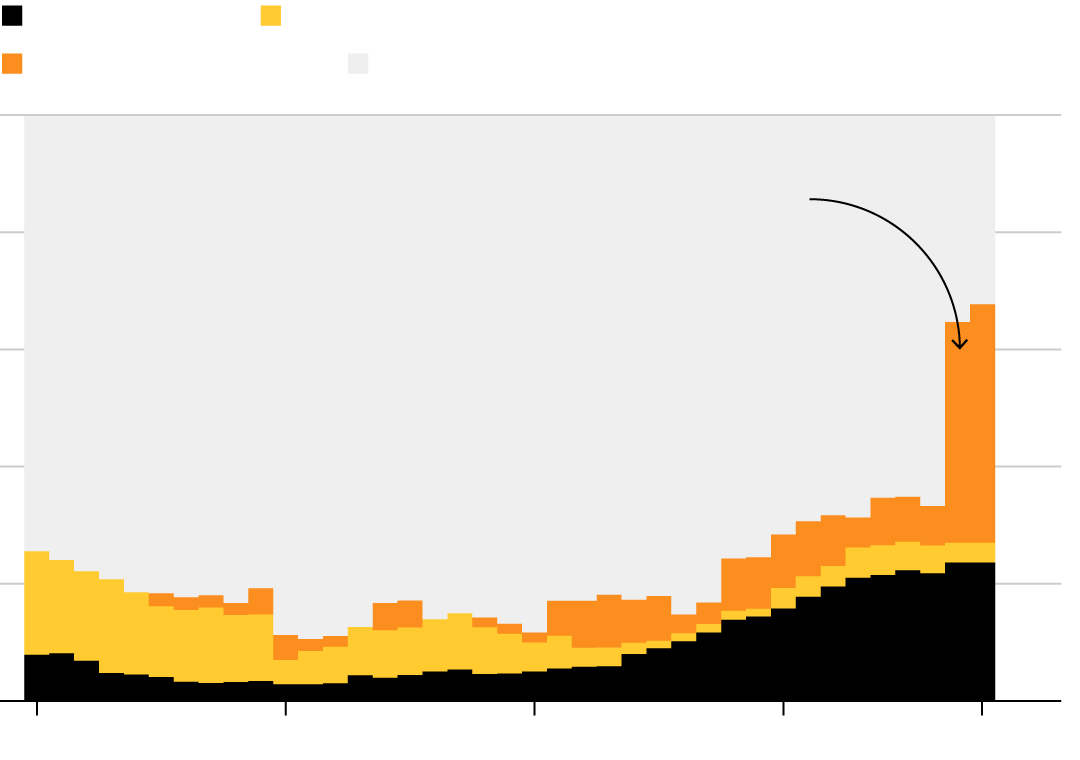
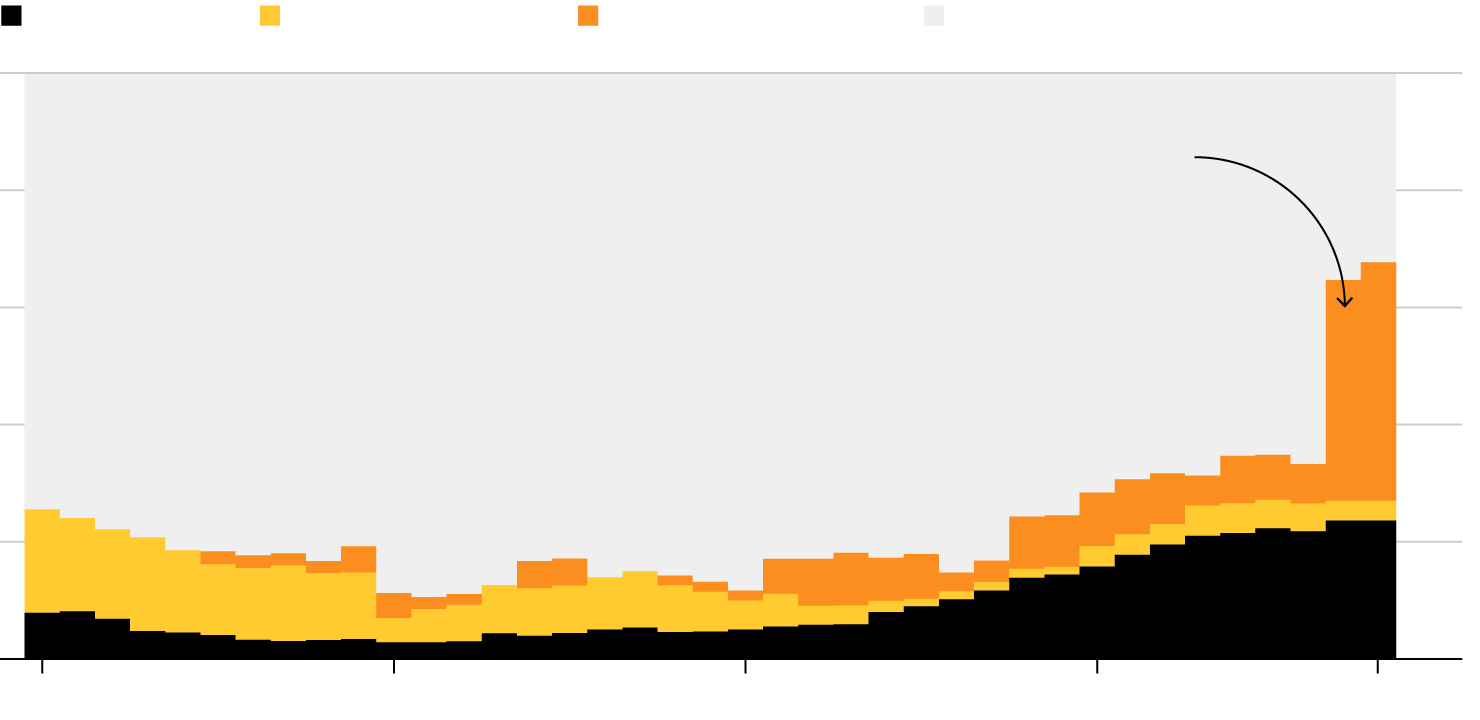
Central Bank Balance Sheets
¥600T
Bank of Japan
400
200
0
2018
2000
$6T
Federal Reserve
4
2
0
2000
2018
€6T
European Central Bank
4
2
0
2000
2018
Bank of Japan
Federal Reserve
European Central Bank
¥600T
$6T
€6T
4
400
4
200
2
2
0
0
0
2018
2018
2018
2000
2000
2000
Bank of Japan
Federal Reserve
European Central Bank
¥600T
$6T
€6T
4
400
4
200
2
2
0
0
0
2000
2018
2000
2018
2000
2018
Having cut interest rates to almost zero or even lower in some cases, central banks started buying bonds in a bid to reignite animal spirits among companies and consumers. The result? An unprecedented swelling of their balance sheets which while set to peak is unlikely to ever be reversed.
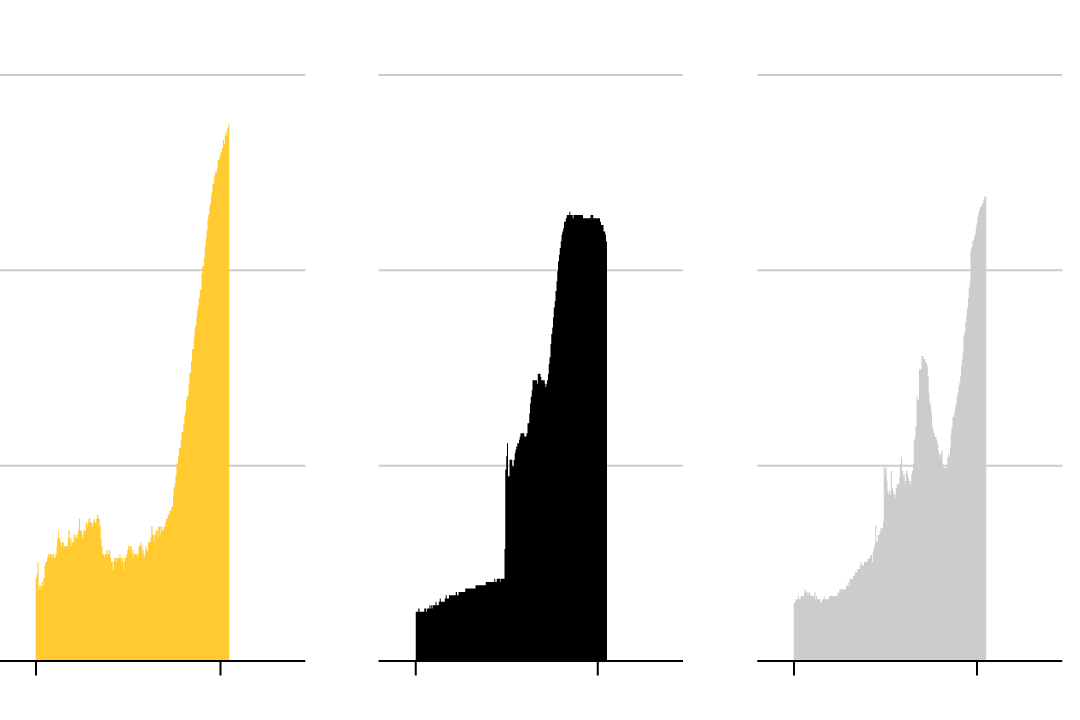
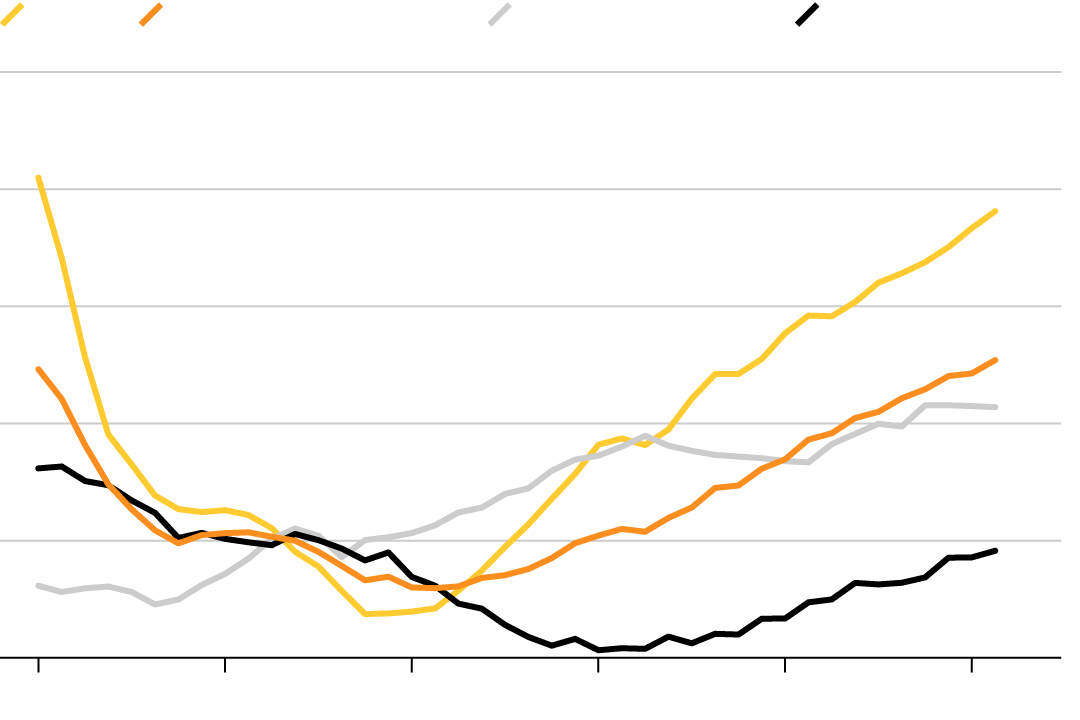
Government Debt
Japan
Greece
U.S.
U.K.
Euro area
Turkey
250% of GDP
200
150
100
50
0
2007
2023

Japan
Greece
U.S.
U.K.
Euro area
Turkey
250% of GDP
200
150
100
50
0
2007
2011
2015
2018
2023
Japan
Greece
U.S.
U.K.
Euro area
Turkey
250% of GDP
200
150
100
50
0
2007
2010
2015
2020
2023
For all the talk of austerity, government debts in most parts of the world are larger now than in 2007, potentially a risk for economies in the future as central bankers tighten monetary policy.
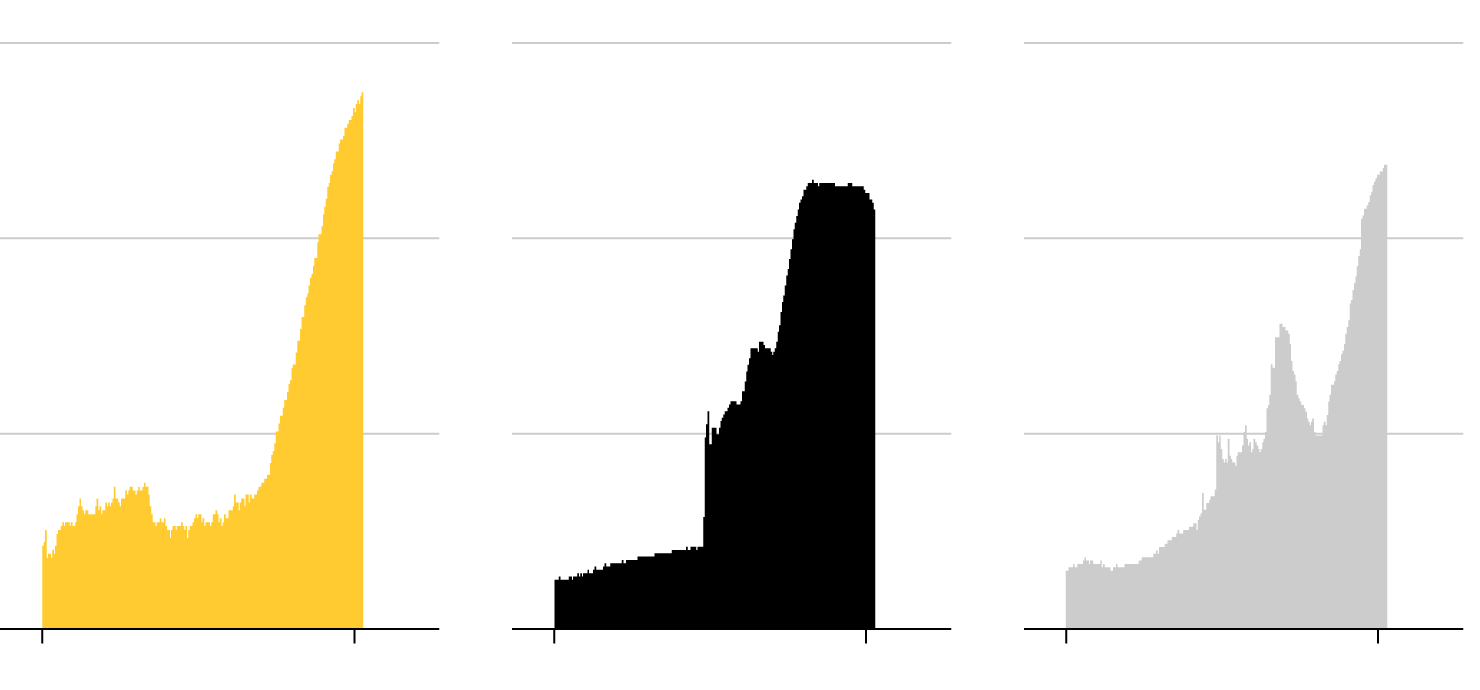
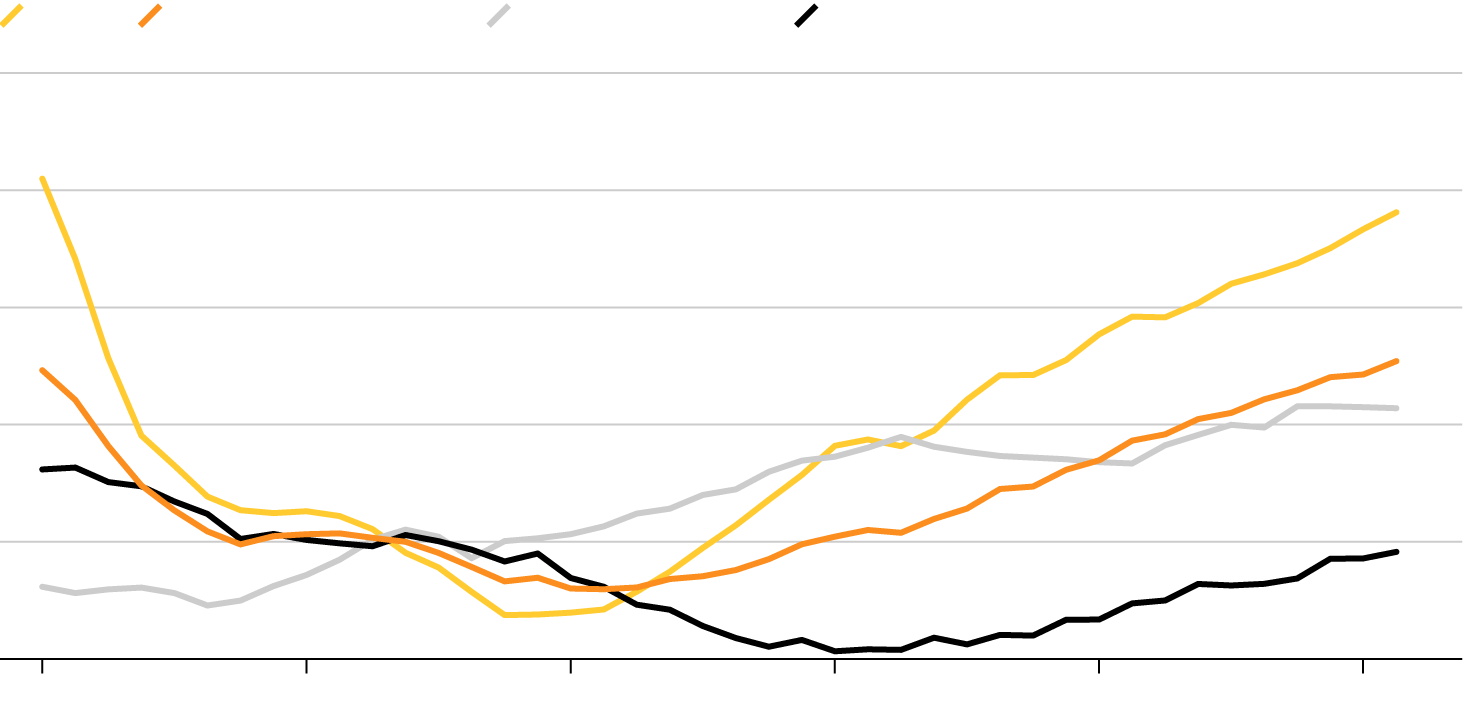
Economic Output

World
U.S.
6%
4%
4
2
2
0
0
-2
-2
-4
2007
2017
2007
2017
China
Euro area
5%
20%
15
0
10
-5
5
-10
2007
2017
2007
2017
Japan
Greece
5%
5%
0
0
-5
-5
-10
-10
2007
2017
2007
2017
World
U.S.
China
6%
4%
20%
4
2
15
2
0
10
0
-2
-2
-4
5
2007
2017
2007
2017
2007
2017
5%
5%
Euro area
Japan
Greece
5%
0
0
0
-5
-5
-5
-10
-10
-10
2007
2017
2007
2017
2007
2017
World
U.S.
China
6%
4%
20%
4
2
15
2
0
10
0
-2
-2
-4
5
2007
2017
2007
2017
2007
2017
Euro area
Japan
Greece
5%
5%
5%
0
0
0
-5
-5
-5
-10
-10
-10
2007
2017
2007
2017
2007
2017
The world economy collapsed into its deepest recession since World War II in the wake of the crisis, yet after initially bouncing, most economies showed only moderate growth for most of the past decade.
Unemployment
Africa
Americas
Arab states
Asia and the Pacific
Europe and central Asia
200M
150
100
50
0
2000
2005
2010
2015
2020
Africa
Americas
Arab states
Asia and the Pacific
Europe and central Asia
200M
150
100
50
0
2000
2005
2010
2015
2020
Africa
Americas
Arab states
Asia and the Pacific
Europe and central Asia
200M
150
100
50
0
2000
2005
2010
2015
2020
Some 25 million more people are now unemployed than back in 2007 even as the U.S. jobless rate falls. Particularly eye-catching is the youth unemployment rate in countries such as Greece, where—while down from over 60 percent in 2013—it’s still hovering at 40 percent.
G-7 Wages
Canada
France
3%
4%
2
2
1
0
0
-1
-2
2008
2017
2008
2017
Germany
Italy
3%
2%
0
2
1
-2
0
-4
2008
2017
2008
2017
4%
2%
Japan
U.K.
2
0
0
-2
-2
-4
2008
2017
2008
2017
U.S.
3%
2
1
0
-1
2008
2017
Canada
France
Germany
Italy
3%
4%
3%
2%
2
0
2
2
1
0
1
-2
0
-1
-2
0
-4
2008
2017
2008
2017
2008
2017
2008
2017
4%
2%
Japan
U.K.
U.S.
3%
2
2
0
1
0
-2
0
-2
-4
-1
2008
2017
2008
2017
2008
2017
Canada
France
Germany
Italy
3%
4%
3%
2%
2
0
2
2
1
0
1
-2
0
-1
-2
0
-4
2008
2017
2008
2017
2008
2017
2008
2017
4%
2%
Japan
U.K.
U.S.
3%
2
2
0
1
0
-2
0
-2
-4
-1
2008
2017
2008
2017
2008
2017
Source: OECD
The lackluster recovery is best evidenced by the lack of wage pressures across most of the world even as hiring strengthens.
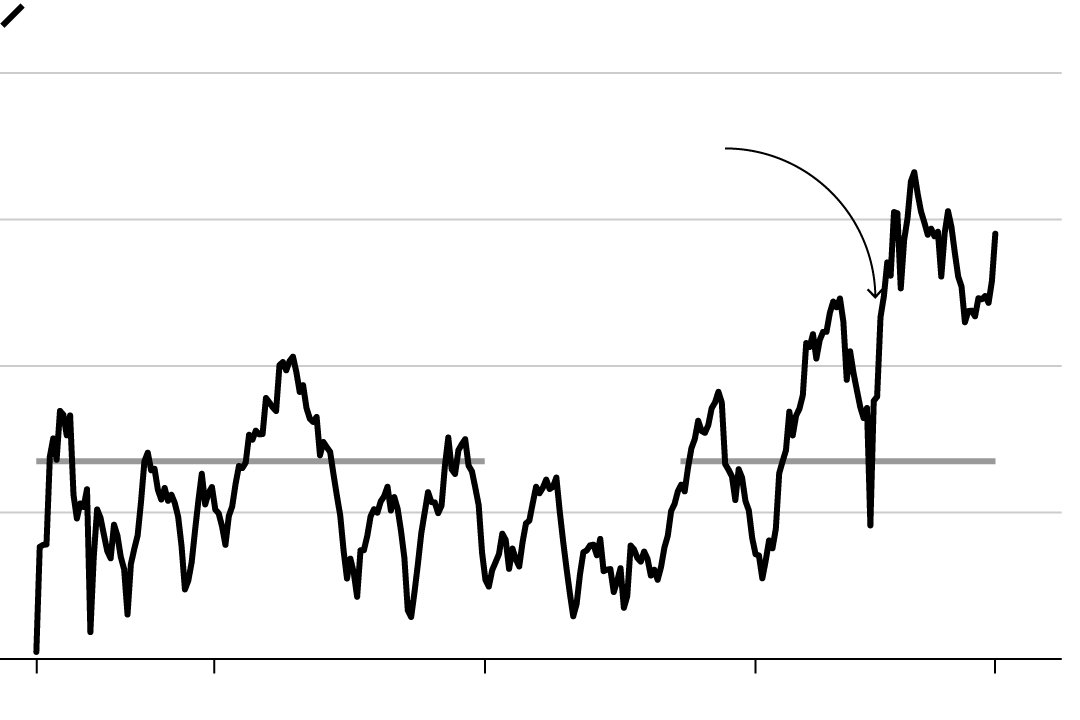
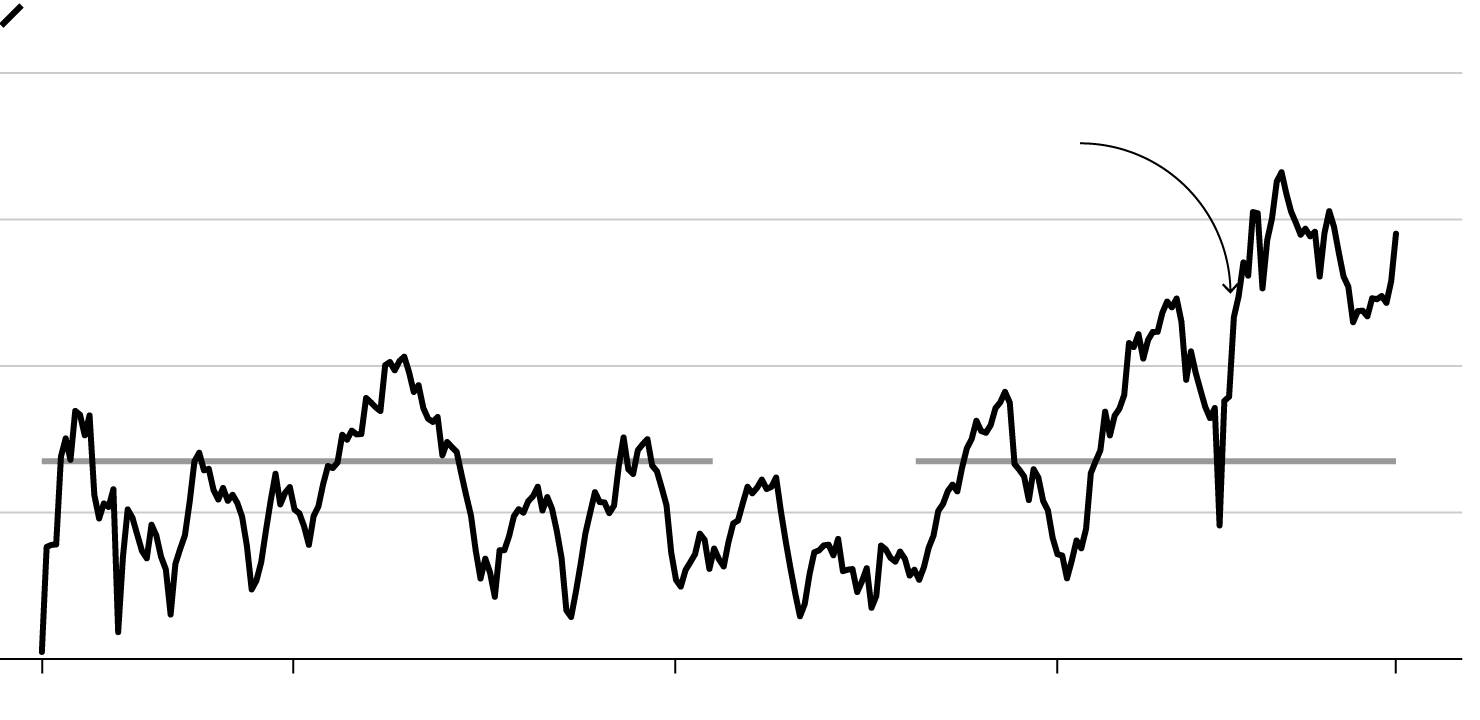
Robust U.S. Corporate Profits Have Coincided With a Strong Stock Market
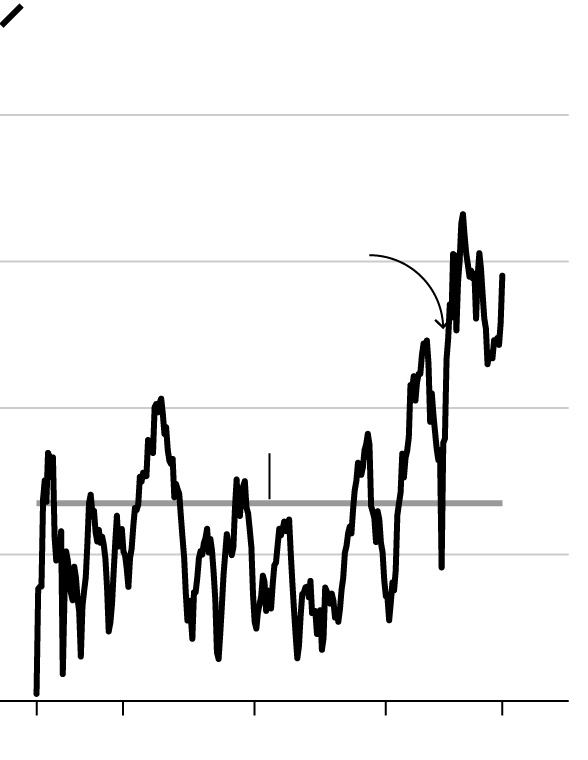
Quarterly after-tax profits (with IVA, CCA)
share of nominal GDP
12%
10
Expansion
starts
8
Average 6.7%
6
4
1947
1960
1980
2000
2018
Quarterly after-tax profits (with IVA, CCA) share of nominal GDP
12%
Expansion
starts
10
8
Average 6.7%
6
4
1947
1960
1980
2000
2018
Quarterly after-tax profits (with IVA, CCA) share of nominal GDP
12%
Expansion
starts
10
8
Average 6.7%
6
4
1947
1960
1980
2000
2018
If there has been a winner of the past 10 years it’s the corporate sector, which in an age of easy money has seen its stock prices soar and profits start to rise.
House Prices
U.S.
Advanced economies
Emerging markets
Euro area
140
130
120
110
100
90
2008
2018
U.S.
Advanced economies
Emerging markets
Euro area
140
130
120
110
100
90
2008
2010
2012
2014
2016
2018
U.S.
Advanced economies
Emerging markets
Euro area
140
130
120
110
100
90
2008
2010
2012
2014
2016
2018
At the heart of the crisis, house prices have now recovered in most corners of the world, exacerbating the gap between those with assets and those without.
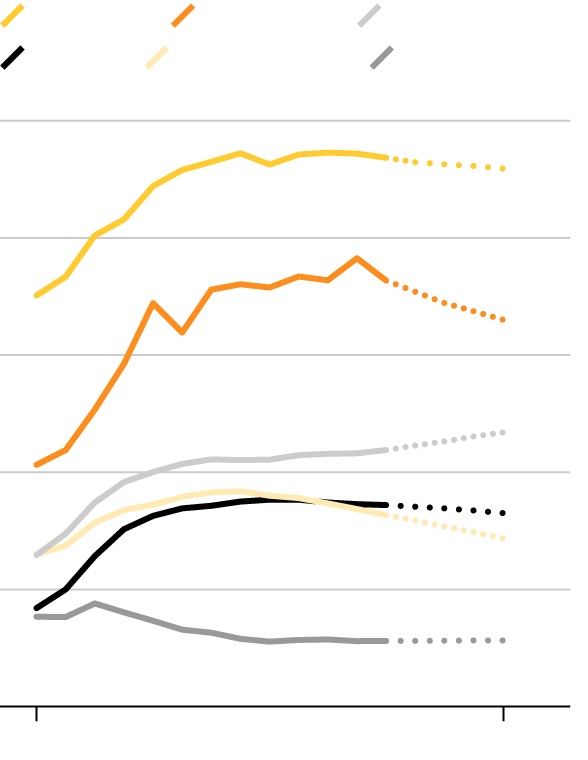
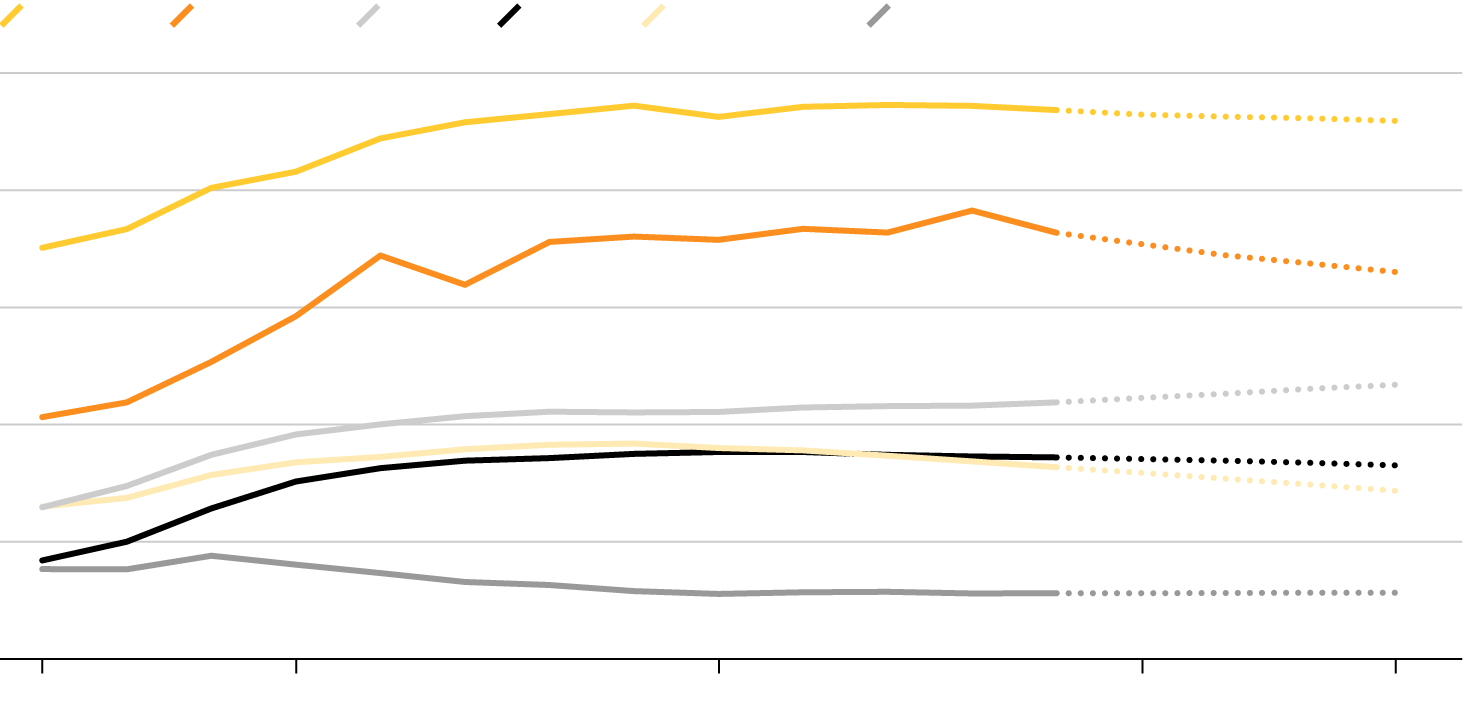
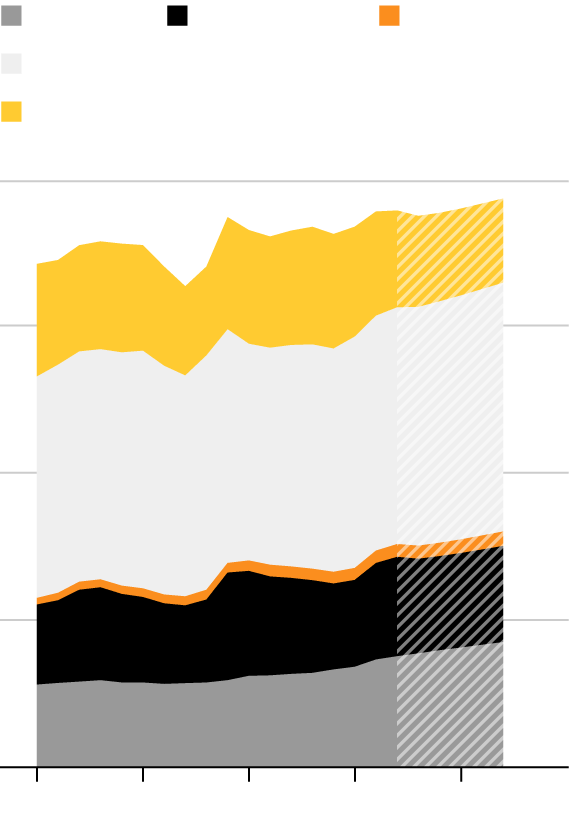
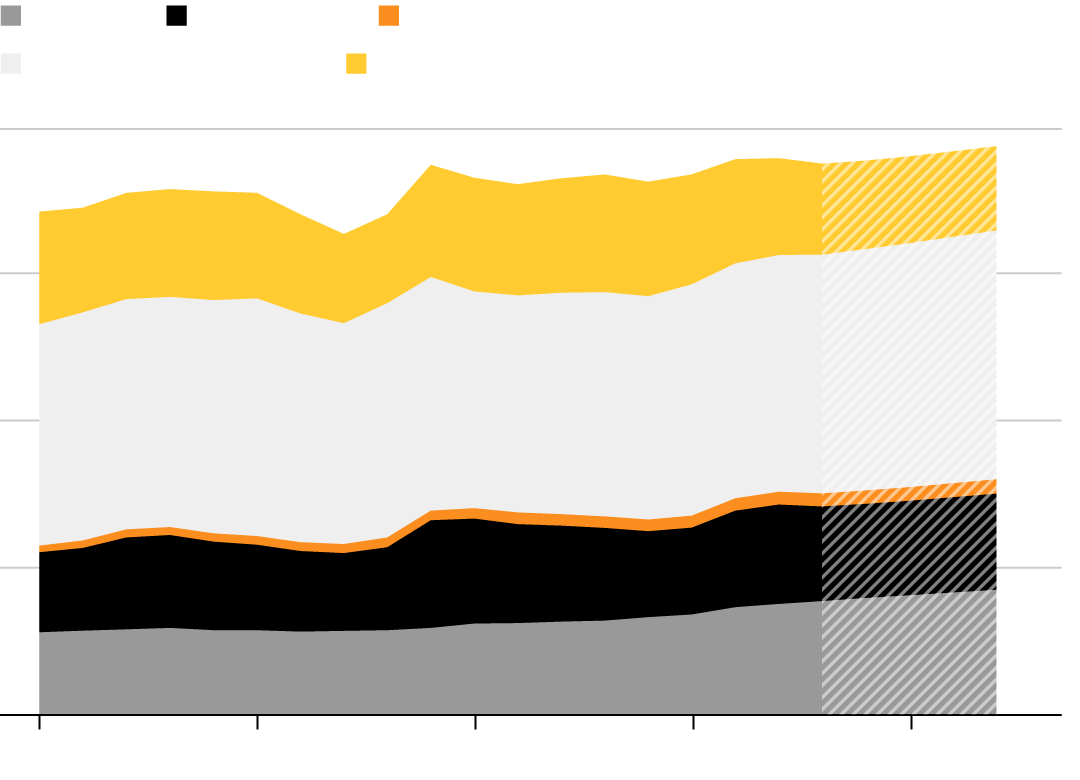
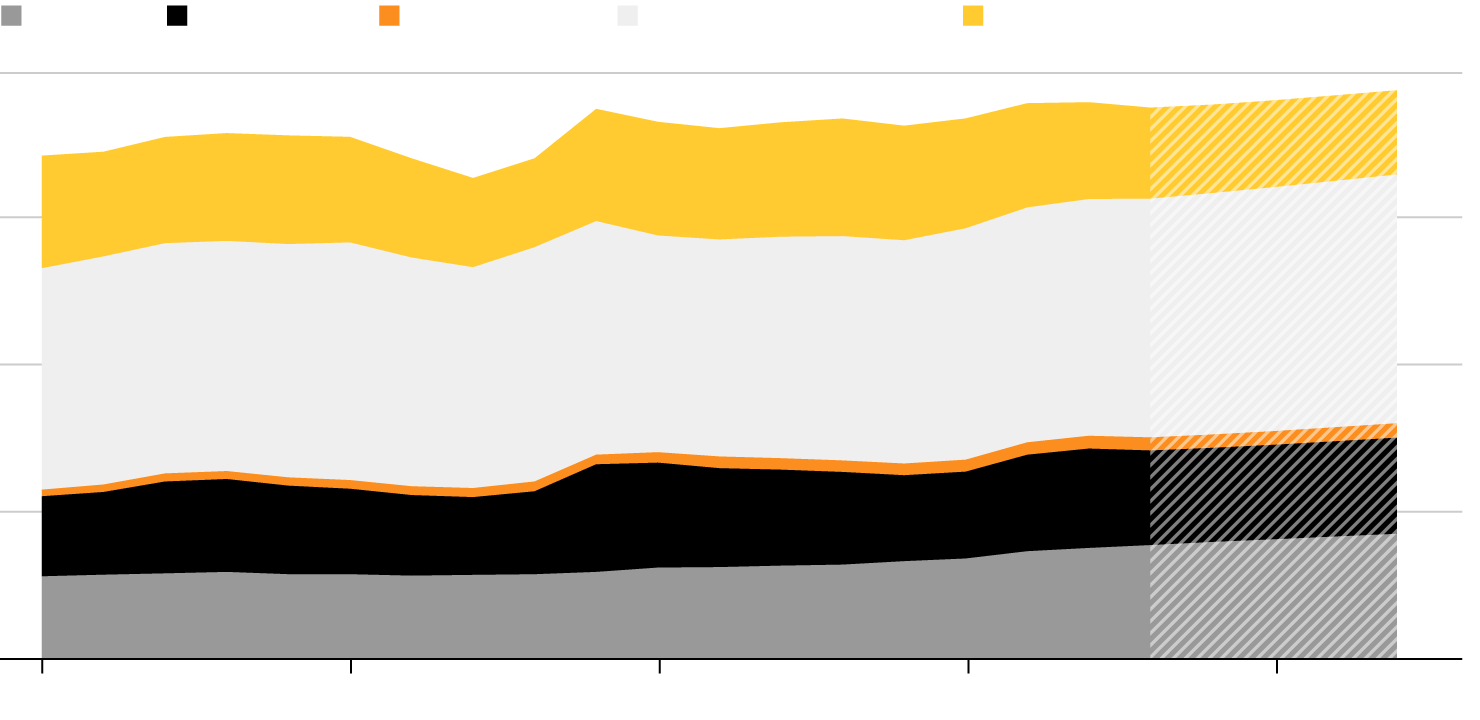
Populists and Authoritarians Now Oversee the Biggest Chunk of G-20 Output
Authoritarian
Weak democracy
Populist democracy
Establishment democracy
100%
80
Trump win flips U.S.
into populist
category
60
40
20
0
1980
2018
Authoritarian
Weak democracy
Populist democracy
Establishment democracy
100%
Trump win flips U.S.
into populist
category
80
60
40
20
0
1980
1990
2000
2010
2018
Authoritarian
Weak democracy
Populist democracy
Establishment democracy
100%
Trump win flips U.S.
into populist
category
80
60
40
20
0
1980
1990
2000
2010
2018
Sources: Bloomberg Economics, Freedom House, IMF
Voters are hitting back at inequality, frustrated by the lack of jobs or low pay for those who have work. As big business bounces back, there has been a backlash at the ballot box with populist wins, such as Donald Trump’s Presidential election victory in the U.S. elections and the U.K.’s vote to leave the European Union.