Why You’re Not Getting a Raise
No matter where you are in the world, you’re probably not getting much of a raise—and chances are, that’s not changing any time soon.
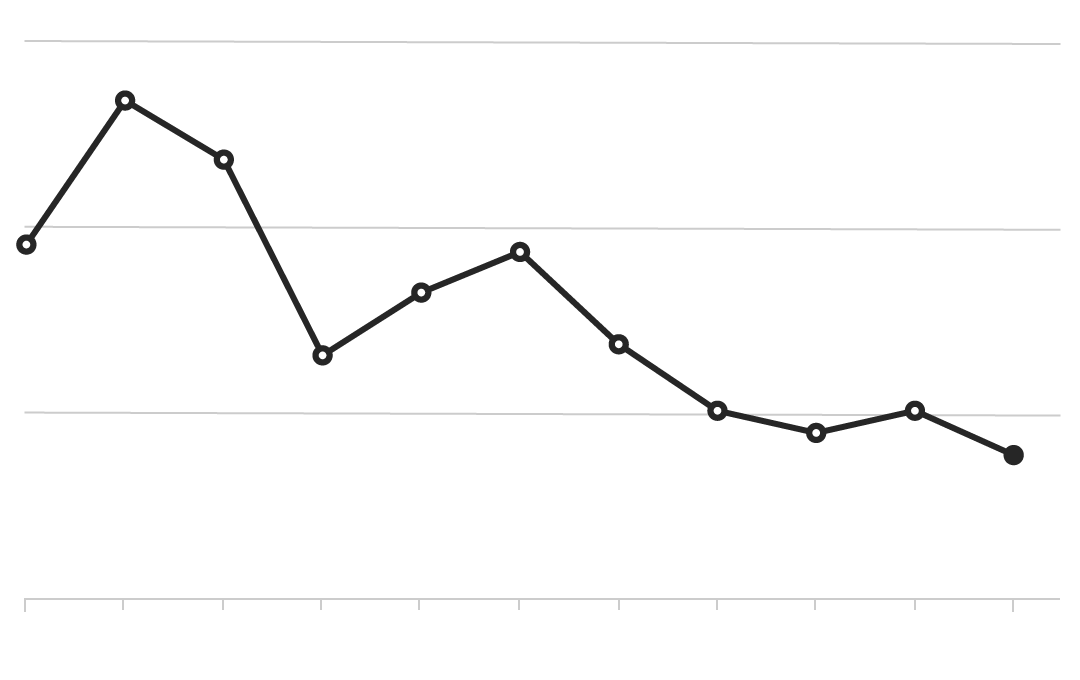
Even though the job market is picking up in the U.S., Britain, Japan and a host of other countries, the growth in pay is disappointing global economists, government officials and families alike. In Germany—home to strong unions, record-low unemployment and booming exports—annual wage growth since 2013 has only averaged 2.1 percent.
Annual Wage Growth
Pay increases have been skimpy even as the global economy recovered.
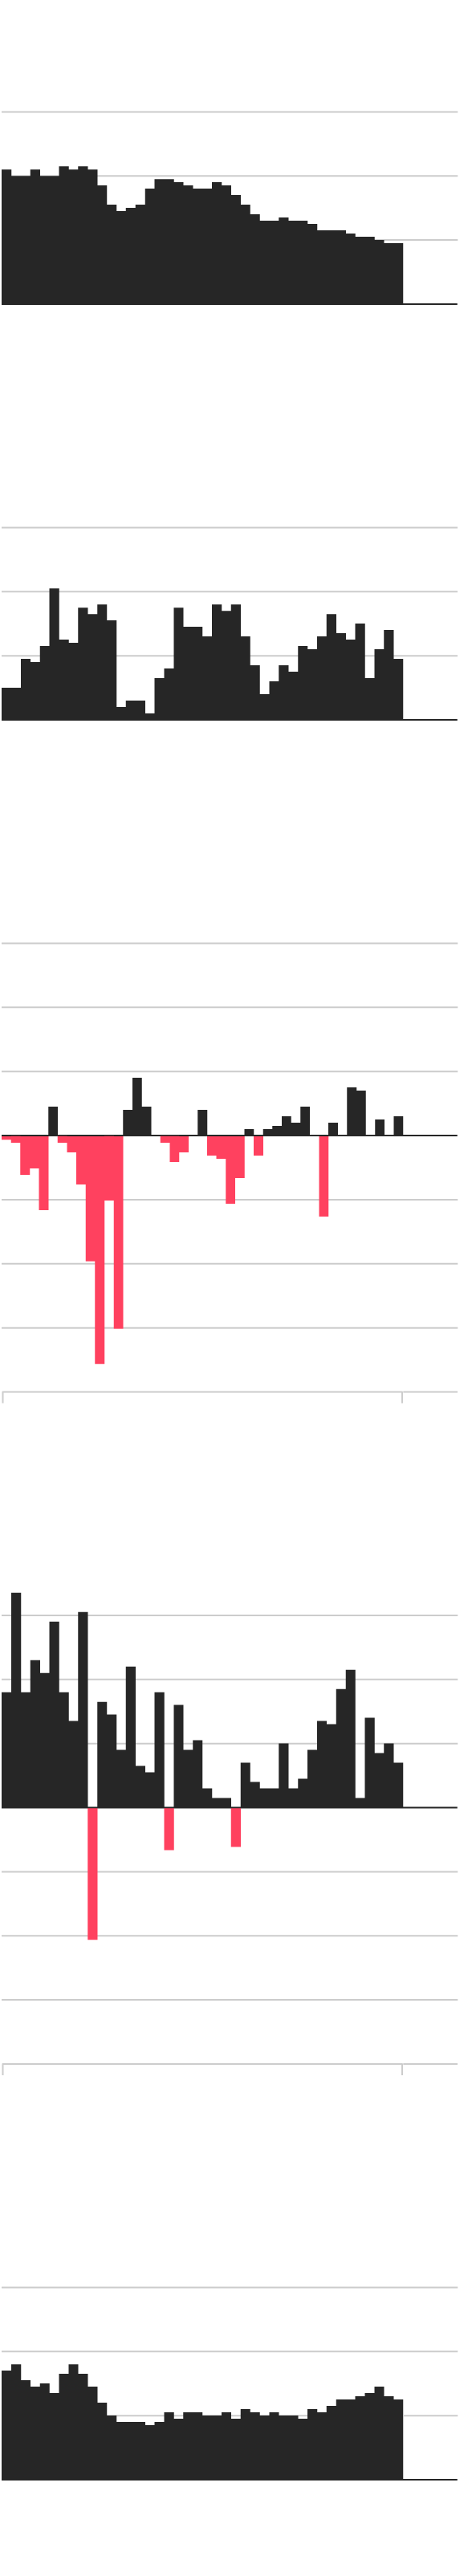
Australia
6%
4%
2%
0%
12/31/06
3/31/17
Germany
6%
4%
2%
0%
12/31/06
3/31/17
Japan
6%
4%
2%
0%
–2%
–4%
–6%
–8%
12/31/06
6/30/17
U.K.
6%
4%
2%
0%
–2%
–4%
–6%
–8%
12/31/06
3/31/17
U.S.
6%
4%
2%
0%
3/30/07
6/30/17

Australia
Germany
6%
4%
2%
0%
–2%
–4%
–6%
–8%
12/31/06
3/31/17
12/31/06
3/31/17
Japan
U.K.
12/31/06
6/30/17
12/31/06
3/31/17
U.S.
6%
4%
2%
0%
–2%
–4%
–6%
–8%
3/30/07
6/30/17
Australia
Germany
Japan
6%
4%
2%
0%
–2%
–4%
–6%
–8%
12/31/06
3/31/17
12/31/06
3/31/17
12/31/06
6/30/17
U.K.
U.S.
6%
4%
2%
0%
–2%
–4%
–6%
–8%
12/31/06
3/31/17
3/30/07
6/30/17
Australia
Germany
Japan
U.K.
U.S.
6%
4%
2%
0%
–2%
–4%
–6%
–8%
12/31/06
3/31/17
12/31/06
3/31/17
12/31/06
6/30/17
12/31/06
3/31/17
3/30/07
6/30/17
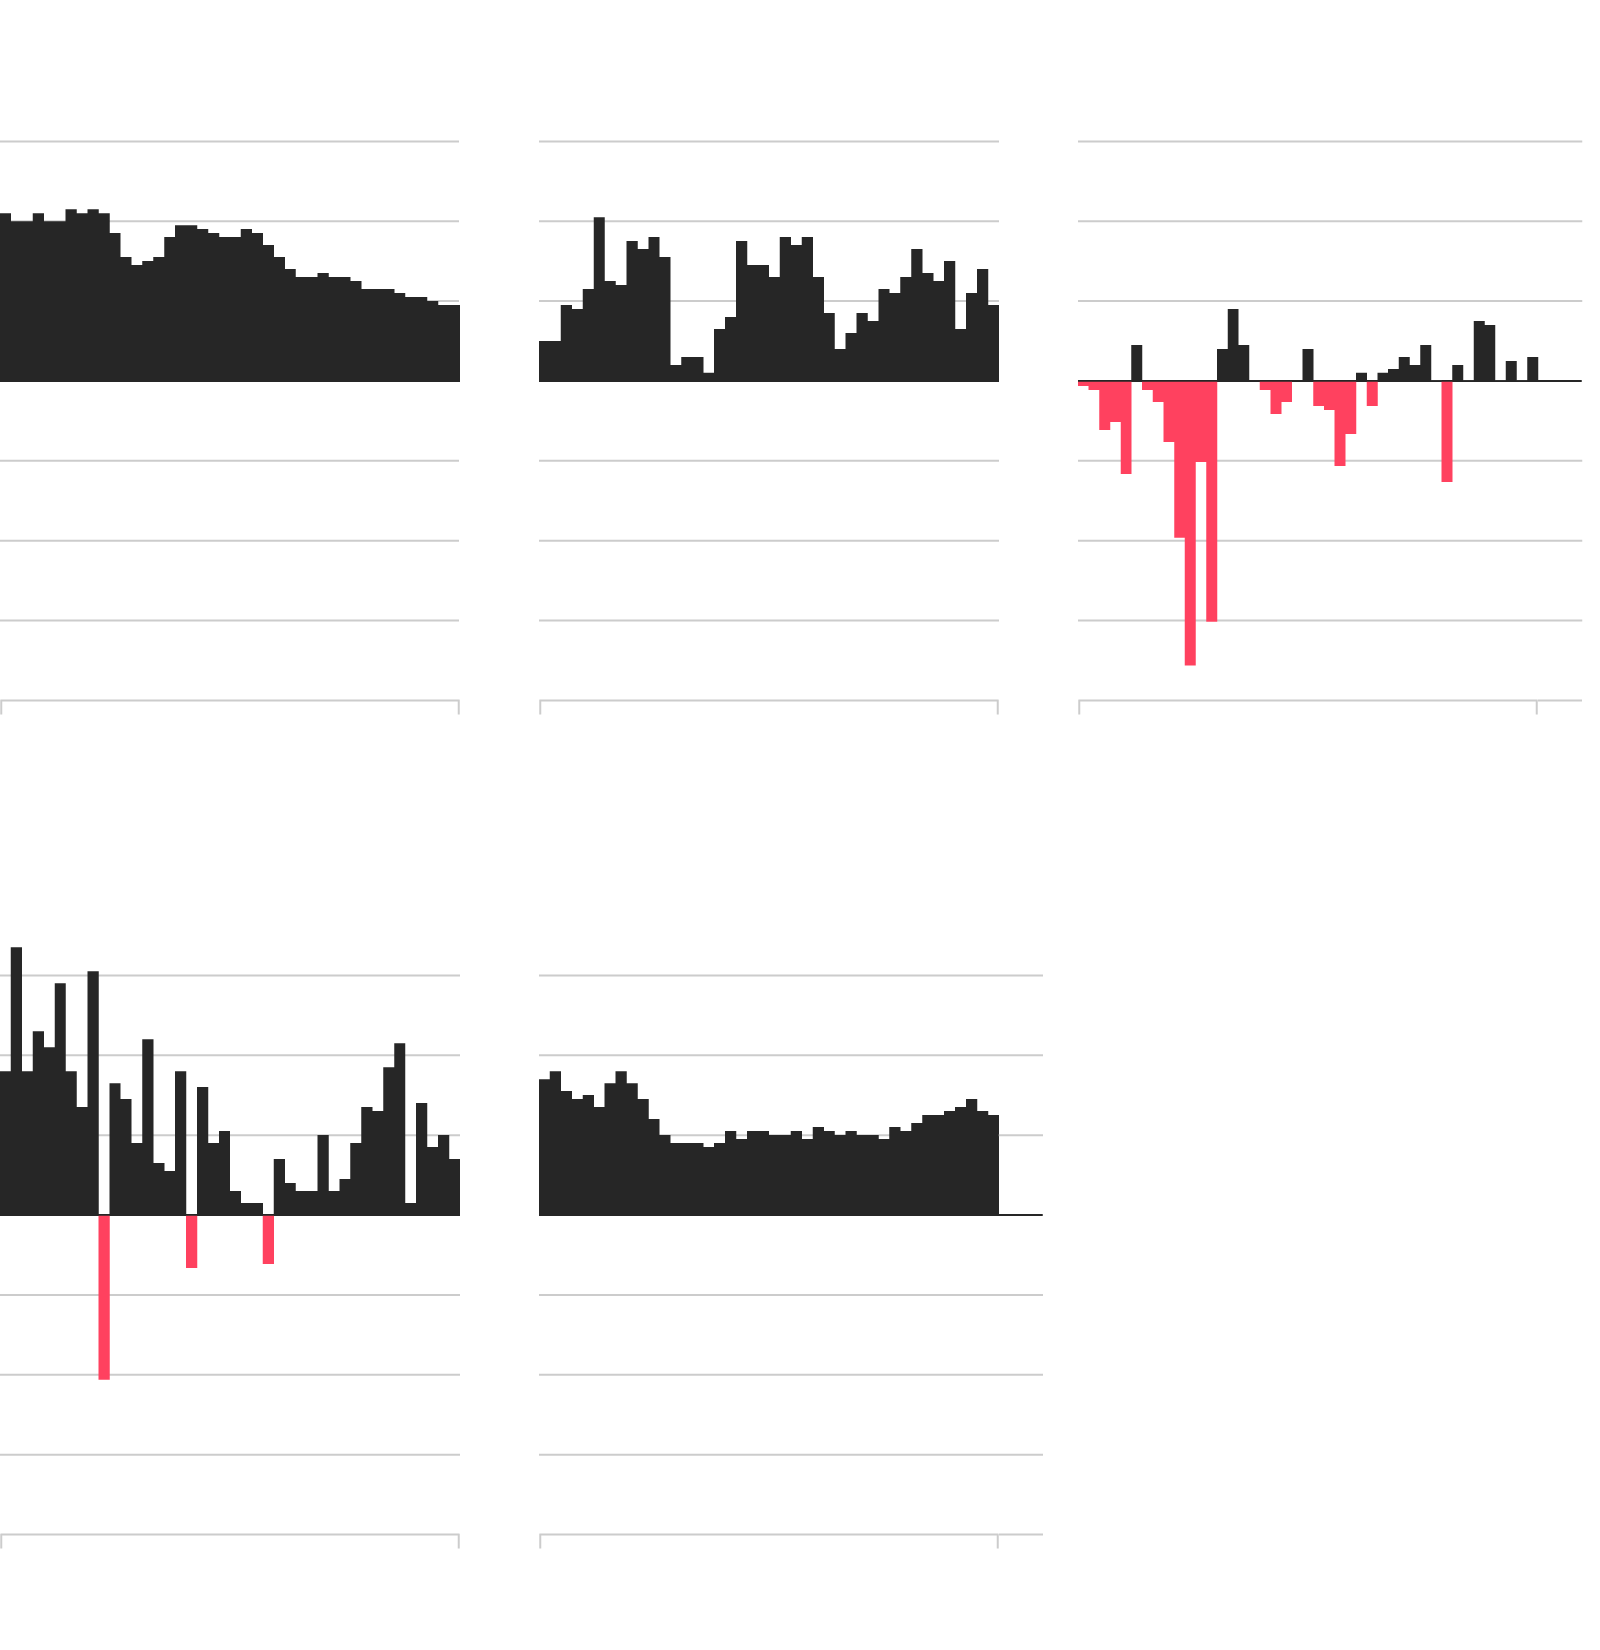
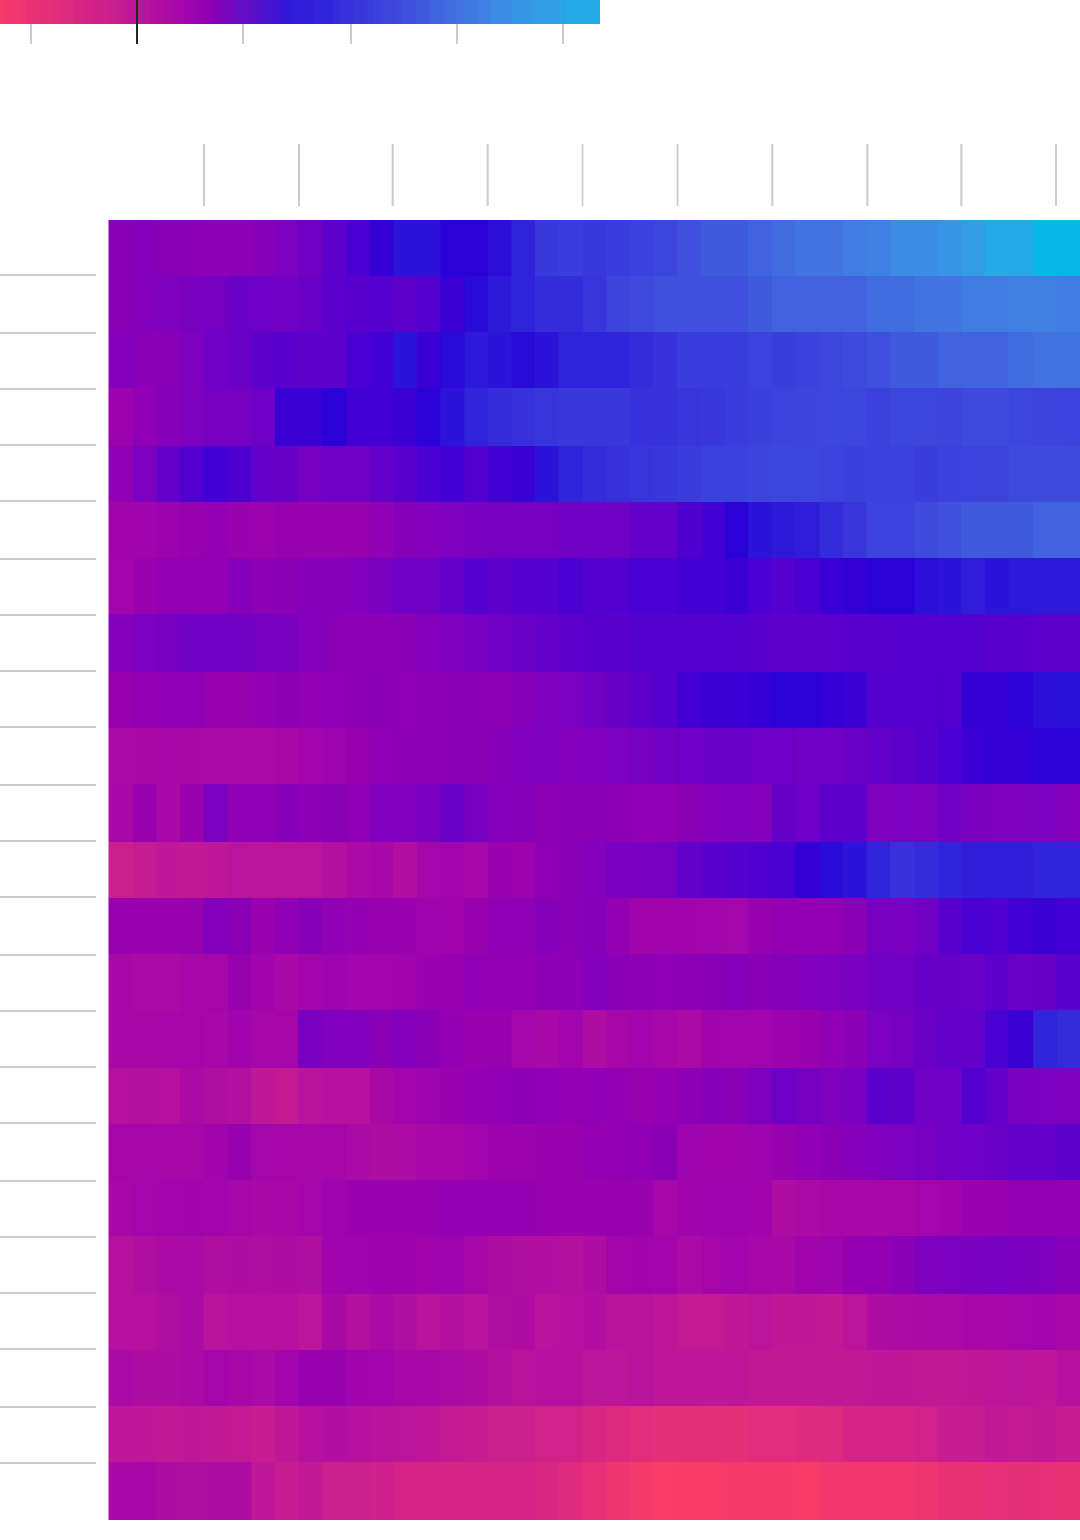
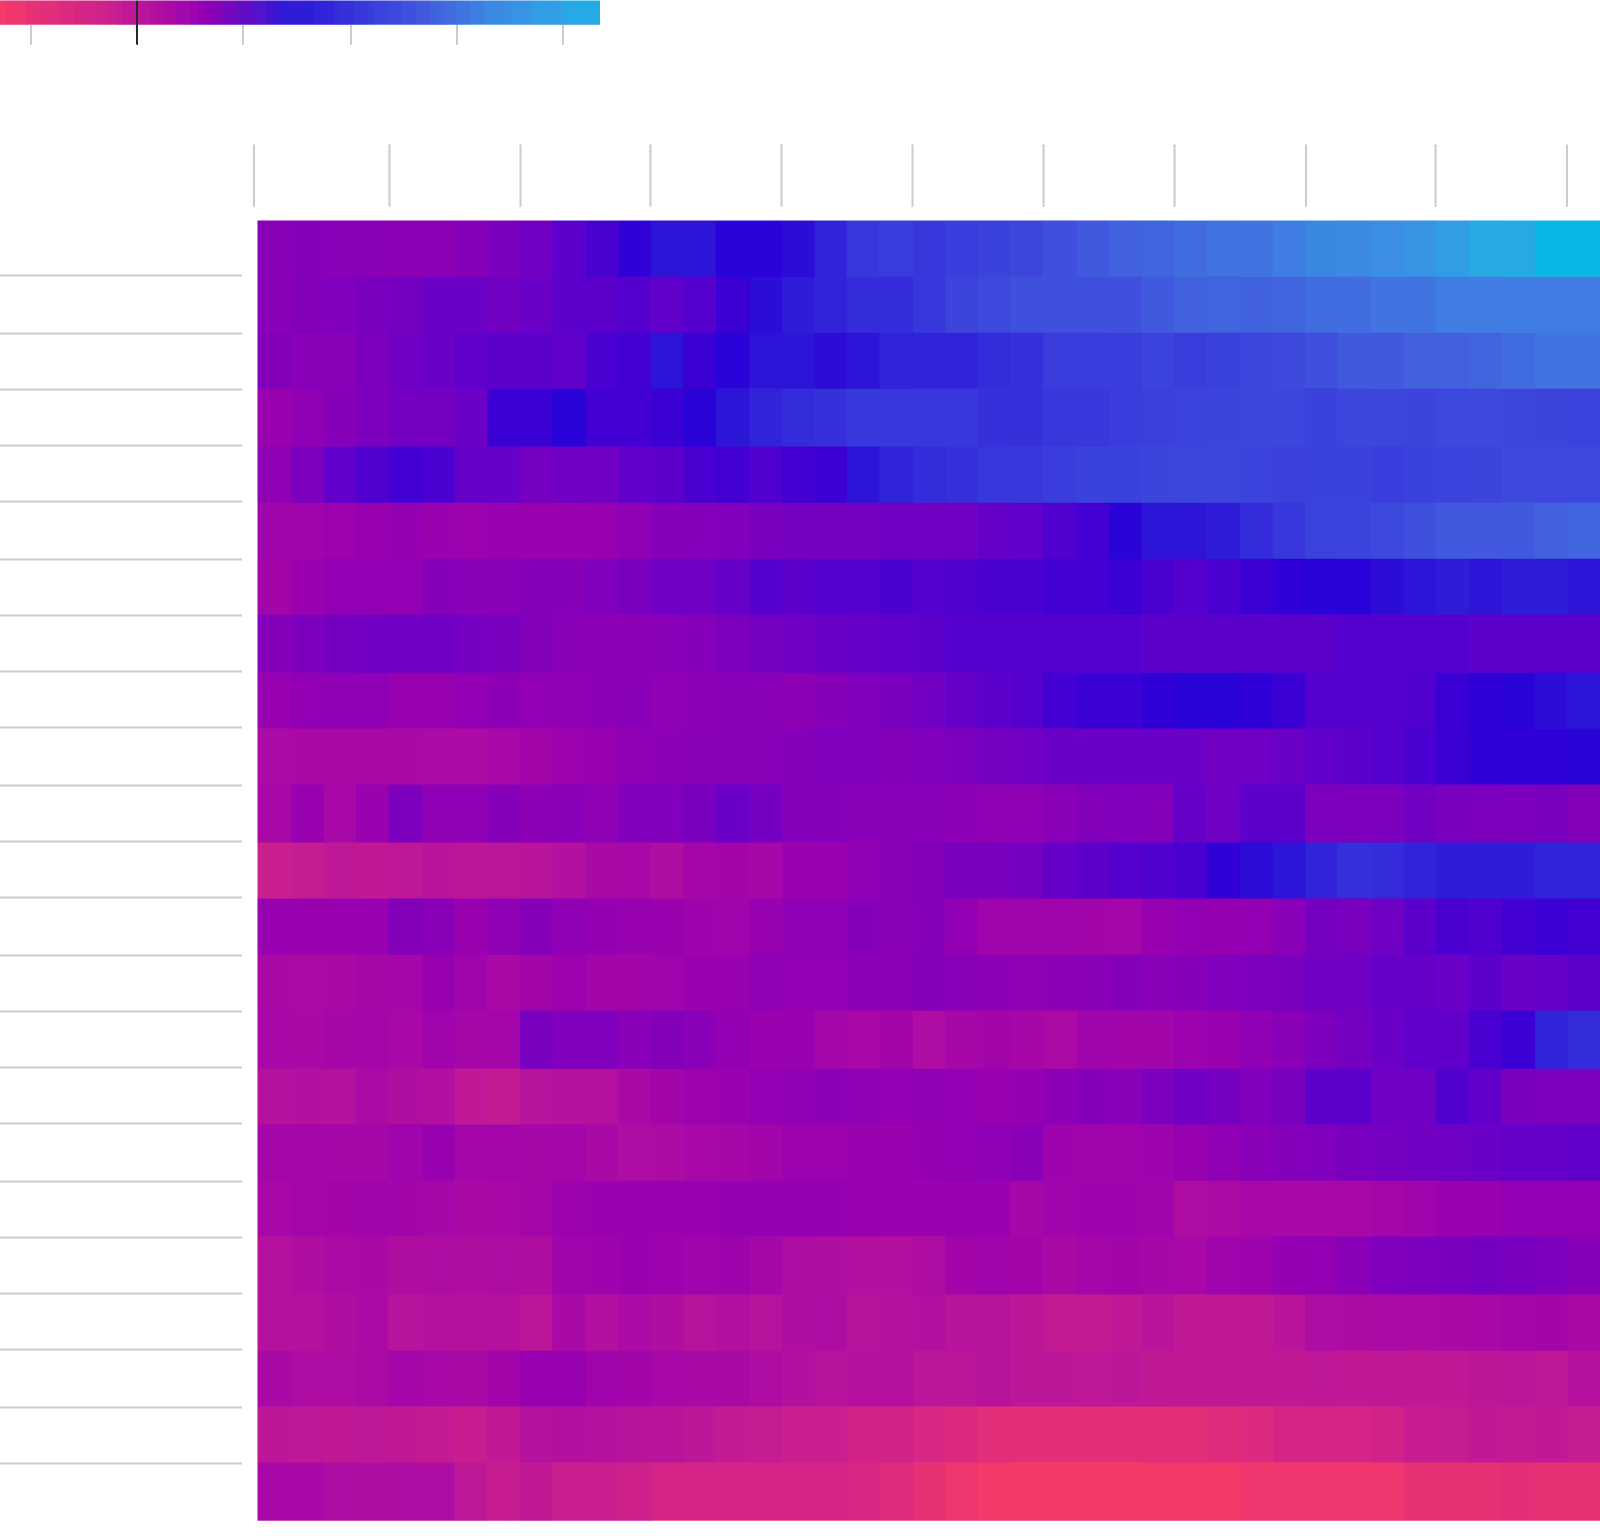
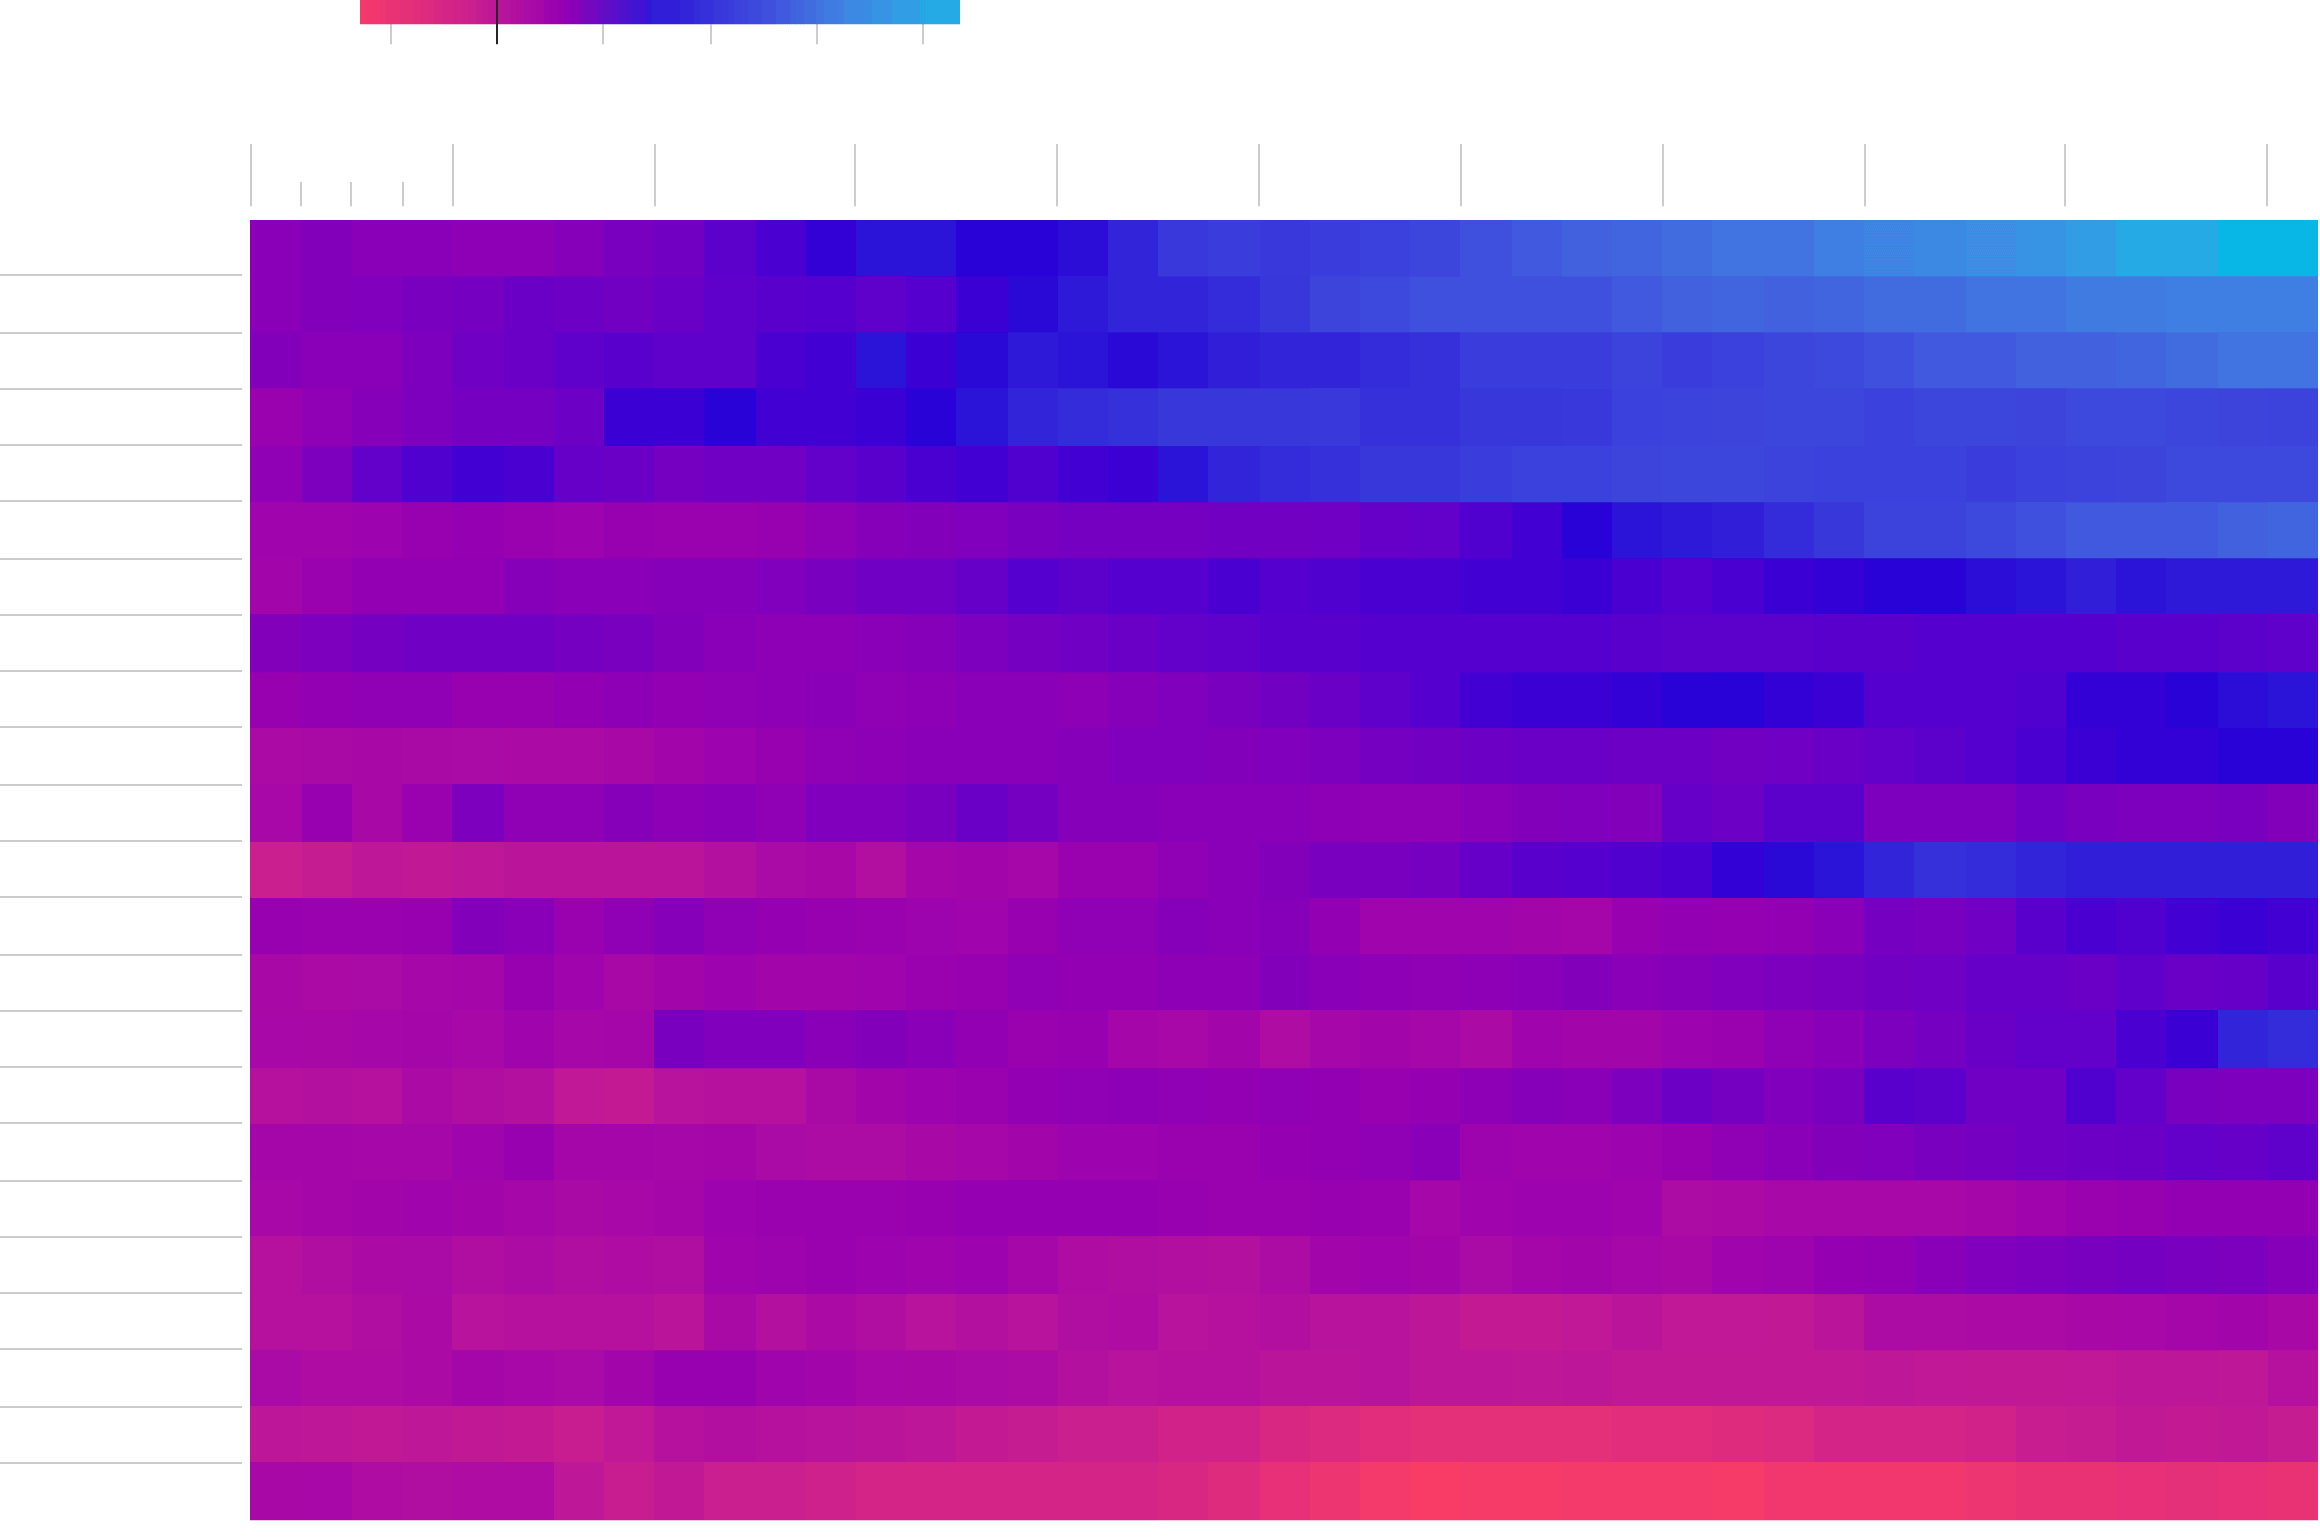
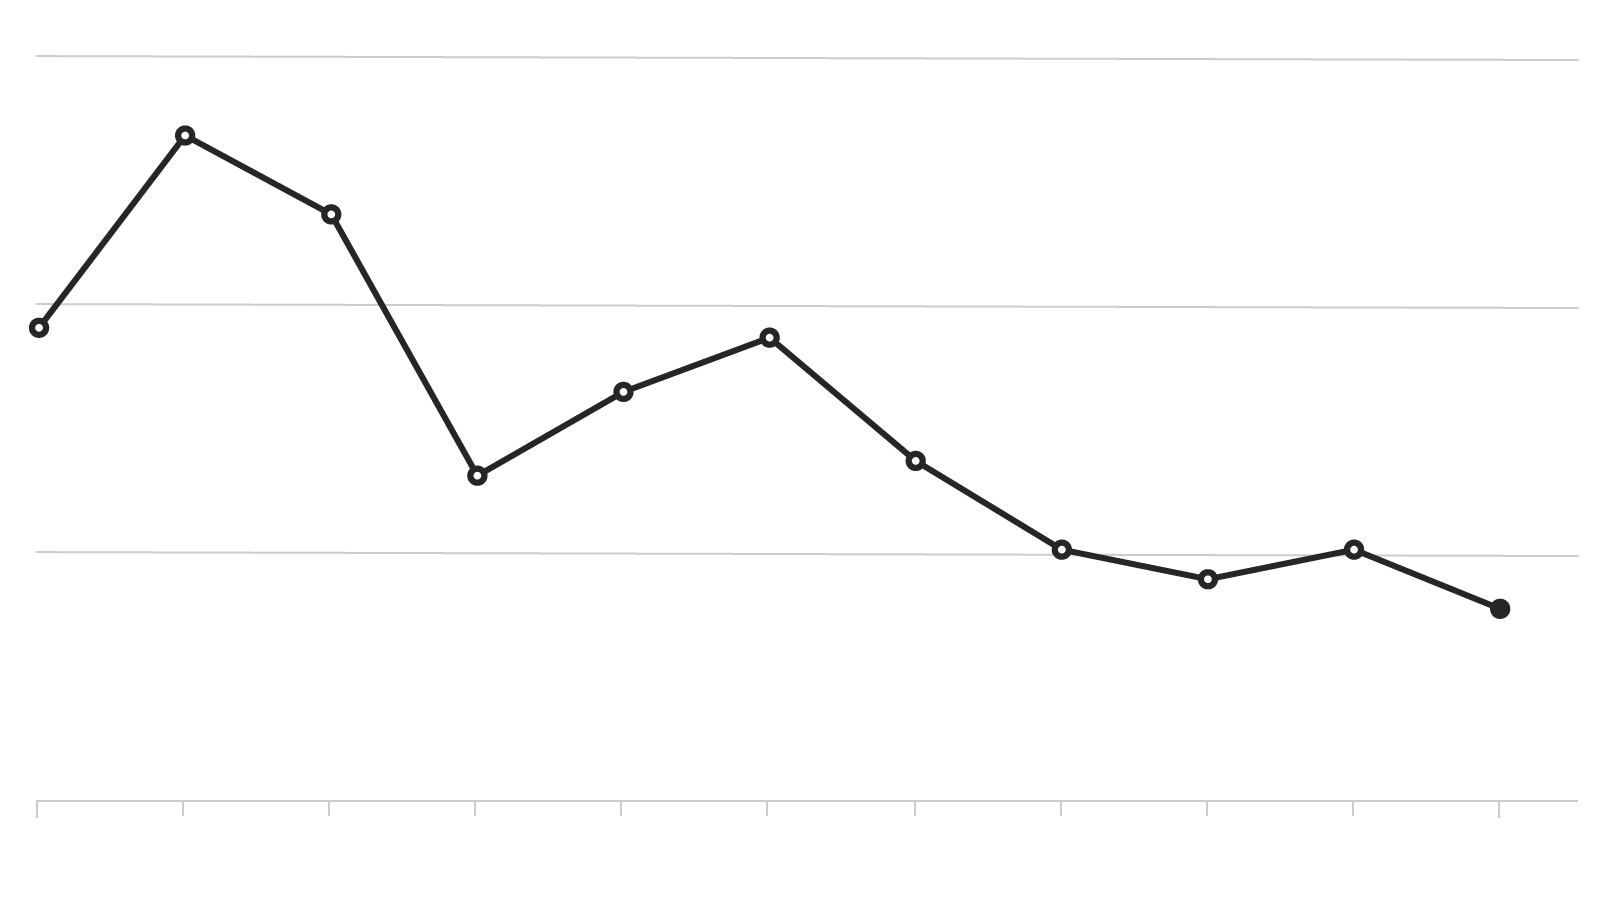
The wage-growth gap has a nagging knock-on effect in the amount of disposable income just about everywhere, curbing consumer purchasing power and making people feel pinched more than they otherwise would. The gains in real personal disposable income have been maddeningly slow in places like the U.S., and some countries like Italy have even lost ground.
Cash in Your Pocket Around the World
Real personal disposable income index (100 = 2005 average), ordered by index averages.
100
110
120
130
140
90
Q1 2007
Q1 2017
ISR
SWE
CAN
AUS
NZL
KOR
FIN
ZAF
CHE
JPN
LUX
NOR
HRV
DEU
IRL
DNK
USA
FRA
GBR
NLD
BEL
ESP
ITA
100
110
120
130
140
90
’07
’08
’09
’10
’11
’12
’13
’14
’15
’16
ISR
SWE
CAN
AUS
NZL
KOR
FIN
ZAF
CHE
JPN
LUX
NOR
HRV
DEU
IRL
DNK
USA
FRA
GBR
NLD
BEL
ESP
ITA
100
110
120
130
140
90
2007
2008
2009
2010
2011
2012
2013
2014
2015
2016
Israel
Sweden
Canada
Australia
New Zealand
South Korea
Finland
South Africa
Switzerland
Japan
Luxembourg
Norway
Croatia
Germany
Ireland
Denmark
U.S.
France
U.K.
Netherlands
Belgium
Spain
Italy
100
110
120
130
140
90
2007
2008
2009
2010
2011
2012
2013
2014
2015
2016
’17
q1
q2
q3
q4
Israel
Sweden
Canada
Australia
New Zealand
South Korea
Finland
South Africa
Switzerland
Japan
Luxembourg
Norway
Croatia
Germany
Ireland
Denmark
U.S.
France
U.K.
Netherlands
Belgium
Spain
Italy
A lot has been written about why compensation isn’t picking up. Economists typically expect that a tight labor market will eventually mean that companies will have to start paying people more. But as more workers have come back into the labor force, that hasn't happened.
Even in Japan, where wages had been edging higher since mid-2014, pay is still now rising quite slowly—despite unemployment being near a two-year low. Total cash earnings for the Japanese rose 0.7 percent in May, and that was the biggest increase since July 2016.
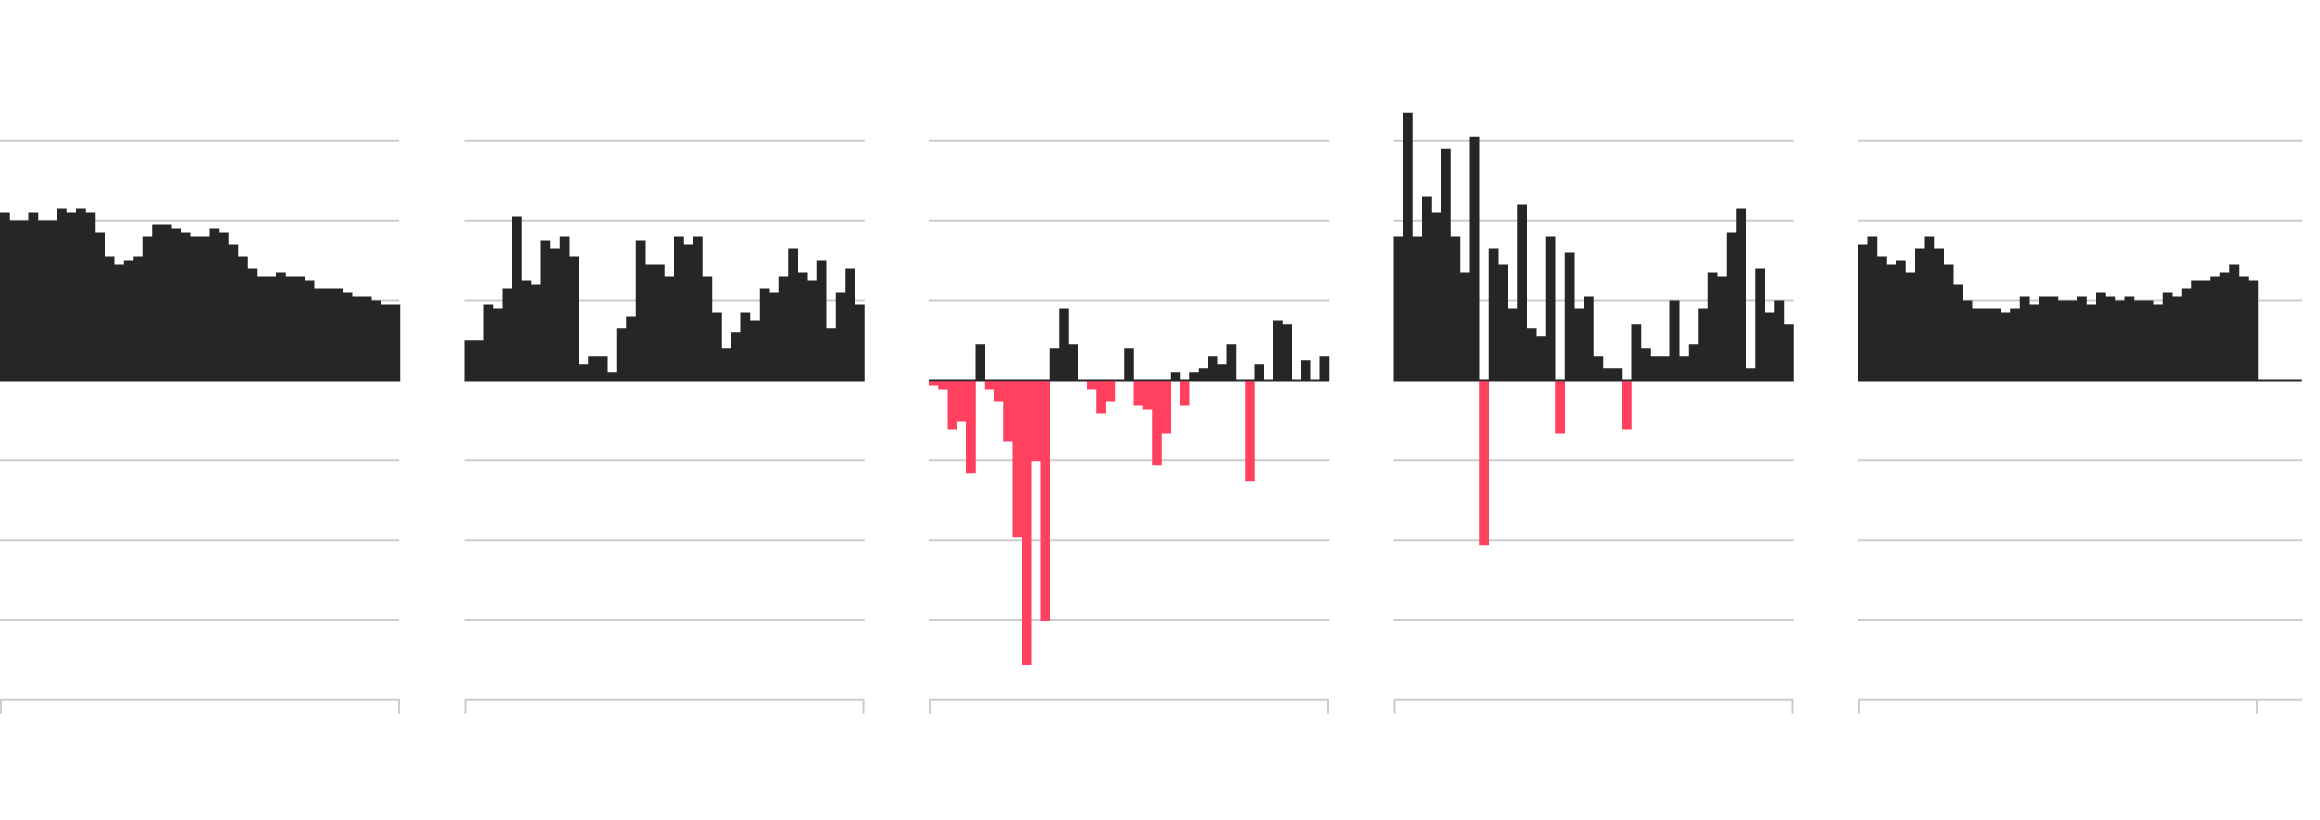
And in China, where industrial profits are soaring and wage gains routinely topped 10 percent since the 1990s, increases are getting skimpier by the day. The strong currency and those steeper paychecks are seen as cutting into Chinese competitiveness.
China Average Wage of Employed Persons
Total remuneration paid to employees, year-over-year change
20%
15%
10%
5%
’07
’09
’11
’13
’15
’17
20%
15%
10%
5%
’07
’08
’09
’10
’11
’12
’13
’14
’15
’16
’17
20%
15%
10%
5%
2007
2008
2009
2010
2011
2012
2013
2014
2015
2016
2017
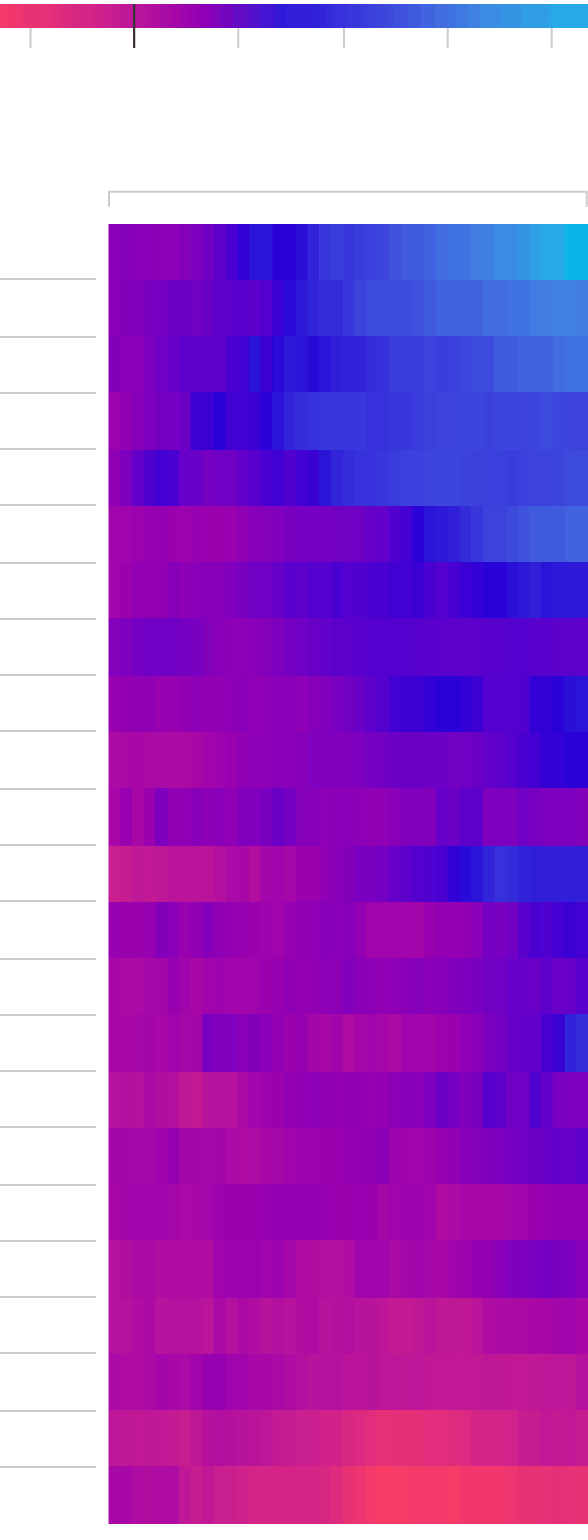
In the U.S., one explanation for the slow wage growth can be found in a broader measure of unemployment, the U-6 rate. That rate—which includes people who are not actively looking for work but would want a job—is still above where it was in the last cycle. The U-6 is at 8.6 percent, which compares to a low of 7.9 percent in the previous expansion. Prior to that, the U-6 joblessness rate reached 6.8 percent in October 2000. Another measure, the employment-to-population ratio has been a better predictor of wages so far this cycle, and that indicator is still below where it was in the last recovery.

U-6 Unemployment Rate
20%
15%
10%
5%
12/29/06
6/30/17
U.S. Employment to Population Ratio
64
63
62
61
60
59
58
57
12/31/06
6/30/17

U-6 Unemployment Rate
20%
15%
10%
5%
12/29/06
6/30/17
U.S. Employment to Population Ratio
64
63
62
61
60
59
58
57
12/31/06
6/30/17

U-6 Unemployment Rate
U.S. Employment to Population Ratio
20%
64
63
62
15%
61
60
10%
59
58
5%
57
12/29/06
6/30/17
12/31/06
6/30/17
The forecasts for the next five years don't look particularly inspiring. Many places will see wage growth taper off.
Wage Forecasts
Year-over-year growth
Japan
4%
3%
2%
1%
0%
2017
2021
Italy
4%
3%
2%
1%
0%
2017
2021
Germany
4%
3%
2%
1%
0%
2017
2021
U.S.
4%
3%
2%
1%
0%
2017
2021
Spain
4%
3%
2%
1%
0%
2017
2021
France
4%
3%
2%
1%
0%
2017
2021
U.K.
4%
3%
2%
1%
0%
2017
2021

Japan
Italy
Germany
4%
3%
2%
1%
0%
2017
2021
2017
2021
2017
2021
U.S.
Spain
France
4%
3%
2%
1%
0%
2017
2021
2017
2021
2017
2021
U.K.
4%
3%
2%
1%
0%
2017
2021

Japan
Italy
U.S.
Germany
4%
3%
2%
1%
0%
2017
2021
2017
2021
2017
2021
2017
2021
Spain
France
U.K.
4%
3%
2%
1%
0%
2017
2021
2017
2021
2017
2021
The dramatic conclusion may be that as much as economists want to believe that true wage growth is just around the corner, it’s really not. And we all better get used to our paychecks pretty much staying where they are.