Asia Can Power Through Another Financial Crisis
The Asian nations hit hardest 20 years ago by a crisis that sent currencies and stock markets tumbling, saw governments fall and pushed millions back into poverty, now have some of the strongest buffers in the world.
But that resilience faces a fresh test. The world’s biggest central banks are either removing monetary stimulus or mulling ways to do so—the same backdrop that helped unravel the Asian miracle a generation ago. That could suck liquidity out of emerging markets, pressure currencies and raise the cost of dollar debt repayments. The following charts assess the region’s changing fortunes:
Stronger Defenses
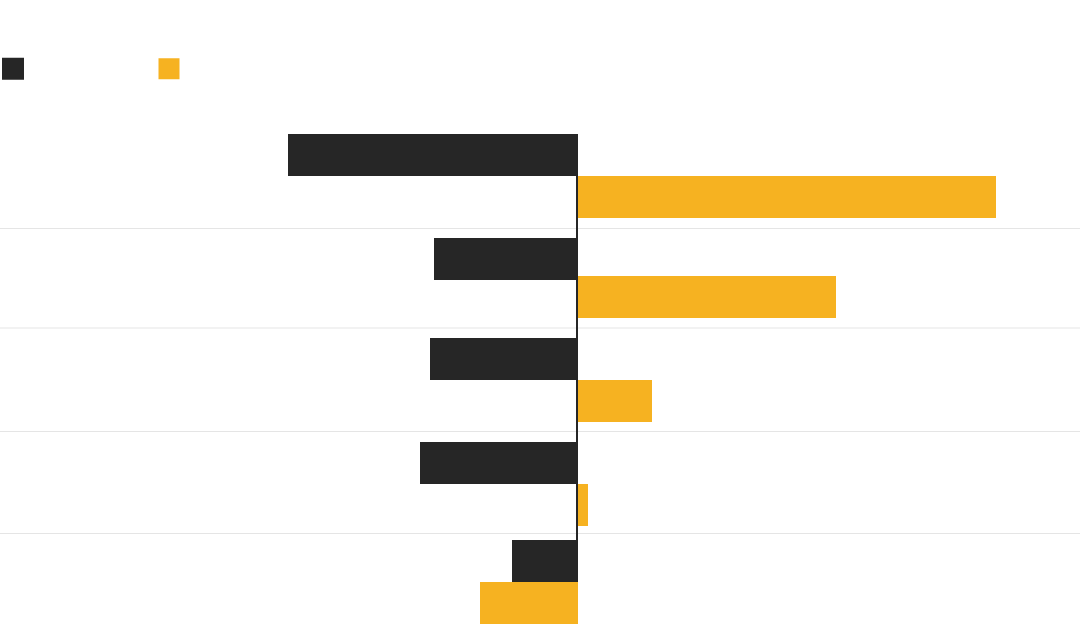
Asia’s currency reserves at well over $6 trillion make up more than half of the world’s holdings, led by China’s $3 trillion hoard. In 1996, Asia’s reserves were less than $1 trillion, leaving central banks short handed when their fixed and managed currencies came under speculative attack from investors including George Soros. Most of the countries now have floating exchange rate systems, reducing pressure on central banks to defend a particular level of the currency.
Reserves
USD billions

1996
May 2017
South Korea
Thailand
$33.2B
$38.7B
$378.5B
$184B
Malaysia
Philippines
Indonesia
$18.3B
$27B
$11.8B
$125B
$98B
$82.1B

1996
May 2017
South Korea
$33.2B
$378.5B
Thailand
$38.7B
Malaysia
$184B
$27B
Philippines
$98B
$11.8B
$82.1B
Indonesia
$18.3B
$125B

1996
May 2017
South Korea
$33.2B
$378.5B
Thailand
$38.7B
Malaysia
$184B
$27B
Philippines
$98B
$11.8B
$82.1B
Indonesia
$18.3B
$125B
Surplus Strength
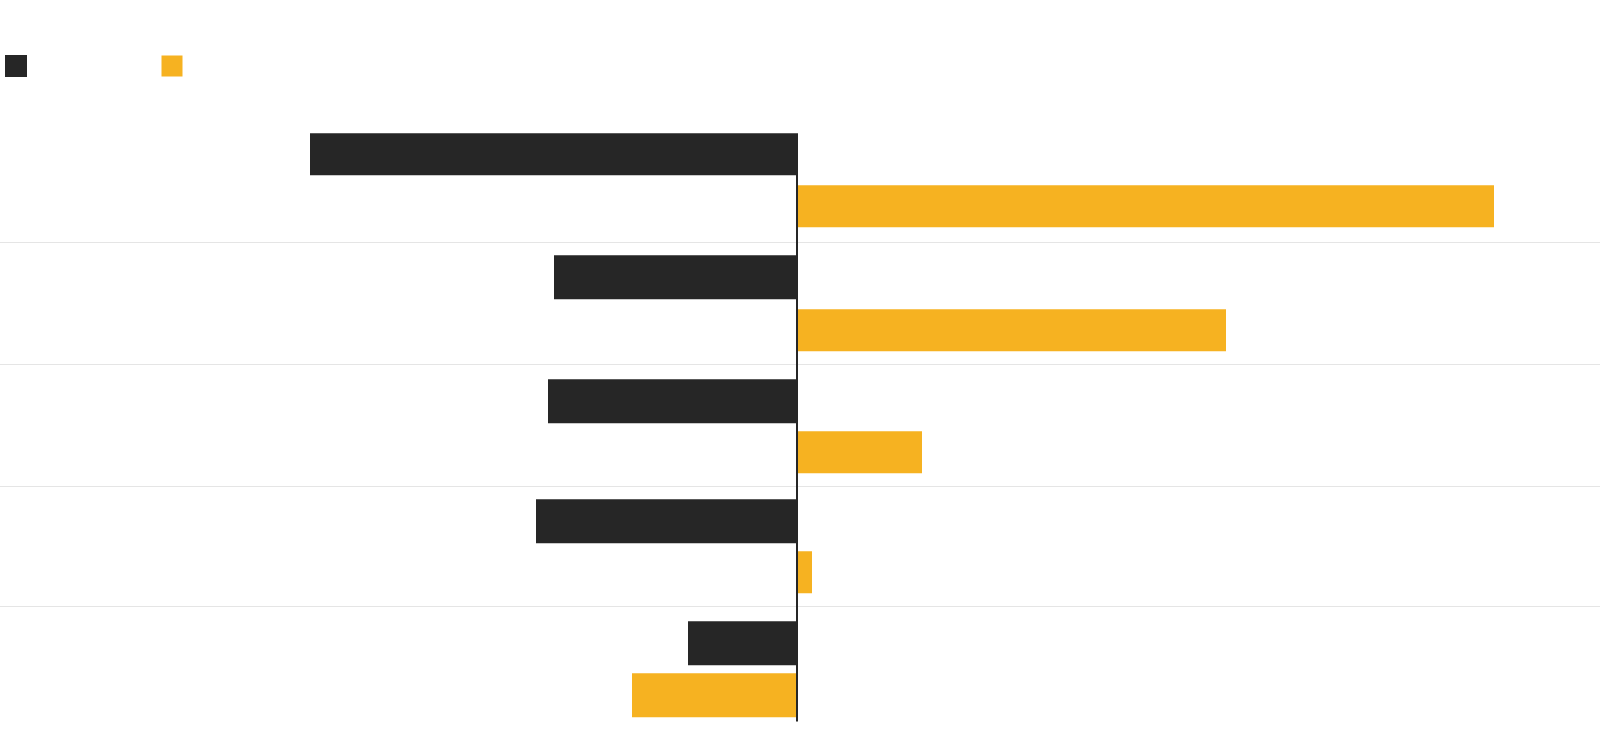
Asia’s current-account positions are much stronger, with most in surplus for several years now. The current account, which measures trade and financial flows including interest and dividend payments, is used by investors to gauge a nation’s resilience to a crisis.
Current Account

1996
2016
Thailand
-8%
11.4%
South Korea
-4%
7%
Malaysia
-4.1%
2%
Philippines
-4.3%
0.2%
Indonesia
-1.8%
-2.7%
1996
2016
-8%
Thailand
11.4%
-4%
South Korea
7%
-4.1%
Malaysia
2%
-4.3%
Philippines
0.2%
-1.8%
Indonesia
-2.7%
1996
2016
-8%
Thailand
11.4%
-4%
South Korea
7%
-4.1%
Malaysia
2%
-4.3%
Philippines
0.2%
-1.8%
Indonesia
-2.7%
Sweet Spot
Asian economies are again among the fastest-growing in the world, with countries such as the Philippines, India and China expanding more than 6 percent annually.
GDP
USD billions

South Korea
Indonesia
$598B
$274.7B
$1,411B
$932.4B
Thailand
Philippines
Malaysia
$108.3B
$183B
$91.8B
$407B
$304.7B
$296.4B

1996
2016
South Korea
$598B
$1,411B
Philippines
$91.8B
$304.7B
Thailand
$183B
Malaysia
$407B
$108.3B
$296.4B
Indonesia
$274.7B
$932.4B

1996
2016
South Korea
$598B
$1,411B
Philippines
$91.8B
$304.7B
Thailand
$183B
Malaysia
$407B
$108.3B
$296.4B
Indonesia
$274.7B
$932.4B
Less Exposed
Most countries have taken steps to reduce foreign debt, making their economies less exposed should a sharp appreciation in the U.S. dollar inflate the cost of repaying loans. Twenty years ago, companies went bankrupt and governments from Thailand to South Korea were forced to seek bailouts from the International Monetary Fund when their tumbling currencies made servicing U.S. dollar loans impossible.
Foreign Debt/GNI

1996
2015
Malaysia
41.3%
66.3%
Thailand
63.3%
35.2%
Indonesia
58.3%
37%
South Korea
24%
26*%
Philippines
51.1%
22%
Note: South Korea data is from Bank of Korea
(1996, *2016); all other data are from the
World Bank (1996, 2015)

1996
2015
Malaysia
41.3%
66.3%
Thailand
63.3%
35.2%
Indonesia
58.3%
37%
South Korea
24%
26*%
Philippines
51.1%
22%
Note: South Korea data is from Bank of Korea (1996, *2016);
all other data are from the World Bank (1996, 2015)

1996
2015
41.3%
Malaysia
66.3%
63.3%
Thailand
35.2%
58.3%
Indonesia
37%
24%
South Korea
26*%
51.1%
Philippines
22%
Note: South Korea data is from Bank of Korea (1996, *2016); all other data are from the World Bank (1996, 2015)
Demographic Dividend
Many of Asia’s economies have also gradually reduced their dependence on exports and become more reliant on rising consumption. Youthful populations in countries such as the Philippines and Indonesia are setting up what could be a demographic dividend if enough work can be found to swell the ranks of the middle classes there.
Population

Indonesia
Philippines
204.3M
71.7M
260.6M
104.3M
Thailand
South Korea
Malaysia
61.2M
45.3M
21.4M
68.4M
51.1M
31.4M
1996
2017
South Korea
45.3M
51.1M
Philippines
71.7M
104.3M
Thailand
61.2M
Malaysia
68.4M
21.4M
31.4M
Indonesia
204.3M
260.6M

1996
2017
South Korea
45.3M
51.1M
Philippines
71.7M
104.3M
Thailand
61.2M
68.4M
Malaysia
21.4M
31.4M
Indonesia
204.3M
260.6M
Fortunes Revived
So today, 20 years after the crisis that erupted on July 2, 1997, when Thailand abandoned its currency peg, the region is again a favorite among investors, with global funds pouring about $45 billion into stocks and bonds in Indonesia, Malaysia, the Philippines, South Korea and Thailand this year. Analysts predict that the Indonesian rupiah, Philippine peso, and Malaysian ringgit will be the top-performing currencies, including interest income, in Asia by the end of 2018.
Currencies
Forecasted total return through end of Q4 2018

Indonesian rupiah
10.04%
Philippine peso
8.64%
Malaysian ringgit
7.64%
South Korean won
0.56%
Thai baht
0.05%

Indonesian rupiah
10.04%
Philippine peso
8.64%
Malaysian ringgit
7.64%
South Korean won
0.56%
Thai baht
0.05%

Indonesian rupiah
10.04%
Philippine peso
8.64%
Malaysian ringgit
7.64%
South Korean won
0.56%
Thai baht
0.05%
“Asia has come a long way because of the lessons they learned,” said Tsutomu Soma, general manager of the fixed-income department in Tokyo at SBI Securities Co. “The region paid a huge price for those lessons but has moved on to improve drastically.”
Correction: A previous version of this graphic incorrectly indicated Thailand's GDP in 1996 as $138B; in fact it was $183B.