


Bankers Are Worried About Sky-High Commercial Real Estate Prices
Janet Yellen recorded the warning a day before stepping down as Federal Reserve chair in February: Commercial real estate prices look strikingly high. Her successor, Jerome Powell, flagged it again a month later.
Analysts at Goldman Sachs Group Inc. tried in May to put a number on it: Properties may be overvalued as much as 16 percent. Soon, Wells Fargo Chief Executive Officer Tim Sloan went on television, saying some deals looked “frothy” and that his bank was pulling back. In the past month, executives at regional lenders including U.S. Bancorp and KeyCorp have chimed in with similar concerns.
Yet, by some key metrics—most notably default rates—the market seems serene. So why all the handwringing?
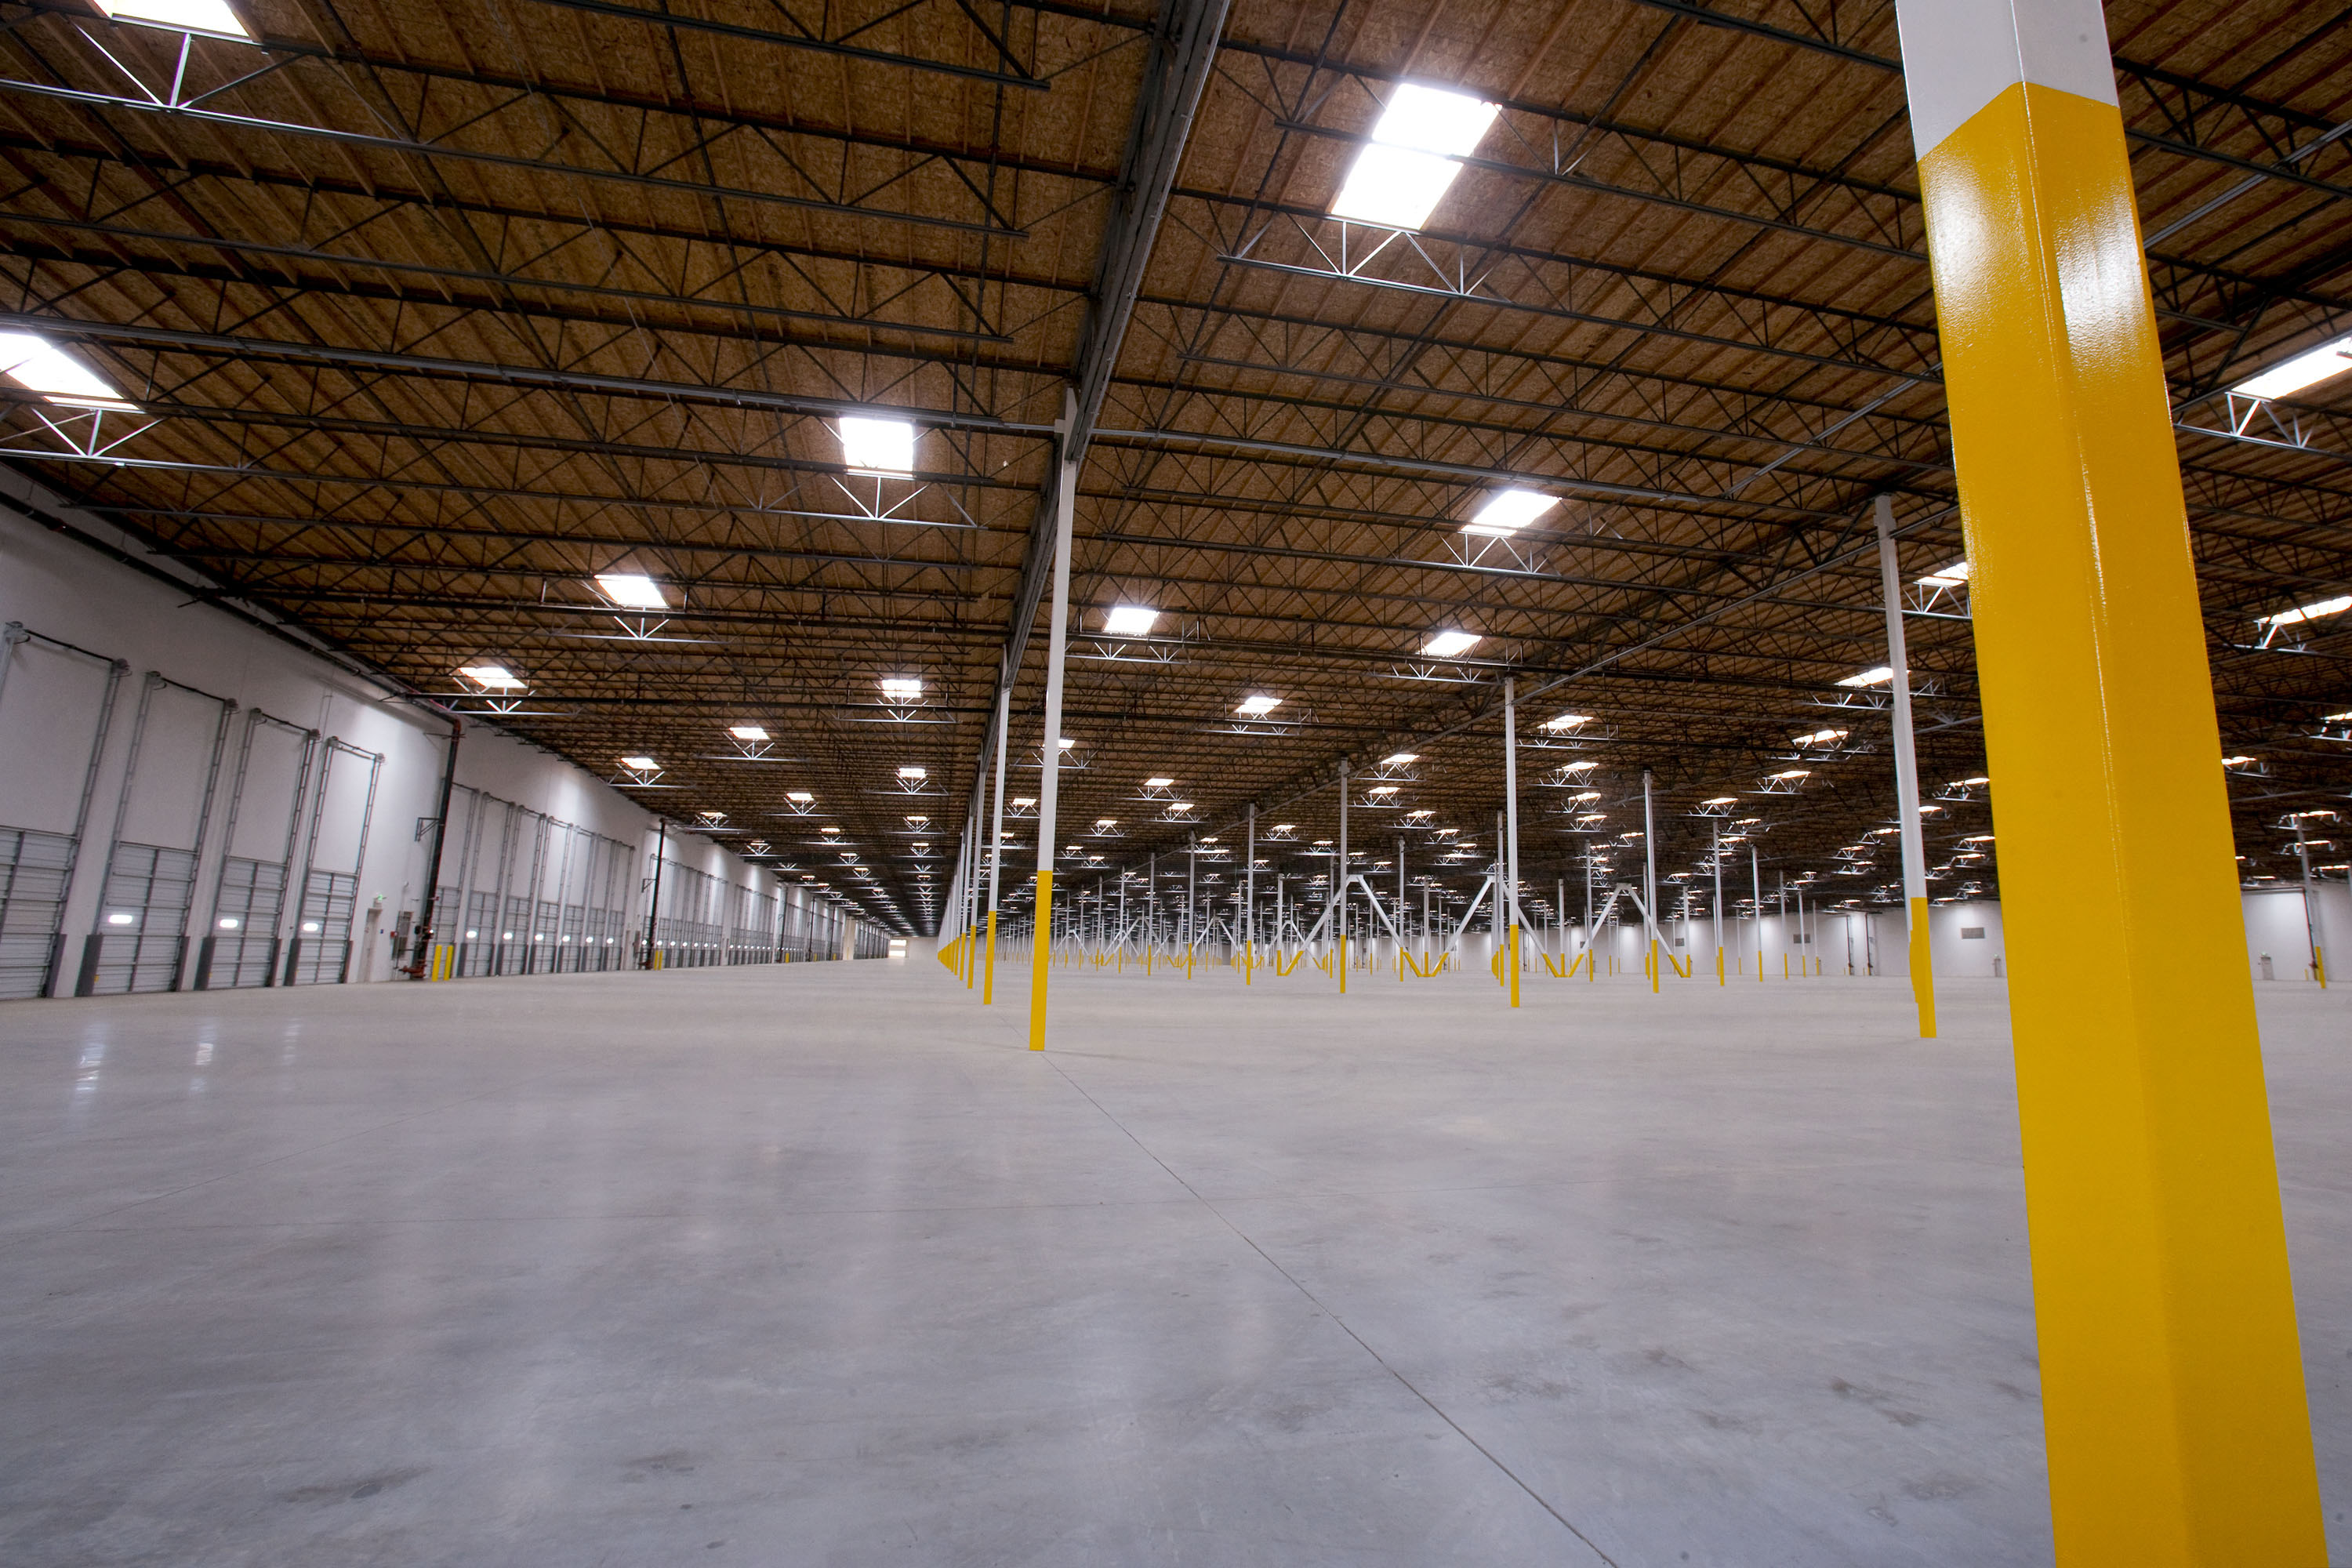
Years of economic growth and easy financing have pushed prices for office towers, apartments and warehouses to record heights. Executives speaking out say they’re worried some buyers are betting too boldly that they can just keep raising rents.
Too Frothy?

150
131.41
Index well beyond pre-crisis peak
120
90
60
2001
2010
2018

150
131.41
Index well beyond pre-crisis peak
120
90
60
2001
2010
2018

150
131.41
Index well beyond pre-crisis peak
120
90
60
2001
2010
2018

150
131.41
Index well beyond pre-crisis peak
120
90
60
2001
2010
2018
But that’s not all.
Normally, banks would tap the brakes on lending, and the market would cool. But since the 2008 financial crisis—when banks became more disciplined—other lenders have muscled in and are keeping the financing flowing. They include debt funds with multibillion-dollar warchests that aren’t subject to the same level of oversight. Some are competing with aggressively low rates and terms. Now even some banks, under pressure to compete, have loosened standards in recent quarters, Fed surveys show.
Debt funds are gaining share of commercial real estate loans…

42%
Debt Funds & Mortgage REITs
38
CMBS*
36
REIT Unsecured
23
GSEs (Fannie Mae & Freddie Mac)
4
Banks
Life Insurance
–1

42%
Debt Funds & Mortgage REITs
38
CMBS*
36
REIT Unsecured
23
GSEs (Fannie Mae & Freddie Mac)
4
Banks
Life Insurance
–1

Debt Funds &
Mortgage REITs
42%
38
CMBS*
36
REIT Unsecured
GSEs (Fannie Mae &
Freddie Mac)
23
4
Banks
Life Insurance
–1

Debt Funds &
Mortgage REITs
42%
38
CMBS*
36
REIT Unsecured
GSEs (Fannie Mae &
Freddie Mac)
23
4
Banks
Life Insurance
–1
…As banks become less dominant

Share of originations in 2017
2.5%
Other
8.6%
REIT Unsecured
26.5%
GSEs
10%
Debt Funds & Mortgage REITs
11.9%
Life Insurance
26.3%
Banks
14.4%
CMBS

2.5%
Other
8.6%
REIT Unsecured
26.5%
GSEs
10%
Debt Funds &
Mortgage REITs
11.9%
Life Insurance
26.3%
Banks
14.4%
CMBS

2.5%
Other
8.6%
REIT Unsecured
26.5%
GSEs
10%
Debt Funds &
Mortgage REITs
11.9%
Life Insurance
26.3%
Banks
14.4%
CMBS

2.5%
Other
8.6%
REIT Unsecured
10%
Debt Funds &
Mortgage REITs
26.5%
GSEs
11.9%
Life Insurance
26.3%
Banks
14.4%
CMBS
The availability of cheap debt helps investors stretch on price. Observers can see it in capitalization rates. Put basically, cap rates are a property’s investment yield—making them the favored metric for gauging real estate prices. It’s a simple calculation: Divide net operating income (rent minus expenses) by a building’s value. They’ve been going down significantly for most property types.
At these levels, buyers of commercial real estate today are, in effect, settling for thin returns or betting they can improve yields over time by persuading tenants to pay more. A 47-acre office park in Santa Monica, California, recently traded hands at such a high price that the expected yield is just below the buyer’s cost of debt. That means the new owners, led by Boston Properties Inc., will have to boost rental income. A large, diversified investor can place and see through such calculated bets. It’s harder for smaller speculators.
Plunging Yields

Retail space
Apartments
Offices
Industrial facilities
10%
10%
10%
10%
6.29%
6.25%
6.46%
Aug. 31
5.29%
8
8
8
8
6
6
6
6
4
4
4
4
2001
2010
2018
2001
2010
2018
2001
2010
2018
2001
2010
2018

Retail space
Apartments
10%
10%
6.46%
Aug.31
8
8
5.29%
6
6
4
4
2001
2010
2001
2010
2018
2018
Offices
Industrial facilities
10%
10%
6.29%
6.25%
8
8
6
6
4
4
2001
2010
2001
2010
2018
2018

Retail space
Apartments
10%
10%
6.46%
Aug.31
8
8
5.29%
6
6
4
4
2001
2010
2018
2001
2010
2018
Offices
Industrial facilities
10%
10%
6.29%
6.25%
8
8
6
6
4
4
2001
2010
2018
2001
2010
2018

Retail space
10%
6.46%
Aug.31
8
6
4
2001
2010
2018
Offices
10%
6.25%
8
6
4
2001
2010
2018
Apartments
10%
8
5.29%
6
4
2001
2010
2018
Industrial facilities
10%
6.29%
8
6
4
2001
2010
2018

Retail space
10%
6.46%
Aug.31
8
6
4
2001
2010
2018
Offices
10%
6.25%
8
6
4
2001
2010
2018
Apartments
10%
8
5.29%
6
4
2001
2010
2018
Industrial facilities
10%
6.29%
8
6
4
2001
2010
2018
Low cap rates have also pushed some investors into less popular corners of the market. Sales of offices in Cleveland more than doubled last year from 2016, in part because the Rust Belt city offers higher yields than faster-growing metros. Resorts—a class of properties that was hit hard during the recession—are finally making a comeback. And niches like student housing and retirement communities have seen investment surge so much that their cap rates have fallen, too. Some investors are now snapping up hospitals and nursing homes.
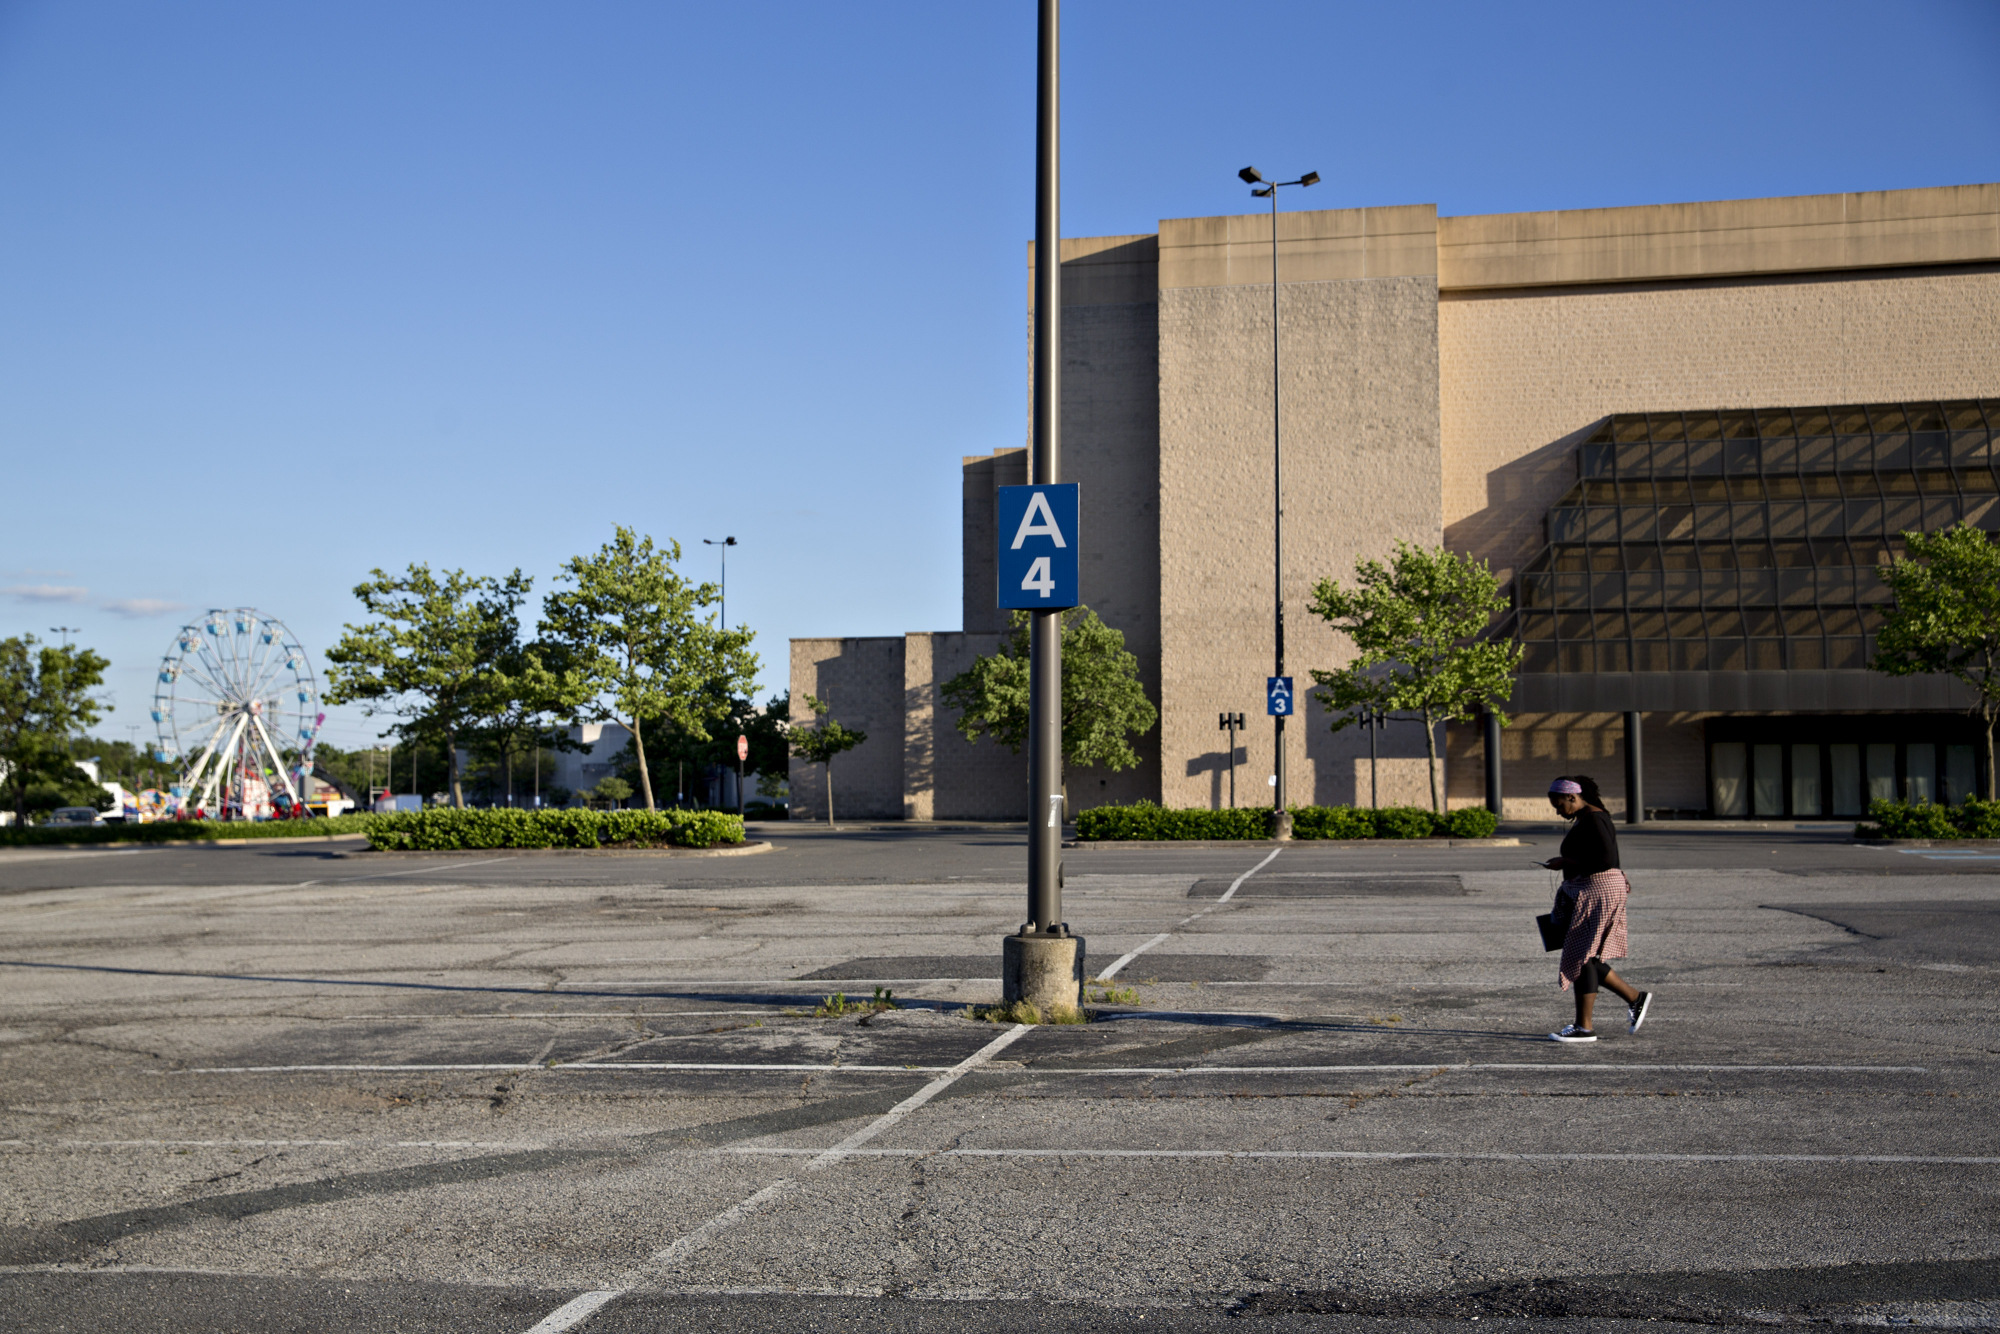
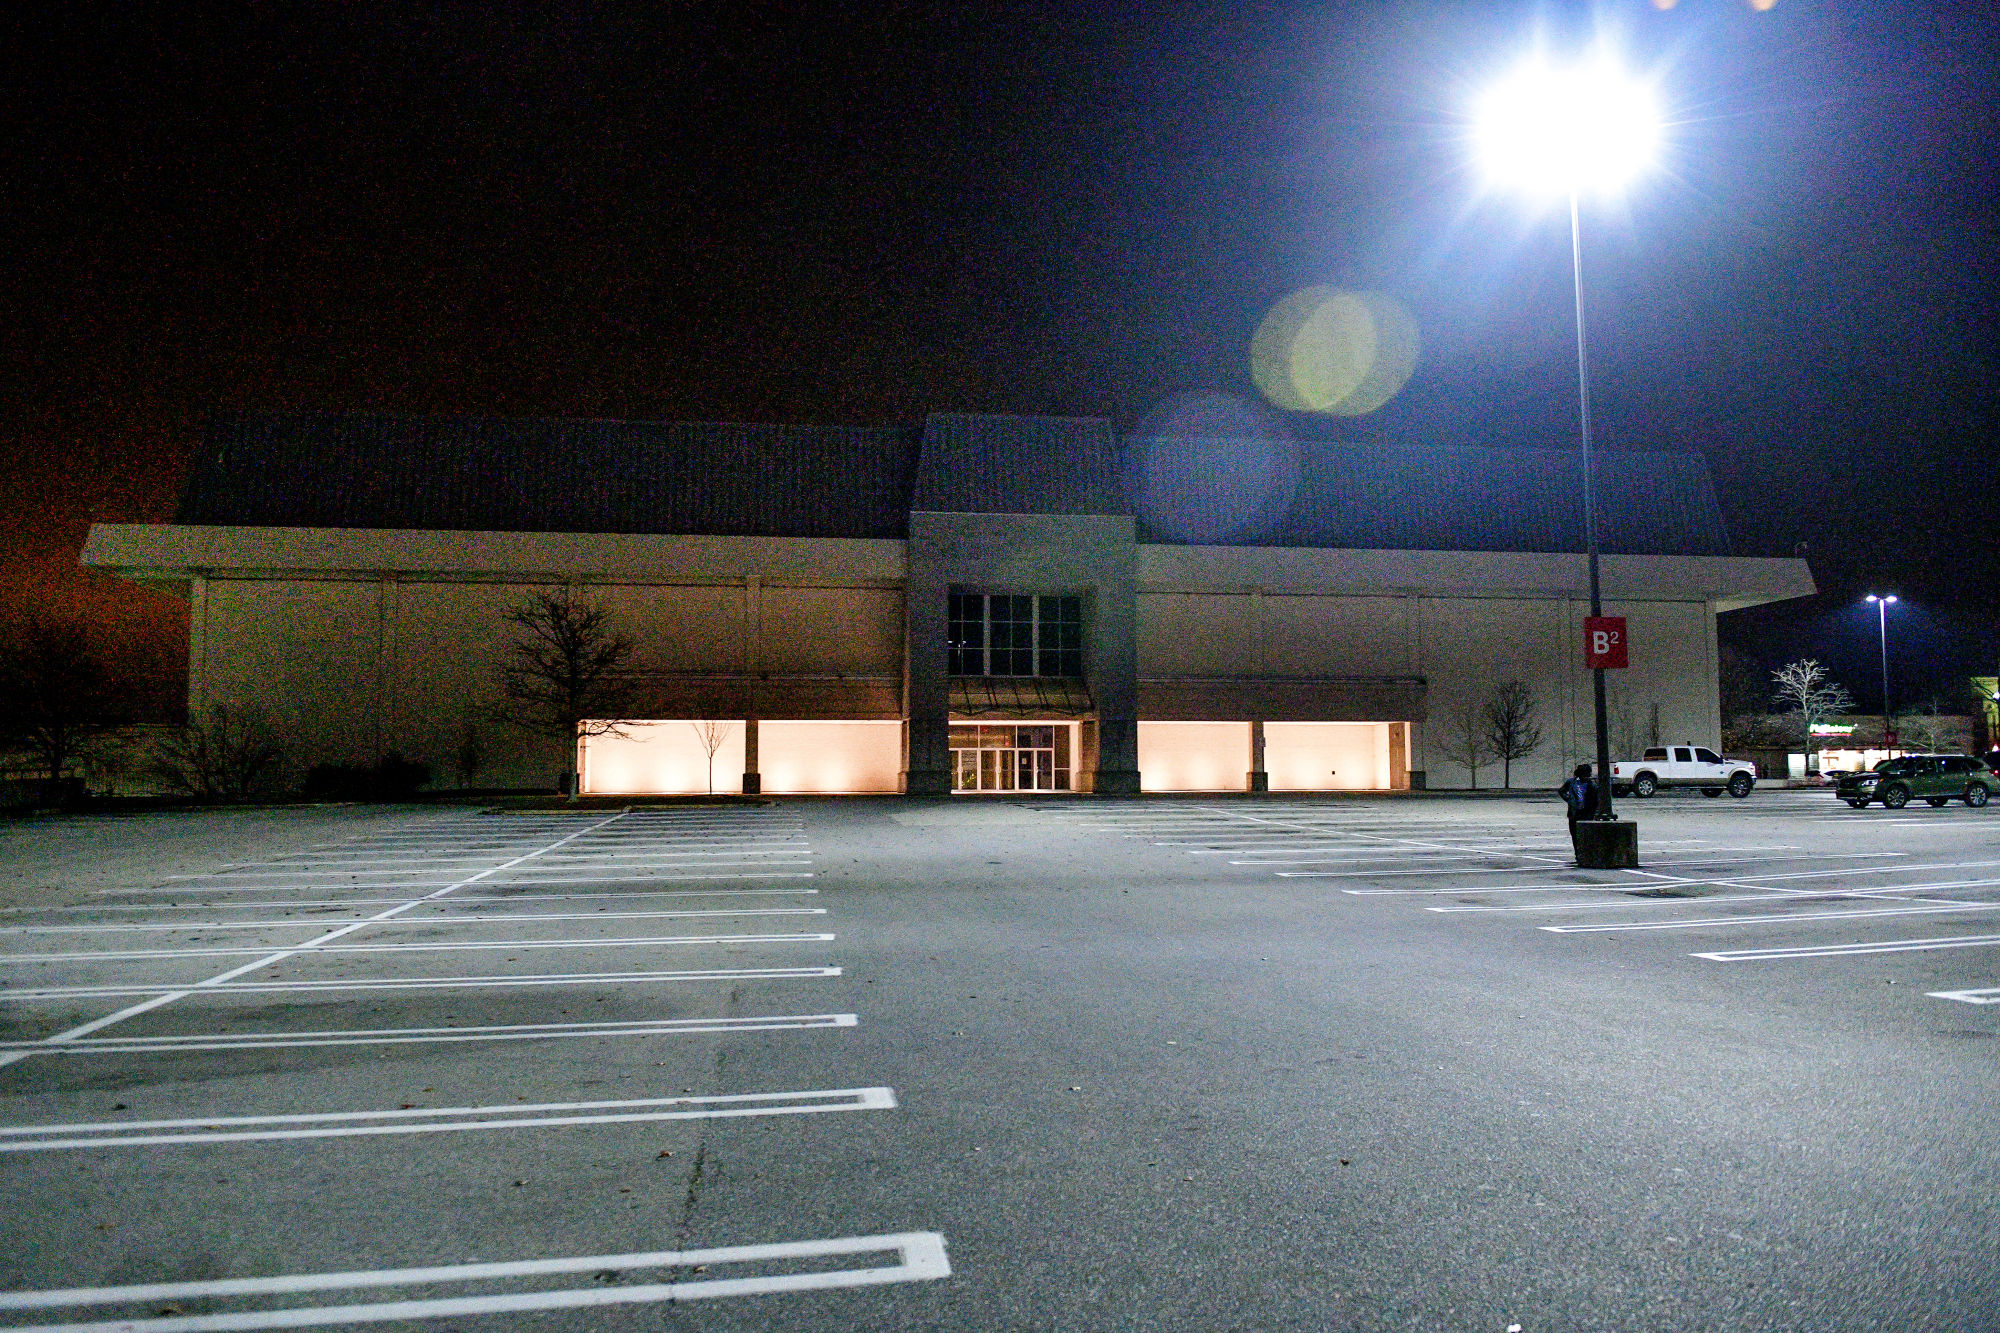
Prices also have been buoyed by low supply in many markets, exacerbating a dramatic slowdown in new construction after the financial crisis. Over the past decade—and still—that has kept occupancy rates high for many types of properties. But there are pockets where there’s too much square footage—especially in retail, as shoppers buy online and chains go bust.
Investors Shun Retail

Retail projects as a share of total U.S. commercial mortgage-backed securities (CMBS) lending
2010
2011
2012
2013
2014
2015
2016
2017
2018
49.8%
$5.4B
44.1%
$25.1
35.1%
$32.6
31.9%
$53.1
26.5%
$57.4
24.9%
$61.9
28.0%
$47.3
21.8%
$47.8
23.0%
$25.8

Retail projects as a share of total U.S. commercial mortgage-
backed securities (CMBS) lending
2010
2011
2012
2013
2014
2015
2016
2017
2018
49.8%
$5.4B
44.1%
$25.1
35.1%
$32.6
31.9%
$53.1
26.5%
$57.4
24.9%
$61.9
28.0%
$47.3
21.8%
$47.8
23.0%
$25.8

Retail projects as a share of total U.S. commercial
mortgage-backed securities (CMBS) lending
2010
2011
2012
2013
2014
2015
2016
2017
2018
49.8%
$5.4B
44.1%
$25.1
35.1%
$32.6
31.9%
$53.1
26.5%
$57.4
24.9%
$61.9
28.0%
$47.3
21.8%
$47.8
23.0%
$25.8

Retail projects as a share of total U.S. commercial mortgage-backed securities (CMBS) lending
2010
2011
2012
2013
2014
2015
2016
2017
2018
49.8%
$5.4B
44.1%
$25.1
35.1%
$32.6
31.9%
$53.1
26.5%
$57.4
24.9%
$61.9
28.0%
$47.3
21.8%
$47.8
23.0%
$25.8
In other areas, supply has recently caught up with demand. That’s the case with apartment buildings. Rents in many of the largest metro areas have been leveling off. The reasons vary: In some markets, tenants just can’t afford more. Builders also have sought profits by neglecting affordable housing and bringing too many high-end units online. Landlords in Seattle, long a hot rental market, are now desperately luring the city’s burgeoning hoard of coders with $6,000 gift cards and free electronics.
Renters’ Market

5%
20%
1%
Decreased
Rent
Increased
2012–13
2013–14
2014–15
2015–16
2016–17
2017–18

5%
20%
1%
Rent
Increased
Decreased
2014–15
2012–13
2013–14
2016–17
2015–16
2017–18

5%
20%
1%
Rent
Increased
Decreased
2012–13
2013–14
2014–15
2015–16
2016–17
2017–18

20%
5%
1%
Rent
Increased
Decreased
2012–13
2013–14
2014–15
2015–16
2016–17
2017–18

Rent
Increased
Decreased
20%
5%
1%
2012–13
2013–14
2015–16
2014–15
2016–17
2017–18
To be clear, financial industry leaders aren’t saying a crisis is already unfolding—just that they aren’t going to pursue as many deals in the present environment. Building owners aren’t buckling under debt like they did a decade ago, when a real estate downturn almost toppled the global banking system. Loan defaults remain rare.
And so money keeps flowing into the market. This week, Deloitte predicted the volume of commercial real estate transactions will jump 13 percent in the next 18 months. Private equity firms keep raising substantial war chests to acquire properties. It all suggests there are both buyers and cash waiting in the wings.