Here’s what U.S. yield curve inversion means for the S&P 500 outlook
Bloomberg Market Specialists Kai Blatnicky, Adriana Bruno and Jane Frampolsky contributed to this article. The original version appeared first on the Bloomberg Terminal.
Background
Yield-curve inversions in U.S. government bonds were seen briefly in late March and again in early April. Rising yields on shorter-term securities followed a strong jobs report and prospects of the biggest Fed rate hike seen in decades seemed all but inevitable. For the first time since 2007 the rate on two-year bonds exceeded the 30-year rate.
Long seen as a strong indicator of an impending recession, the spread between two- and 10-year bond yields saw its greatest inversion in nearly 15 years. The 10-year bonds typically offer a higher yield, as investors require higher returns to compensate for the enhanced risks involved in longer-horizon investments. An inverted curve, where two-year bonds yield more than their 10-year counterparts, is often seen as a signal that a recession is coming, bringing with it lower interest rates.
What’s yet to be seen is whether the Fed’s efforts to curb record inflation will allow for a gentle landing or will instead sink the U.S. economy into recession. Fears that the Fed won’t succeed at gentle tightening were felt during a rough month for equities indexes in April. Among those who see the likelihood of a U.S. recession as high are Randal Quarles, the Fed’s former vice chair for supervision, who left his position with the central bank in December.
“Given the intensity of inflation, the degree to which unemployment has been driven down — to bring that back into an equilibrium, it’s unlikely the Fed is going to be able to manage that to a soft landing,” Quarles said on the IntraFi Network’s Banking with Interest podcast. “The effect is likely to be a recession.”
The issue
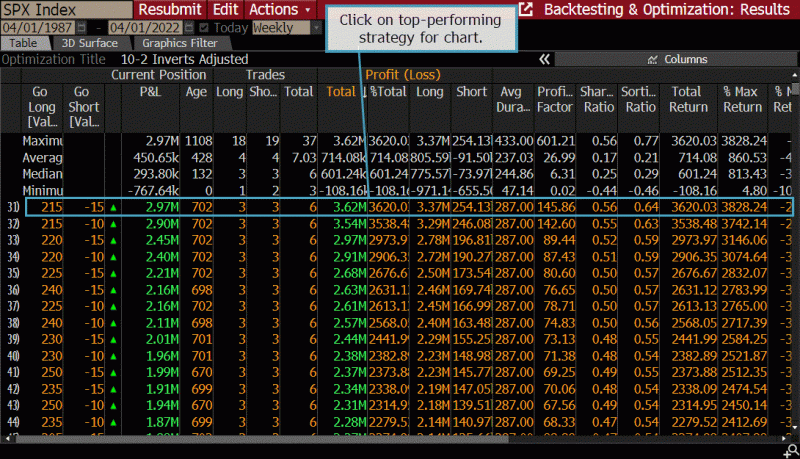
While the inverted two- and 10-year curve may be a strong signal of a looming recession, it’s not itself a signal to sell equities, according to an analysis by Bloomberg. In the analysis, a strategy that shorts the S&P 500 when the 2-10 spread crosses below zero and goes long when the spread rises back above zero was tested against historical results.
The analysis showed that, by contrast, using a short when the spread crosses back above at minus-15 rather than when it crosses below zero, and then a long when it crosses above 215 significantly improved, as of April 1. So if the same were to hold true in the future, long-term investors would do better to short or exit the S&P 500 Index after the 2-10 spread dips below minus-15 basis points and then crosses above that level.
Tracking
Bloomberg functions were used to find the optimal time to exit the S&P following a two- and 10- year bond yield curve inversion.

For more information on this or other functionality on the Bloomberg Professional Service, click here to request a demo with a Bloomberg sales representative. Existing clients can press <HELP HELP> on their Bloomberg keyboard.