In today’s complex and low-latency electronic futures trading marketplace, achieving optimal execution performance with a Volume-Weighted-Averaged-Price (VWAP) trading strategy has never been more challenging. To reduce explicit and implicit costs for buy-side clients, brokers’ trading algorithms must be sophisticated enough to take into account multiple factors in their trading models. Among all those factors, a few carry the most weight: volume profile predictability, spread, liquidity (market impact) and volatility (pricing risk). Over the next three weeks we will explore how these four factors affect the performance of a VWAP strategy in the futures markets.
For those wanting to see the complete analysis (or for those who can’t wait) you can download our entire paper on the topic:
Volume Profile Predictability
Large errors in volume profile prediction not only lead to significant slippage from the benchmark but also potentially result in undesired market impact when the VWAP strategy trades much more than it should—thus defeating the purpose of using VWAP strategy to minimize market impact and reduce information leakage.
Since predictability of volume profile has a large impact on order performance, wisdom dictates that for the order to achieve optimal performance, evaluating predictability for the contracts to be traded and hours of day before using the VWAP is necessary. Our research has shown that the predictability of VWAP strategy in the futures market depends significantly on time of day and type of contracts. Long trading hours of the futures market result in liquidity being more spread throughout the day and, therefore, make volume profile prediction even more challenging.
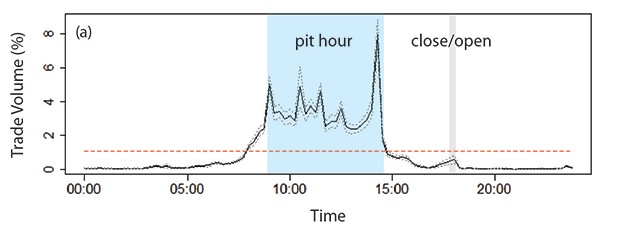
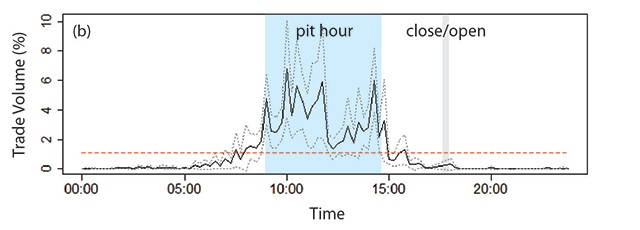
Volume profile predictability is inversely proportional to the variability of the volume percentage (over the whole day) in each time period across multiple trading days. In our study, each time slice is 15 minutes and every trading day consists of up to 96 slices, depending on the type of contracts. For example, natural gas futures trade between 18:00 to 17:15 ET and have 93 slices in a full trading day. 1 Figure 1 shows the volume profiles of NG1 and NG10 based on recent 50 trading days history. The overall volume profile predictability of NG1 is much higher than that of NG10 because of higher liquidity and repeatability (lower variance).


Figure 1. Black solids line are average volume percentages based on historical volume pattern (over the past 50 days) of (a) first month natural gas futures contract (NG1 Comdty) and (b) tenth month natural gas futures contract (NG10 Comdty); gray dotted lines are upper and lower bounds for estimated volume percentage with 95% confidence level; red dashed line is the volume percentage for a hypothetical whole day TWAP.
To offer traders a reliable indicator for deciding whether to use VWAP strategy for executing orders, Bloomberg Tradebook devised an intuitive quantitative measure of VWAP strategy effectiveness. Please find more details about the methodology and measurement results on various futures contracts in the research paper.
Next week we will cover how Spread Costs affect the VWAP strategy performance.