Earnings season – Getting the full picture
This article was written by Keith Gerstein, Financial Analyst at Bloomberg.
Earnings season is an important time for analysts and portfolio managers. Being able to make the best possible prediction from the available data can be enhanced by access to new and unique data sets. Looking at the EPS or revenue is now just another piece of the puzzle, with KPIs and additional underlying data helping to paint a fuller a picture for understanding a company and making future assessments. For firms to stand out amongst a strong field of analysts, unique insights highlighting both the depth and breadth of unique data is required.
Pulling information from the financial models can require deeper insights than traditional IS, BS, and CF metrics. To gain a full picture of a company’s decisions, and their impacts with beats and misses, taking advantage of their KPIs that are both company and industry specific can provide a deeper understanding then traditional top line data.
Pulling together ever more granular data
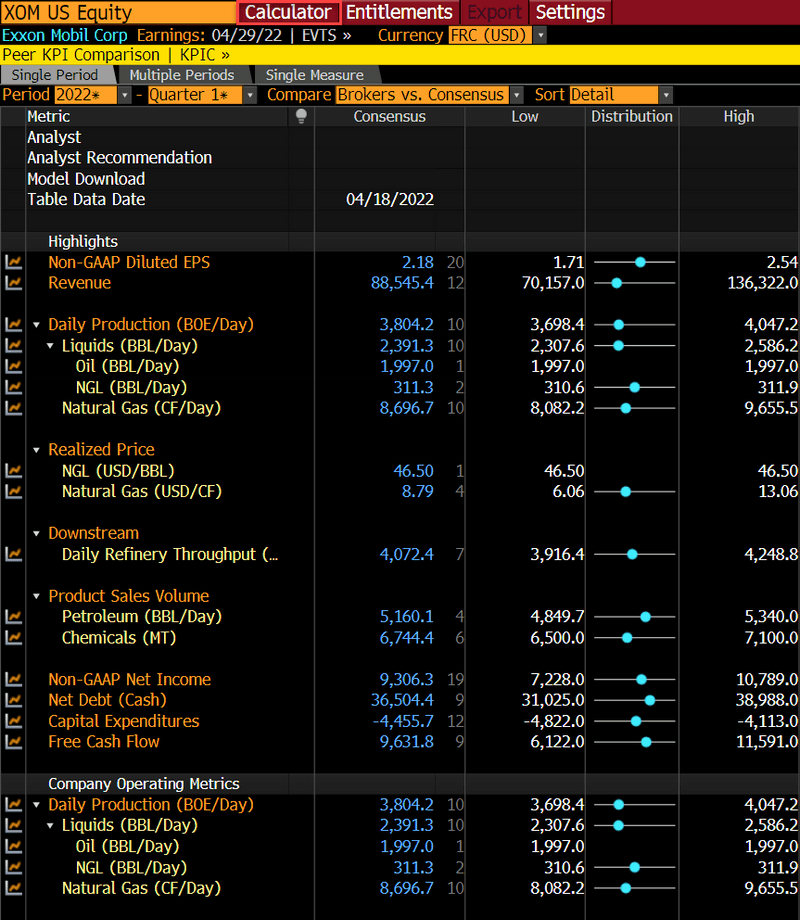
Key Performance Indicators outside the IS, BS, and CF, from Bloomberg’s MODL product can provide more granular analysis. For instance, changes to the Oil & Gas industry’s price per barrel of oil or the Airline industry’s fuel expenses or passenger revenue can provide insight into how world events are potentially affecting these industries from their consumers.
For major oil and gas providers, the US price per barrel has continued to increase, with the expected Q2 price for Exxon reaching its highest levels since 2014. An action that coincides with a daily production of liquids that is expected to reach its highest point since 2019, a pre-COVID value, just beating it’s expected 2022 Q1 record. With inflation hitting record levels, understanding how these economic impacts may affect industries is important as it will impact consumer decisions.
The economic impacts of the Oil & Gas industry can also affect the Airline industry’s KPIs such as RPM and Load Factors. As people look to re-enter the travel market, higher costs and demand can lead to record level revenue. Despite this, we saw stagnation in some airlines for Load Factor, showing that anticipation of post-COVID travel may not be enough in the face of higher prices. As airlines adapt to increased fuel costs, cutting back routes, and higher costs, the future is still in question.
While record demand would traditionally lead to record levels of revenue, it will take until Q2 of 2022 to exceed passenger revenues of a pre-COVID era. Non-Gaap EPS for the Q2 is also expected to be positive, highlighting that although fuel expenses continue to rise, revenue will outperform these costs. Line items like fuel costs rising to 2019 levels despite RPM and APM that still have not reached 2019 levels, and dwindling load factor in Q1 help to paint a fuller picture. The APM for Q2 continues to decline in estimates significantly by brokers, while aircraft fuel costs continue to balloon, showing the obstacles airlines will have to face in Q2.

The Bloomberg advantage
The number of ways that Bloomberg provides to parse through data give users a step up when analyzing filings.
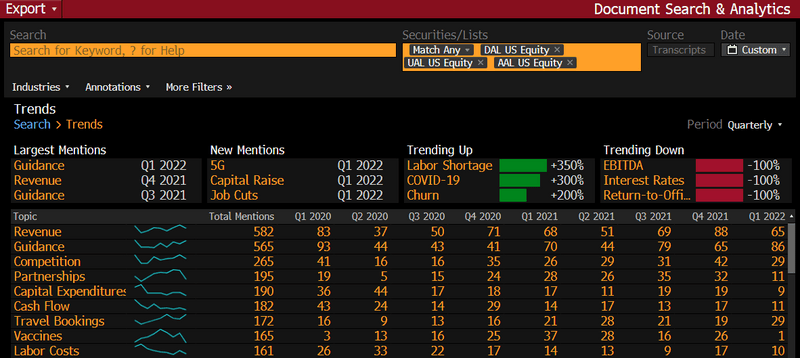
Bloomberg understands that there’s more than a single way to view and understand the data. To provide clients more resources, we’ve provided additional ways to generate insights. In order to see what companies are disclosing in their filings as well as earnings calls, you can use the document search functionality, DSCO <GO>, to see the most mentioned items in the reports, as well as other trends. Not only do we take the traditionally structured data, and provide insights from companies’ traditional documentation, but we also use technology to help identify new trends as well. Looking into the three major American Airlines, you can see that Travel Bookings was the third most talked about item during Q1 2022 for the three tickers, and fuel costs has increased in mentions in Q1 2022.


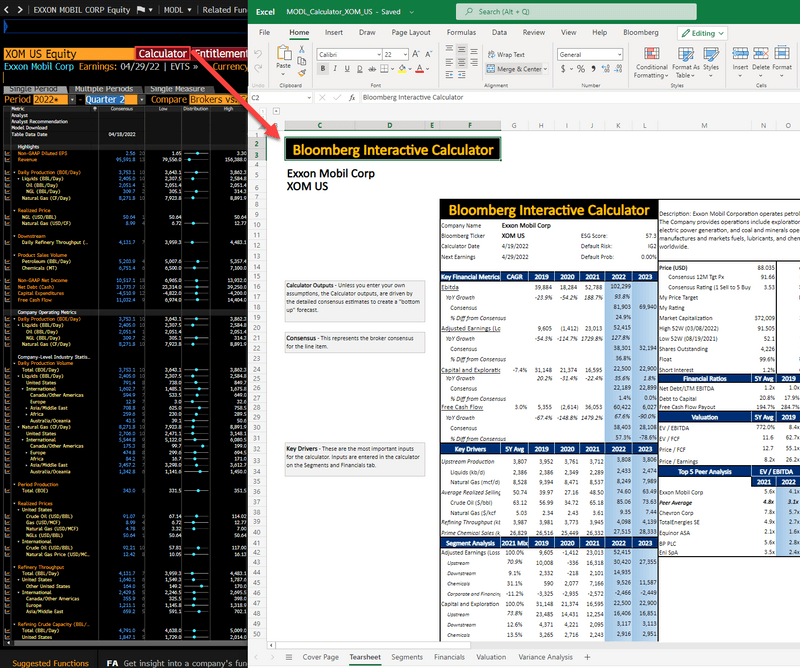
Additionally, we’ve now begun to incorporate our BI Calculators into MODL. These calculators use company-reported data, and street-driven estimate consensus data, to help clients build out models on a Bloomberg-curated platform. Clicking the calculator button at the top of the MODL screen will bring you to a Microsoft Excel sheet in your browser that will let you see Bloomberg generated fields and consensus, and allow you to adjust the assumptions driving the sheet.

No matter where analysts source their data, they should ensure vendors provide them with timely and relevant information to stay on the front foot. Bloomberg’s breadth of data and analytics tools help analysts and portfolio managers differentiate themselves and make recommendations quicker. If you’re interested in learning more about MODL, BQuant or other Bloomberg solutions to help you get ahead with differentiated data, request a free demo of our tool.