This analysis is by Bloomberg Intelligence Chief Global Derivatives Strategist Tanvir Sandhu. It appeared first on the Bloomberg Terminal.
The bond market selloff brings interest rates volatility into focus, particularly near-dated options, aka gamma. Popular volatility selling strategies face the risk of further choppy price action as the market tries to find an equilibrium. Principal component analysis allows us to reduce complexity and highlight relative value.
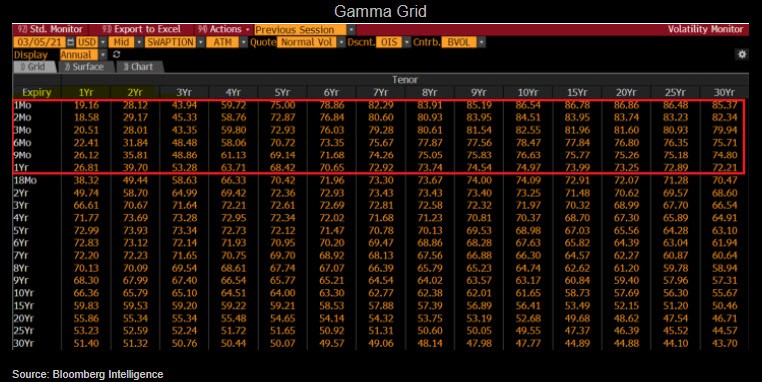
The volatility surface
For interest rate swaptions, implied volatility is the variation expected in swap rates. Gamma refers to the one-month to one-year (1m-1y) expiry part of the volatility surface. The surface can be further divided by swap tenor: short tenors on the left side are driven by trades related to central-bank policy rates, while long tails on the right side are about macro developments. The most active players in that part of the surface are fast money and systematic volatility sellers. Volatility related to policy rates is typically lower than longer tenors, but experiences sudden moves higher as expectations of policy changes increase.
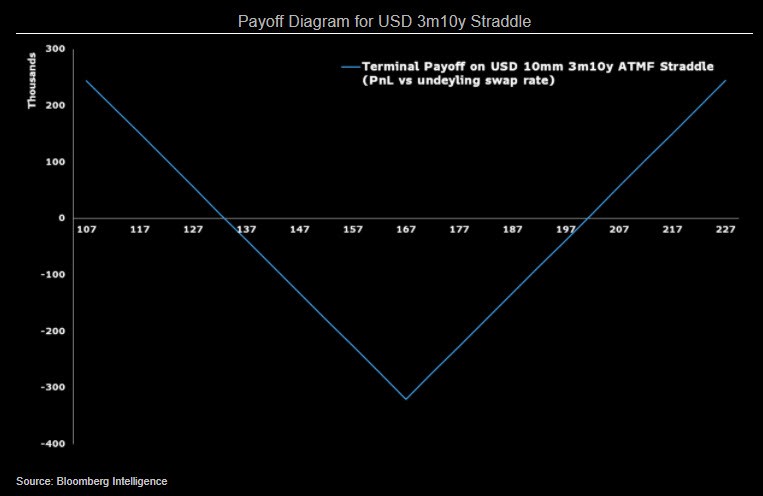
Pricing and payoff
The 3m10y straddles are now pricing 34 bps move in either direction for the 10y swap rate i.e. a range between 1.33% and 2%, which doesn’t seem unreasonable relative to the outlook. In terms of cost, it’s about 320 bps compared with 240 bps at the start of the year. In other words, per 10 million notional value, the cost of the option strategy is up by 80,000.
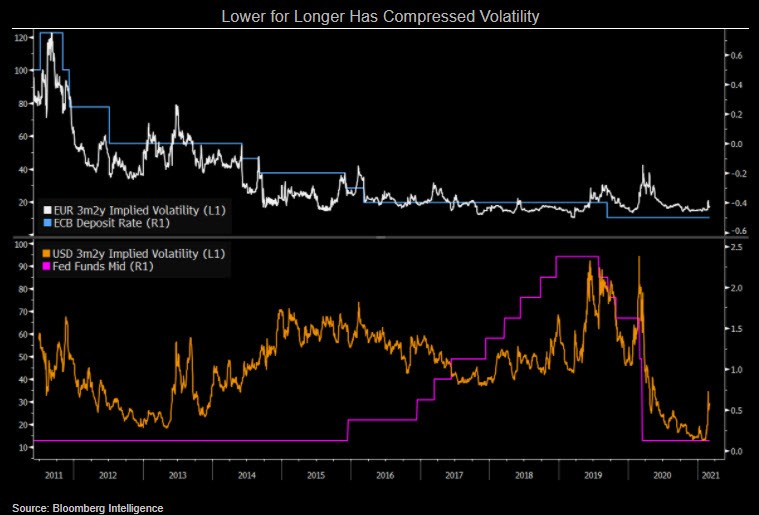
Selling insurance against fire
The hunt for yield has driven flow into systematic selling of volatility in recent years, given the low macro dispersion and central bank predictability. Selling volatility is one of the most popular strategies in equity derivatives and has grown in popularity in rates as a way of enhancing returns from asset stability. Selling straddles on 1m10y is typical, but gamma selling comes in other variations. Transaction data from Swap Data Repository (SDR) can give a sense of flows but it’s difficult to disentangle the data, given it doesn’t provide trade direction or intention. The latest spike in volatility, with yields moving swiftly higher and some whipsaws, will be tempting to fade, but the risk is of continued elevated realized volatility. Selling vol works well in periods when policy uncertainty is low.
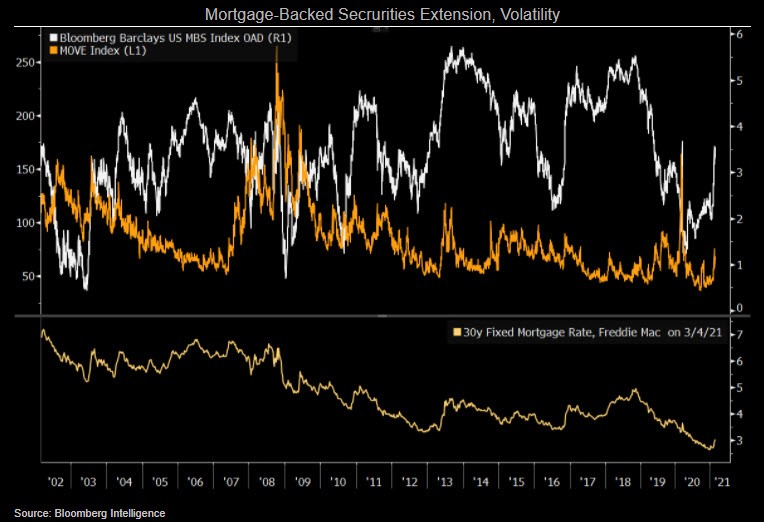
Mortgage hedging: Always a concern but it’s not 2003
Historically, mortgage portfolio managers have been major buyers of short-dated volatility, given their hedging needs. However, the flow is much smaller than before the financial crisis as the composition of owners has changed. The benchmark convexity event is considered to be the 2003 bond market selloff, when government-sponsored enterprises (GSEs) dominated. Their holdings have decreased significantly, while ownership by the Federal Reserve has ballooned. Mortgage-backed securities are exposed to negative convexity, so the duration extends as yields rise. That’s due to fewer homeowners refinancing and prepayments as yields rise. The hedging of this extension risk depends on the sensitivity of the holder. Active hedges, such as real-estate investment trusts (REITs) and GSEs, are now a much smaller part of the market.
Convexity needs reduced, but not gone
Hedging of interest-rate risk by owners of mortgage-backed securities has declined, but is not gone, as the Fed has increased its holdings. Large holders of MBS, such as banks, continue to hedge interest-rate exposure, and large moves in duration would cause such actors to hedge the increased risk. The GSEs, once the important actors causing convexity-related market moves, are now a tiny portion of the market. REITs, though they have increased holdings in the past decade, remain small participants.
