Block Trading in Today’s Electronic Markets
The following is excerpted from a study conducted by our quantitative research team about block trading in the equity markets.
Block trading, or trades with sizes much larger than average, has been a feature of equity markets for a long time. Electronic markets have made information about such trades more readily available. Additionally, block trade analytics, like MBTR on the Bloomberg Professional service®, can monitor and analyze the information. Our goal is to analyze otherwise hard-to-read information based on publicly available datasets and find nuggets of information that might prove useful to the participants in today’s “big data”–driven markets. We examined block trading, however ambiguously defined, to highlight characteristics of how markets publish and digest information regarding blocks being printed on the tape.

CAN WE IDENTIFY ALL BLOCK TRADES ON THE TAPE?
In this analysis, we looked at stocks listed on the U.S. exchanges (NYSE EURONEXT and NASDAQ OMX listed) and the London Stock Exchange. U.S. equity markets are some of the most transparent markets in the world. They feature a consolidated tape, which shows all trades done in a given security in a publicly available data feed. Regulation dictates that all off-exchange or ATS-executed trades be reported to one of two trade reporting facilities at NYSE or NASDAQ. Regulation ATS rules govern all off-exchange activity in all publicly traded securities. Block trading desks are subject to similar reporting requirements, hence, all block trades can be seen on the tape within a limited amount of time.

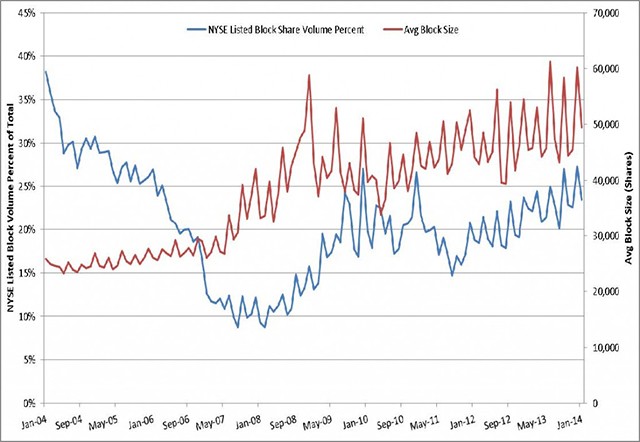
NYSE Rule 72 defines a “Block” as at least 10,000 shares or $200,000 USD, whichever is less. Thus, for stocks priced at less than $20, a 10,000 share trade can be a block, but in higher-priced stocks even a 1,000 share trade could constitute a block. Large trade sizes are extremely valuable to institutional investors to access liquidity. As markets have moved to higher levels of fragmentation and electronic access, larger-size trades have been on the decline. NYSE’s “Facts and Figures” provides data for blocks going back to 2004. Figure 1 shows the block volume as a percent of total NYSE volume and average block trade size in listed stocks. Contrary to intuition, block trading on NYSE has been inching higher since Regulation NMS and the financial crisis of 2008. The most recent data point suggests around 25% of NYSE volume is blocks. Moreover, average block size has gone up steadily over the years. One thing to note is that NYSE’s market share, and hence volume, has gone down steadily over a similar time frame. This could explain the high block market share in recent years. It’s unclear if the NYSE dataset filters the open and closing auction prints, as the open and closing prints are frequently large prints and can be considered a block by that definition.
We performed a study on a profile of blocks across stocks based on groups of average daily volume of shares traded and time of day. We used 10,000 shares or more as a definition for the rest of the study. In a later study, we will discuss the effect of determining the size that constitutes a block and how to do so on an individual-stock basis. Our dataset allows us to compute block-based statistics for different sizes of blocks and specifically exclude trades that we believe are not blocks, such as auction prints, from our analysis.
Kapil Phadnis is head of Quantitative Research at Bloomberg Tradebook where he is responsible for U.S. equities algorithmic execution strategies, liquidity management and smart order routing. He specializes in U.S. equity market microstructure, execution automation and statistical modeling. Prior to joining Bloomberg Tradebook, Kapil worked at the Citadel Investment Group on global equity quantitative portfolios and as a researcher at NASA and the Applied Physics Laboratory in Seattle.