This analysis is by Bloomberg Intelligence ESG Analyst Shaheen Contractor and ETF Analyst Athanasios Psarofagis. It appeared first on the Bloomberg Terminal.
As the ESG asset class grows and regulators increase scrutiny, BI’s ETF Exposure Scorecard is a helpful tool to examine fund characteristics and identify questionable holdings. We’ve designed the scorecard to improve investors’ understanding of the environmental, social and governance characteristics of ETFs, using some of the more widely available ESG metrics, and to assist in the selection process. Combining our exposure scores with active share and fees may pinpoint reasonably priced ETFs. A low active share and high expense makes it hard for a fund to beat the benchmark.
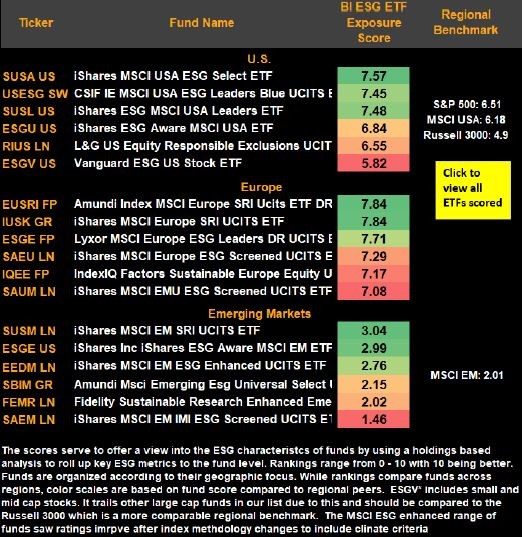
Our analysis identifies the iShares and Amundi versions of the MSCI Europe SRI ETF as leaders in Europe allocation. The iShares ESG MSCI USA Leaders ETF tops rankings in the U.S. while the iShares ESG Aware MSCI USA is a laggard.
How to compare ESG exposure as scrutiny grows? BI ESG ETF score
As environmental, social and governance (ESG) funds face increasing regulatory scrutiny, examining the ESG characteristics of ETFs can be one way to help identify questionable credentials and avoid greenwashing concerns. BI’s new ESG ETF Exposure Scorecard brings investors greater understanding of the subtleties in the strategy.
Webinar replay: Unpacking ESG ETF exposures
As ESG grows and regulatory scrutiny increases, understanding the ESG characteristics of funds and the level of integration will become a necessary part of fund analysis.
Listen to the replay of our webinar, in which BI analysts Shaheen Contractor and Eric Balchunas, along with Desiree Fixler, former group chief sustainability officer at DWS, unpack BI’s ESG ETF scores and work through key topics that will define ESG integration and fund construction.
Shedding light on exposure using the BI ESG ETF scoring model
Determining a fund’s ESG exposure will likely become an important element of analysis, given elevated regulatory scrutiny and greenwashing concerns. The SEC’s alert on the compliance gaps within U.S.-based ESG funds points to this increased scrutiny. In addition, the wide-scale rebranding of funds to include ESG criteria might add to concerns in light of little transparency. Examining fund holdings to determine their ESG characteristics, as in our BI ESG ETF Exposure Scorecard, can be one way to address such issues.
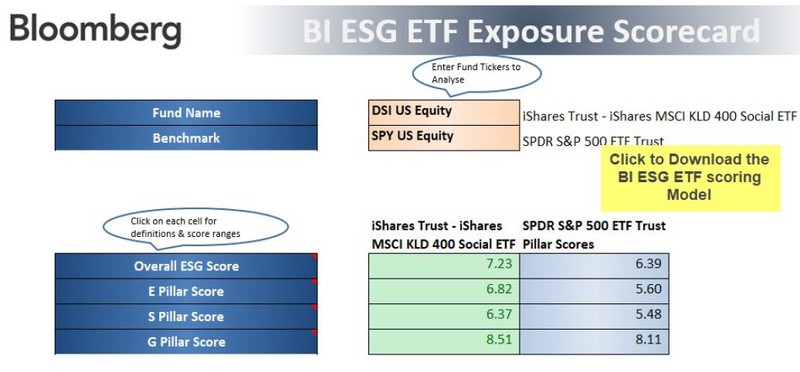
We leverage data and scores to shed light on the ESG exposure of funds. Our model enables users to create a score for an ETF and its benchmark, representing the extent to which ESG has been integrated. Key metrics across the E, S and G pillars are rolled up to the fund level.
ESG ETF scoring model

BI ESG ETF exposure scorecard: Measuring intensity
Funds have varying ESG intensities, as indicated by our scores, exposing potential greenwashing risks. BlackRock’s iShares MSCI USA ESG Select ETF, Amundi’s MSCI Europe SRI ETF and iShares’ MSCI EM SRI ETF are among regional leaders, indicating high levels of ESG exposure. Even as ESG ETF assets crossed $441 billion in 2021, understanding a fund’s ESG impact is a challenge given the opacity of some strategies and wide range of ESG definitions. Those that trail in our rankings exhibit varying characteristics such as a small-cap bias. Funds that trail regional peers after accounting for such divergences may warrant analysis, depending on an investor’s goals.
BI recently launched a dashboard showcasing our scores across U.S., emerging and developed/global market ESG ETFs.
BI ESG ETF scores

Europe funds lead on ESG; EM benefit marginal
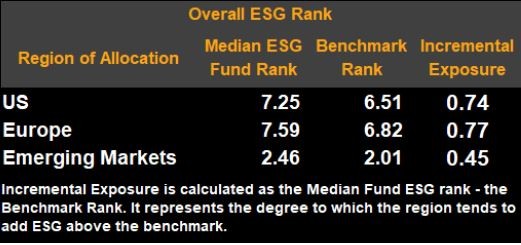
ESG ETF exposure varies widely by region of allocation and our analysis summarizes some of the more stark regional trends across the E, S and G pillars. Driven by better corporate disclosures and performance in Europe, funds allocated to the region have the greatest degree of ESG intensity as indicated by a median score of 7.59. Companies in emerging markets are far behind developed-market peers on ESG and trail as a result. EM funds also seem to offer the lowest incremental exposure as measured by the median fund rank vs. its regional benchmark.
Our universe includes some of the largest funds that use an ESG strategy and represents 26% of assets held in global equity ESG and values-based strategies as of 2021.
ESG score: Median fund score by region
