Bloomberg Market Specialist Li Zhao contributed to this article. The original version appeared first on the Bloomberg Terminal.
Background
The Hang Seng Index (HSI) is a free-float capitalization-weighted index used to track the largest companies traded on the Hong Kong Stock Exchange.
In May 2021, Hang Seng Indexes Co. announced their biggest overhaul to date in an effort to adapt to the realities of the post-pandemic market. The changes include expanding the number of constituent companies from 52 to 80 by mid-2022, reducing listing history requirements to three-months for new companies and capping a stock’s weighting at 8%.
These broad revamps address consistent underperformance of the HSI relative to its global peers in 2020, with the benchmark index near its lowest level versus the MSCI World Index in 17 years. They also reflect the growing influence and dynamism of the technology sector in China’s economy. “This decision is going to completely change the nature of the index, which has been characterized as one with low valuation and low growth rate for a long time,” Yang Lingxiu, strategist at Citic Securities Co., told Bloomberg News.
The issue
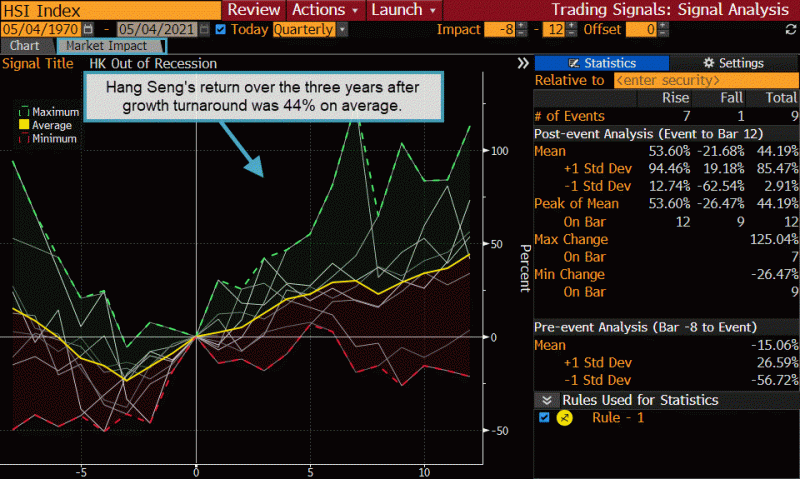
Over the last five decades, Hong Kong’s gross domestic product has seen its year-on-year cross above zero from below eight times. Seven of those instances have seen the HSI rebound in the next 12 quarters. With exports surging, the HSI has signaled a positive growth turnaround for the ninth time, ending a six-quarter downturn.
If the average historical gain is any guide, this end to Hong Kong’s economic contractions could indicate a dramatic stock-market boom, with the HSI returning about 40% over the next three years.
Bloomberg functions can be used to see the historical market impact of a return to growth. The red line indicating the worst loss of 22% refers to the signal in 1999, when the Hong Kong stock market suffered from the United States’ dot.com bubble crash.

Hong Kong stocks have underperformed relative to their U.S. peers since 2009, and the HSI is currently trading near its lowest level against the S&P 500 since the 1998 Asian financial crisis. Though market uncertainty remains, given the social unrest of 2020 and lasting uncertainty around a slow vaccine rollout, the first quarter of 2021 shows positive signs for the HSI’s continued growth, with GDP rising 7.8% and March’s exports surging above HK$400 billion ($51.5 billion) for the first time ever.
Bloomberg’s Trading Signals and Line Chart functions can perform technical and fundamental stock-market analysis of Hong Kong stocks.
Tracking
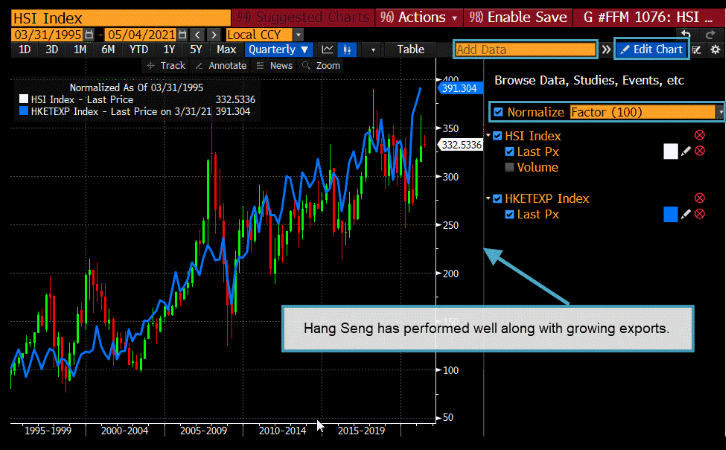
To visualize export trends and Hang Seng performance, use the Graphical Chart function.

Type “gp hsi candles quarterly since 1995” and hit GO. Type “hk exports” in the amber Add Data box and select HKETEXP Index.
For more information on this or other functionality on Bloomberg Professional Services, click here to request a demo with a Bloomberg sales representative. Existing clients can press <HELP HELP> on their Bloomberg keyboard.