
Bloomberg Professional Services
- Zero-Centered Scores (ZCS) preserve relative rankings while also capturing the magnitude of corporate sustainability outperformance or underperformance, enabling consistent comparisons of companies across industries.
- Bloomberg analysis shows that by linking ESG Scores to peer–group medians, ZCSs form more stable time series than Percentiles, which are sensitive to changes in the universe. Using ZCSs makes it easier to spot broad-based improvers and avoid misleading inferences.
- Back–tests show evidence that portfolios optimized on ZCSs performed better than those optimized on Percentiles. The incremental information in ZCSs translated into more useful portfolio construction signals.
This article was written by Zarvan Khambatta, Head of Sustainable Investments Quantitative Research, Michael Zhang, Didier Darricau, and Crystal Zhang, Senior Sustainable Investments Quantitative Researchers at Bloomberg.
Investors are interested not only in whether ESG scores matter for returns, but also how to use them effectively. In a prior blog post, Are ESG scores relevant for portfolio returns, we found indications that higher ESG Scores were linked to stronger performance. In this article, we build on that by examining how different ESG score variants can be applied to portfolio construction—and why the choice of metric can make a difference.
PRODUCT MENTIONS
We begin by examining methodological differences between Bloomberg’s ESG Zero-Centered Scores (“ZCS”) and Peer Group Percentiles (“Percentiles”), illustrating why ZCSs are a more stable and comparable measures for quantitative analysis and portfolio design. We then present back–tested results from optimized portfolios to demonstrate how these two ESG score variants could perform in practice.
Screening or filtering exercises can be implemented effectively with Percentiles, which are simple to calculate and easy to understand. However, quantitative analysis or the formulation of a function that uses a sustainability analytic to determine security weights in a portfolio or index—either via optimization or tilting—would benefit from additional information encapsulating the magnitude of outperformance or underperformance contained in ZCSs, which is not captured by Percentiles.
What are the key characteristics of Zero-Centered Scores?
Bloomberg ESG Scores measure best-in-class performance of a company’s management of financially material corporate sustainability issues. The issues deemed material in the Environmental (E) and Social (S) pillars are peer group-specific. The scores also factor in a company’s level of quantitative data disclosure. Since the average levels of company-reported data in the E and S Pillars vary considerably across industries, Bloomberg ESG Scores are not comparable across peer groups. That is, a score of 3, say, may indicate a laggard in one peer group, but an average company in another.
This is not an issue for analysts studying narrowly specified industries, but it poses a problem for portfolio managers or index providers whose tradable universe spans multiple sectors. To facilitate comparisons across broad market portfolios, practitioners often use peer group-specific percentiles as a way of identifying leading and lagging companies. Percentiles rank companies by their relative standing within a peer group, making them effective for filtering or screening exercises—for example, excluding the lowest 10% of companies from a portfolio.
Bloomberg’s Zero-Centered Scores, by contrast, go beyond ordinal ranking and provide an added element of the magnitude of a company’s outperformance or underperformance on sustainability relative to its peers, much like a Z-score. The Zero-Centered Score represents the difference between a company’s ESG Score and its peer group’s median ESG Score from the previous fiscal year, with the prior year’s median floored at 1.5. ZCSs can range from –10 to 8.5, with higher values indicating better outcomes.
The median company in a peer group has a ZCS near 0, outperforming companies have ZCSs greater than 0 and underperforming companies have ZCSs less than 0. Any two companies, from any peer groups, that have the same ZCSs can be considered to be performing equally relative to their specific peer averages. Corporate sustainability performance can thus be compared across all peer groups through this lens.
Each year’s peer-group medians are determined for an essentially fixed set of core companies. This provides year-over-year stability of ZCSs by virtue of a time series that is more robust to changes in the overall scoring universe (additions, removals etc.) than a time series typically constructed using Percentiles or ranks. This feature is particularly valuable for analyses of score changes over time (e.g., identifying improvers).
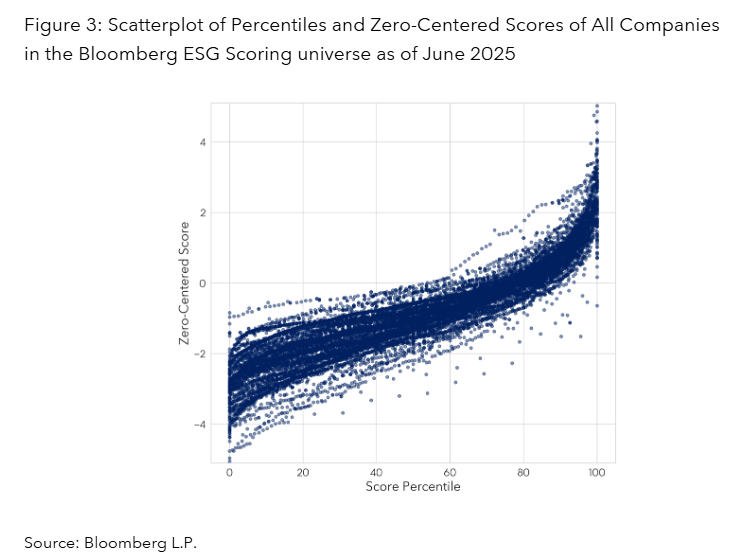
Percentiles and ZCSs have different scales. Percentiles span 0 to 100, and ZCSs can range from –10 to 8.5, though in practice the range is approximately -4 to 4. Nevertheless, these two metrics are highly correlated since ZCSs preserve the ordinal information captured by Percentiles. For many types of analysis, investors could use either measure and obtain similar results.
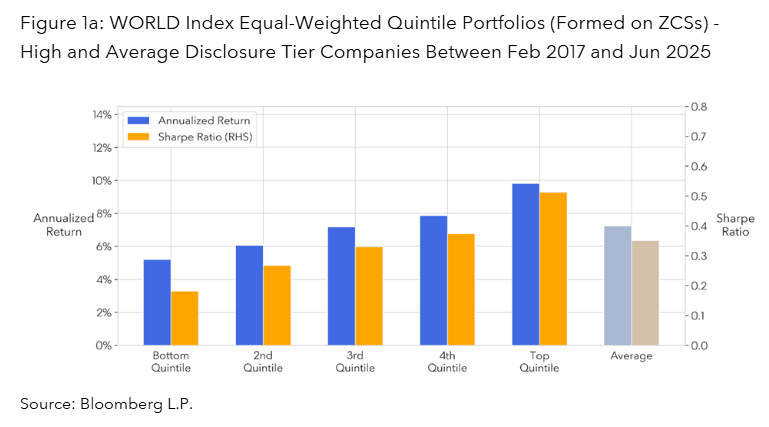
To illustrate this, we use point-in-time ZCS and Percentiles data retrieved via Bloomberg Query Language (BQL) for the subsequent analysis. We reproduce a chart we presented (as Figure 5a) in our earlier article and show it as Figure 1a here. It shows the historical returns and Sharpe ratios of quintile portfolios formed by sorting on ZCSs of companies in the Bloomberg WORLD Index that have High or Average levels of quantitative data disclosure, as defined in the previous article.
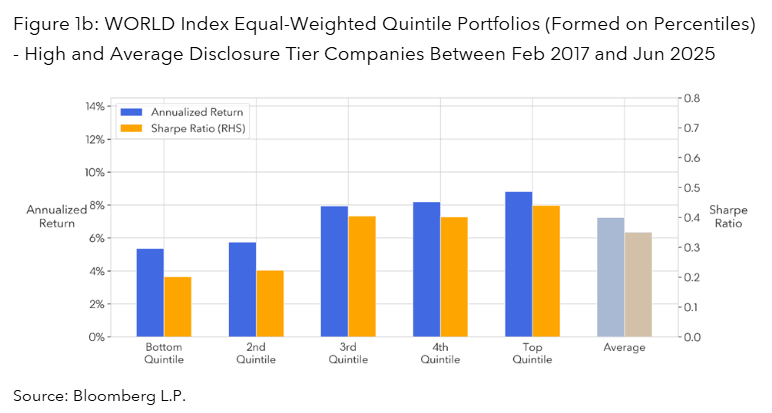
Figure 1b shows results for the same set of companies, but for quintile portfolios formed on Percentiles. In both cases, the results are similar: the quintile portfolios of companies with better sustainability performance (i.e., higher ZCSs or Percentiles) exhibited higher returns than those with worse sustainability performance. Though not shown here, the same pattern is seen in market value-weighted quintile portfolios.
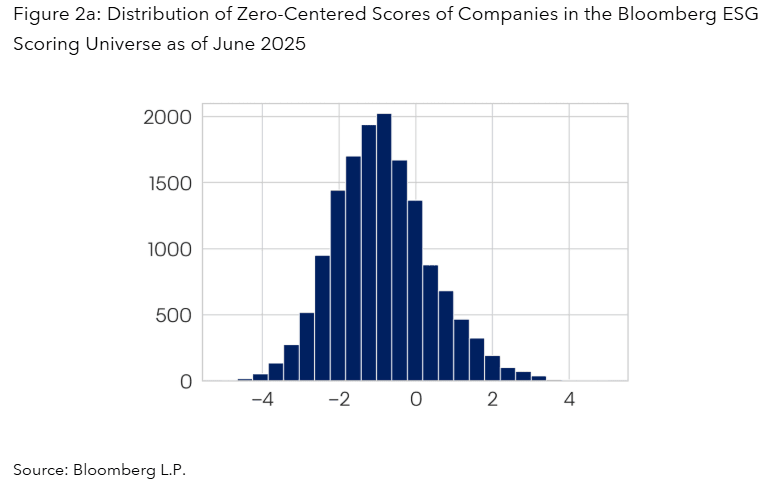
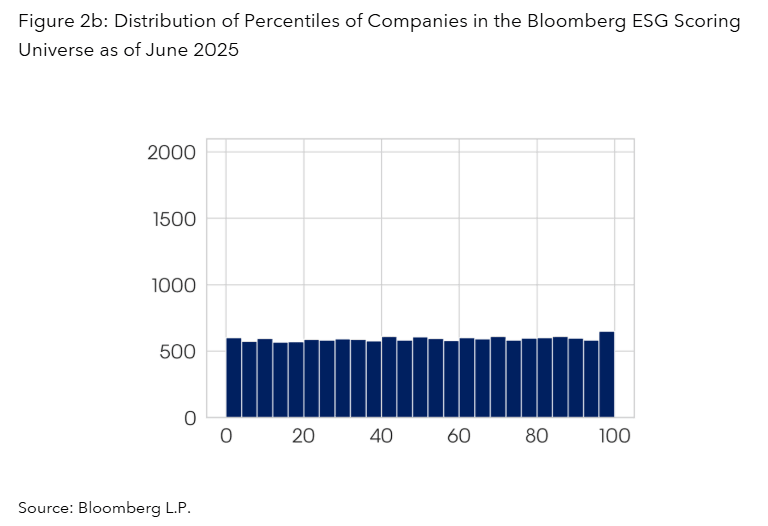
To understand how Percentiles and ZCSs differ we examine how their values are distributed. Figures 2a and 2b show histograms of the distribution of all companies that have Bloomberg ESG Scores in June 2025, using ZCSs and Percentiles as the ESG–score metric, respectively. Percentiles, by definition, follow a uniform distribution, with approximately the same number of companies in each quantile.
By contrast, the ZCS distribution is bell–shaped, with a concentration of companies near a ZCS of –1 and very few companies with very low (–4) or very high (4) ZCSs. This reflects that few companies underperform or outperform their peer averages by a significant amount. Thus, in this example, ZCSs distinguished marginally better performance from exceptional outperformance and could have helped portfolio managers calibrate portfolio tilts.
The scatter plot in Figure 3 makes the differences in the distributions more evident. The two metrics are highly correlated and follow a linear trend for the most part. However, there is some dispersion of ZCSs at any given Percentile.
How do Zero-Centered Scores improve portfolio optimization?
We now present the results of two portfolio optimization exercises that used Zero-Centered Scores and Percentiles as their ESG signals, respectively. Once more, we limit our universe to companies in the Bloomberg WORLD Index that have ESG Scores based on High or Average quantitative data disclosure.
We utilized Bloomberg’s PORT Optimizer and Bloomberg’s Multi-Asset Class Fundamental risk model (MAC3) to maximize each portfolio’s ESG signal (ZCS or Percentile, respectively) while limiting ex-ante annualized tracking error volatility (TEV) to the WORLD Index to 3% and simultaneously constraining total active factor risk exposures to near zero.
This allowed us to create two portfolios that closely track the WORLD Index benchmark while varying individual security weights to maximize the ESG signal (ZCS or Percentile). Additionally, we utilized the risk model to do this in a manner that prevents any incidental active risk factor exposures—such as country, industry or style (e.g. momentum, value)—between the portfolio and the benchmark. Thus, any differences in performance between the two portfolios and the benchmark index should have been due primarily to the effect of security selection effects resulting from the use of different sustainability metrics. Note that for a more comprehensive description of the “Selection Effect”, please see the return attribution analysis in our prior blog post.
Figure 4a summarizes portfolio performance statistics relative to the benchmark, Figures 4b and 4c show the portfolio performances for the period from 17 March 2017 – through 30 June 2025.
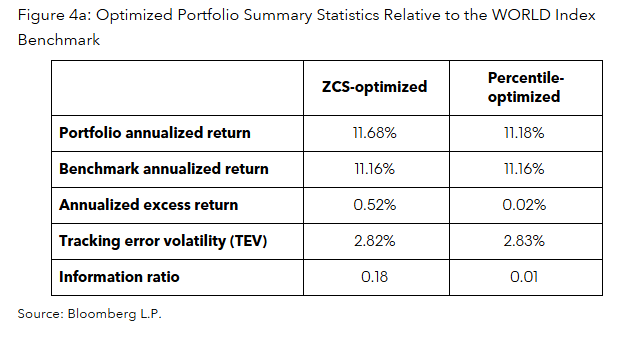
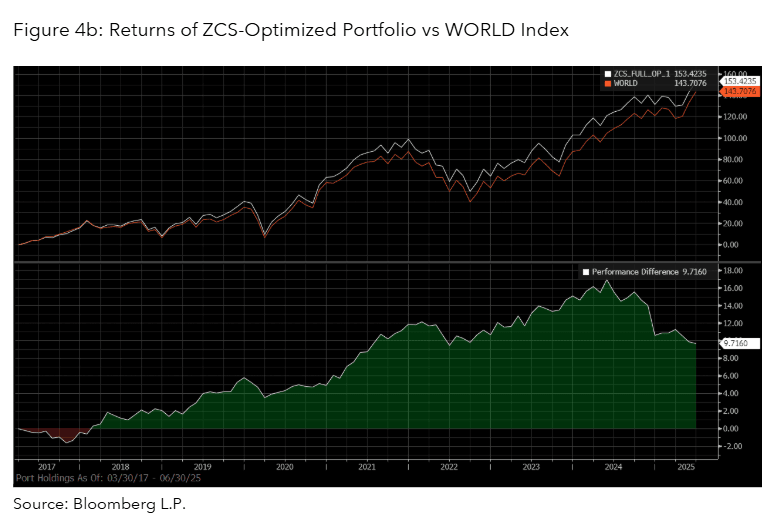
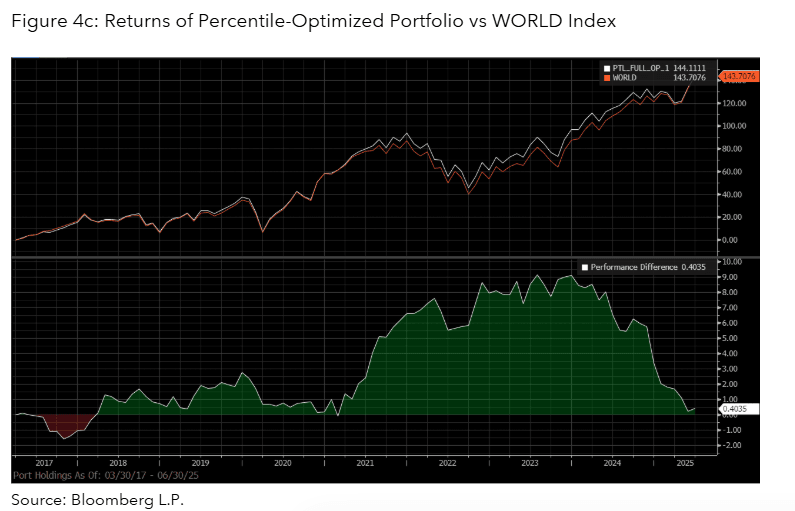
In the back-tests, the portfolio optimized to maximize the Zero-Centered Score (ZCS) delivered an annualized return of 11.68%, outperforming the benchmark by 0.52% annualized over the period. By contrast, the Percentile-optimized portfolio largely tracked the benchmark and did not show sustained outperformance.
These results exclude transaction costs; adding turnover constraints or other cost controls would likely reduce realized excess returns. Given identical tracking–error limits and near-zero active factor-risk constraints for both portfolios, the performance gap most likely reflects the incremental sustainability-related information captured by ZCS rather than differences in factor exposures.
Key takeaways: ESG score selection makes a difference for portfolio construction
For investors, the choice of sustainability metric matters. Peer Group Percentiles are simple and effective for screening, but they can fall short when applied in portfolio construction. Zero-Centered Scores, by contrast, provide richer information that enables more stable comparisons across industries and time, and—as the back–tests showed—could enhance portfolio performance. Investors looking to integrate sustainability considerations into systematic processes may therefore benefit from relying on ZCS as their primary input. Put simply, when it comes to ESG scores, measuring how much better or worse a company is than its peers can make a difference.
Nothing in the Services shall constitute or be construed as an offering of financial instruments by Bloomberg, or as investment advice or recommendations by Bloomberg of an investment strategy or whether or not to “buy”, “sell” or “hold” an investment. Information available via the Services should not be considered as information sufficient upon which to base an investment decision. Bloomberg makes no claims or representations, or provides any assurances, about the sustainability characteristics, profile or data points of any underlying issuers, products or services, and users should make their own determination on such issues. All rights reserved. ©Bloomberg.