Which ESG factor drives excess return? Turns out it’s governance
This analysis is by Bloomberg Intelligence ESG Analyst Simone Andrews and Senior Credit Analyst Noel Hebert. It appeared first on the Bloomberg Terminal.
Stronger governance practices and improvement in ESG performance disclosure scores could be a driver of excess returns over time for the U.S. corporate index, based on our analysis of quarterly data from the beginning of 2015 to present. Better governed and higher momentum companies delivered 10-30 bps more in excess returns, based on Sustainalytics’ ESG rankings. Notably, higher-rated companies don’t always drive higher ESG rankings.
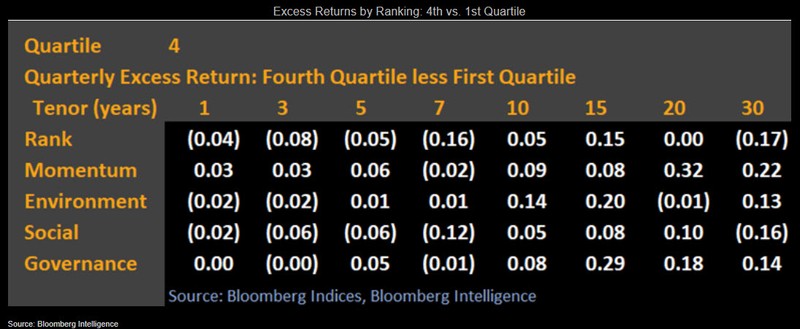
Momentum, governance better return drivers
Excess return differentials between the fourth (best) and first (worst) quartiles shows little investor distinction across most ESG metrics reviewed. There is a bias toward neutral-to-negative relative returns for better ranked credits in the front end of the curve, and neutral to stronger returns for 10 years and out. Being highly rated overall (rank), or in the social metric was largely invaluable in performance terms, whereas higher momentum and stronger governance companies delivered roughly 10-30 bps in added excess returns over the forward three months.
We take the arithmetic average of quarterly forward excess returns from the beginning of 2015 to present.
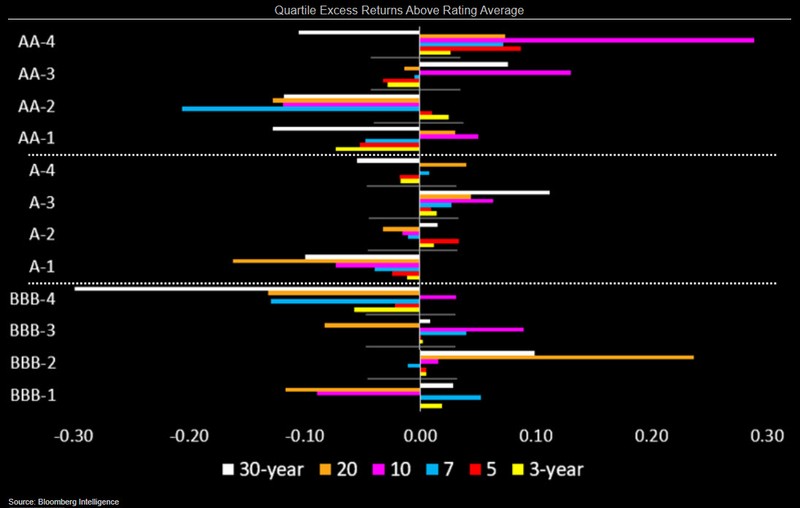
Differentiation grows with rating rise
Outperformance doesn’t always — or even often — accompany bonds in the top quartile in terms of the Sustainalytics rank. BBB rated bonds even have a bit of an inverse relationship, with second quartile (lower half) ranked paper delivering returns above the broader BBB average, and in excess of those with better ESG scores. In the higher-rated spectrum, however, there is a clearer value, with third-quartile A rated debt and fourth-quartile AA bonds delivering added basis points vs. the average for like-rated paper. For AA debt, in particular, excess average quarterly returns range from mid-single to low-double digit bps.
ESG factors growing relevancy for creditors
Utilizing Sustainalytics’ ESG Risk Rating scores, creditors can determine a borrower’s ESG exposure and how these factors impact performance and credit quality. ESG factors more often protect against downside risk, with governance issues playing an important factor across sectors. Social and environmental issues tend to be more event driven.
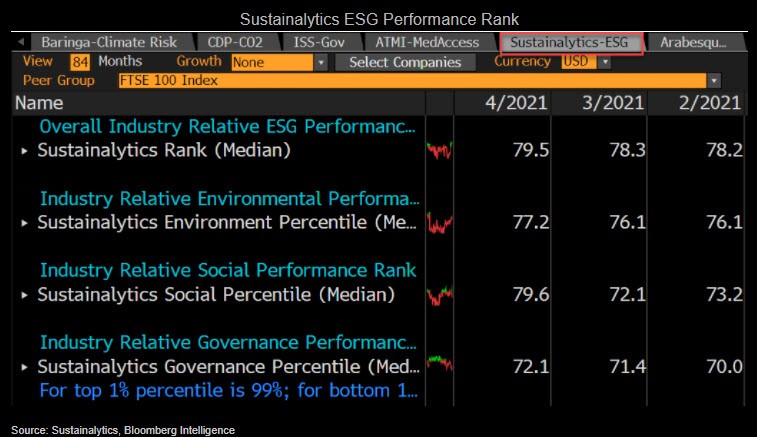
The Sustainalytics ratings, like other scores, measures the degree to which a company’s economic value is at risk and the magnitude of unmanaged ESG risks. The aggregate performance score encompasses a company’s level of preparedness, disclosure and controversy involvement across all three ESG themes. The momentum score tracks whether ESG performance is strengthening or weakening. The ranking ranges from 1% to 99%; with 99% being the best.
Companies pressed to disclose more ESG metrics
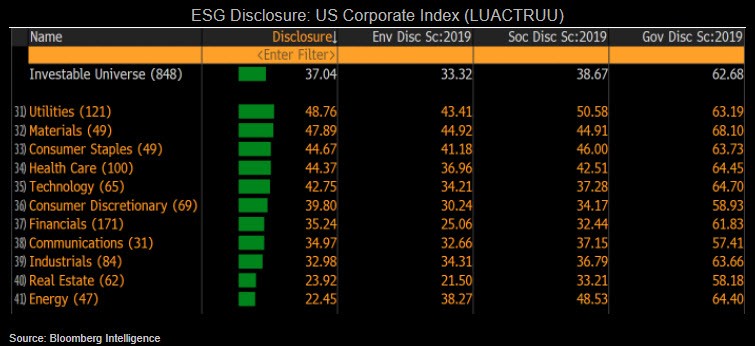
We anticipate more investors and regulators to push for better ESG disclosures to evaluate performance, particularly as climate-related data for corporate credit remains poor. Analyzing the companies on the Bloomberg Barclays U.S. Corporate Index, the average Bloomberg Disclosure score is 37%. Disclosure is even worse for environmental issues, where the average is 32%. While disclosure has improved over the last three years, President Biden’s administration may push for rules that require companies to divulge climate-related risks.
Disclosure scores for energy, industrial and communications companies including TC Pipelines, H&R Block and Fox Corp. fell below the average. Bloomberg’s ESG disclosure scores measure the amount of data a company reports publicly and doesn’t include performance.
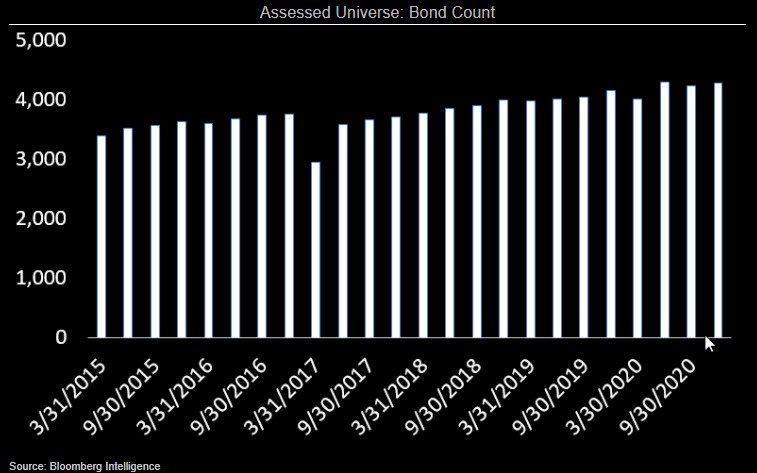
How we ran the data: Methodology
Quarterly index constituents are pulled from 1Q15 forward for the Bloomberg Barclays U.S. Corporate Bond Index. From there, we eliminate bonds with no three-month forward return data, often bonds dropping from the index owing to the maturity rule (150-300 bonds for most periods). We then map the bonds to the related equity ticker, which is used to associate the various Sustainalytics scores. Bonds lacking scores are eliminated, dropping the assessed universe by 2,000 on average and resulting in a range of 3,396 bonds in 1Q15 to 4,277 qualifying bonds for 4Q20.
Eligible bonds are then broken into quartiles. This is done at the bond vs. company level to ensure distribution of bond count, though it may result in periodic over-sampling of a given issuer.