Bloomberg Professional Services
This article was written by Niall Smith, Senior Sustainable Investments Quantitative Researcher at Bloomberg.
Markets appear to be pricing physical climate risk into the cost of capital for firms. Our analysis, using indicators from Bloomberg and Riskthinking.Al, indicates that firms with higher physical risk exposure (+10 percentage points in asset damage rate) face a +22bps premium in their Weighted Average Cost of Capital (WACC), even after accounting for sector, region and size.
This pricing effect is most pronounced in Latin America and Asia, and within the Materials and Utilities sectors. These findings highlight the need for investors to systematically integrate such factors into valuations and asset allocations, and for companies to demonstrate resilience through transparent disclosure and adaptation.
PRODUCT MENTIONS
Measuring the financing premium of physical climate risk
To measure the financing premium of physical climate risk, we analysed a broad-based universe of publicly listed companies across global markets, linking their sectoral classification, region and country of risk with fundamentals including market cap and Weighted Average Cost of Capital (WACC).
To capture exposure to climate-related extremes, we drew on our physical risk indicators – produced with a bottom-up methodology from Riskthinking.AI overlayed with Bloomberg’s granular asset-level data. The indicators represent the potential costs of repairing or replacing a company’s assets due to impacts from 10 different hazards, including tropical cyclones, riverine and coastal flooding, and heat stress.
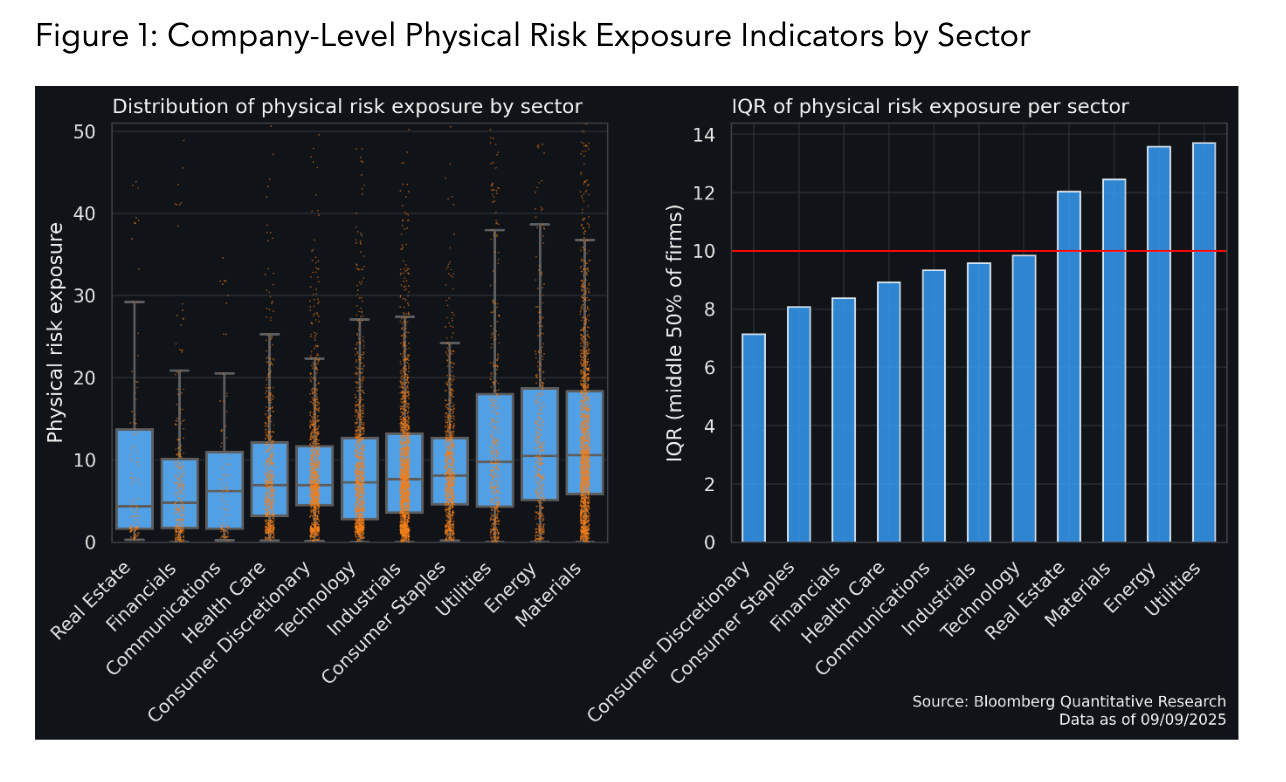
For this analysis we chose to retrieve data representing a company’s average asset damage rate over the 2030 time horizon considering all hazards. However, users of the data can specify exposures to specific hazards, and across any time horizon through 2050 in 5-year intervals. Descriptive analysis of these indicators reveals that across sectors, the average interquartile range (i.e. the middle 50% of companies in each sector) equates to approximately 10 points (see Figure 1 below). We therefore use +10 points as a benchmark throughout the analysis, to signify the typical spread between a more exposed and a less exposed company in the same sector.

Why is the climate risk signal hard to detect?
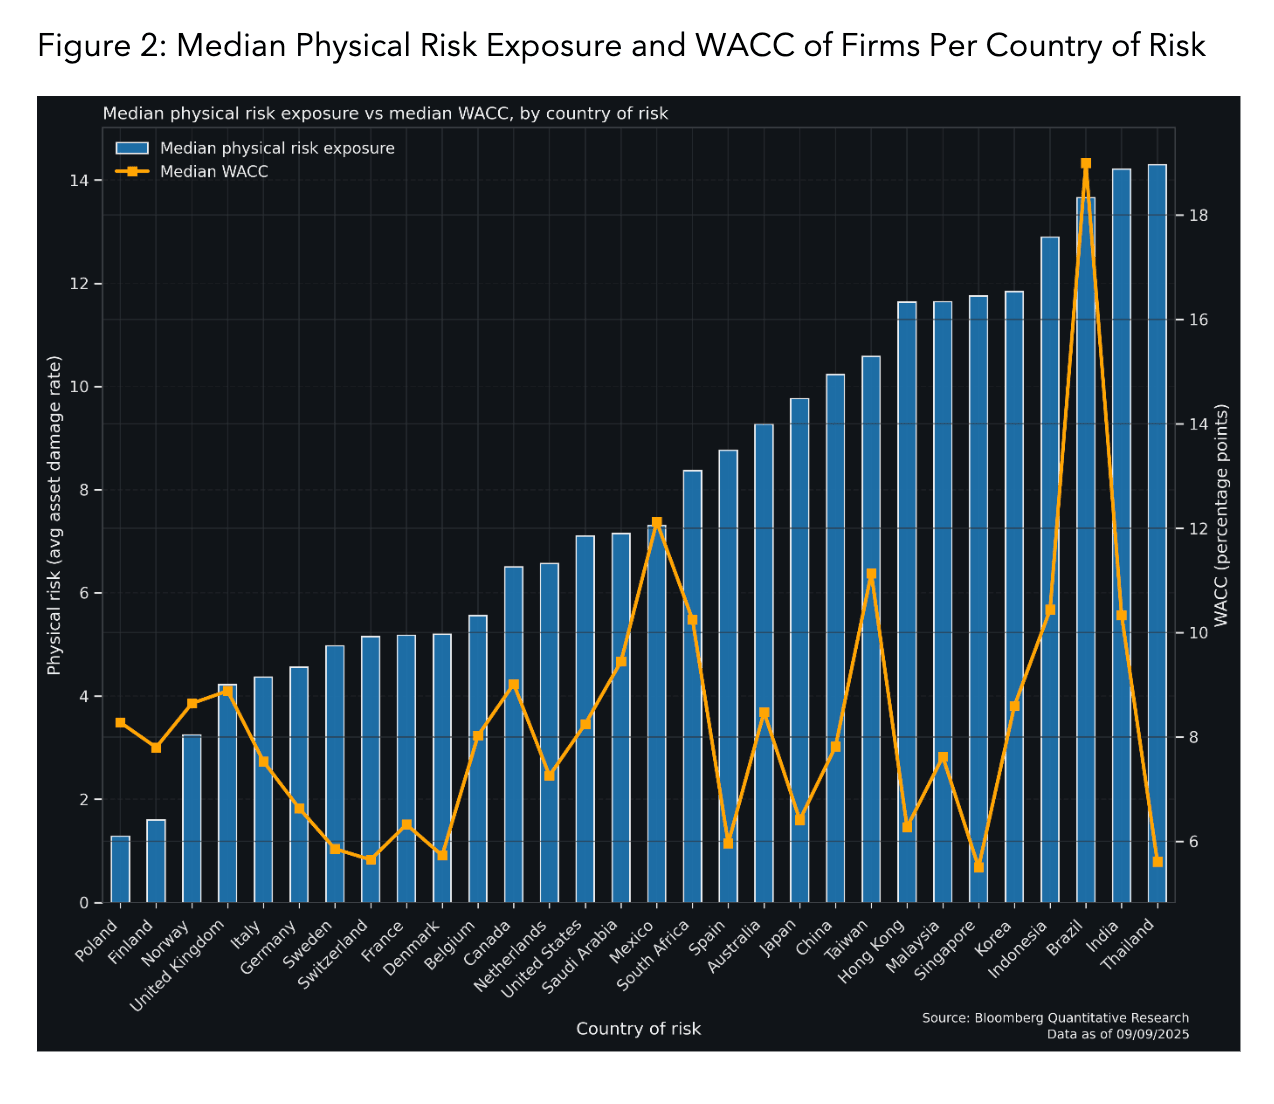
Initially, descriptive analysis of the raw firm-level data is unconvincing in supporting the hypothesis. Physical risk exposure indicators show no simple unconditional correlation with WACC, neither globally across firms, nor across country averages. Firms in some countries tend to have both high WACC and high physical risk exposure (e.g. Brazil), but the relationship is noisy and inconsistent, as you can see in Figure 2. This warranted further investigation through regression analysis to control for region, sector and firm-size which can all influence financing costs alongside physical climate risk exposure.

Evidence of a physical risk premium
We estimate a cross-sectional ordinary least squares regression of WACC on physical risk exposure, controlling for economic sector, region, and size. This was carried out to test whether markets globally price physical risk exposure after accounting for structural factors. The model provides evidence that physical risk exposure is associated with a positive change in WACC, specifically +22bps per +10 climate risk points. It is statistically significant (p-value <.001) and consistently positive across the 95% confidence interval (12-31 bps).
When country fixed effects are added the link becomes less conclusive, which likely reflects that much of the variation in WACC occurs between countries, and that limited within-country variation in physical risk makes it harder to detect. This does not overturn the global finding, but suggests the pricing operates more across countries and regions than strictly within them.
It’s also important to note that the effect does not map neatly onto country averages. As shown previously (Figure 2), there is no apparent correlation between the median physical risk exposure and median WACC by country. Together these results imply that markets may be pricing physical risk into financing costs, but that they’re not simply applying a straightforward ‘country risk premium’ to firm-level WACC. Instead, the pricing signal appears across the global universe of firms rather than a simple country-average effect.
What are the hotspots for climate risk and financing costs?
We then looked to understand if physical risk is priced more strongly in some regions and sectors than in others. This was done by producing models with interaction terms as well as fitting a series of subsample models, specific to regions and sectors, to test them explicitly. Indeed, it was revealed that the effect of physical risk on WACC for companies was more pronounced and more reliable in certain cases.
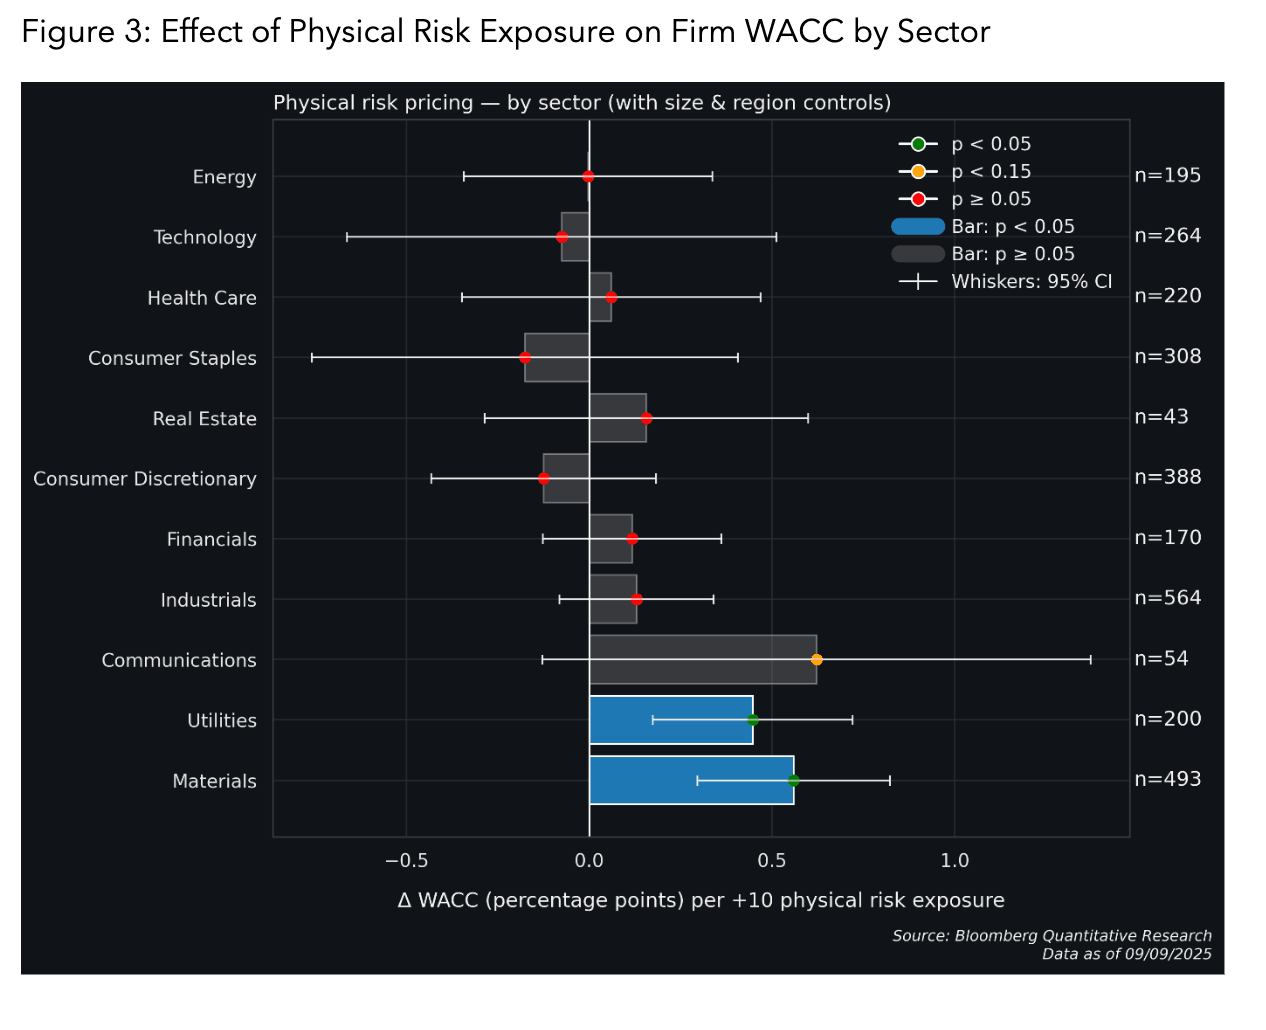
When studying sectors, companies in Materials and Utilities had the most robust results, experiencing on average +56bps and +45bps WACC per +10 point increase in physical risk (see Figure 3 below). Similarly, firms in Communications experience +62bps, but the finding is less conclusive. All other sectors had coefficients lower than the global effect. This finding is quite theoretically consistent, suggesting that capital markets are attuned to the fact that asset-intensive sectors with typically higher PPE (Property, Plant & Equipment) values are more exposed to the physical impacts of climate change, and are actively factoring this into risk premia.

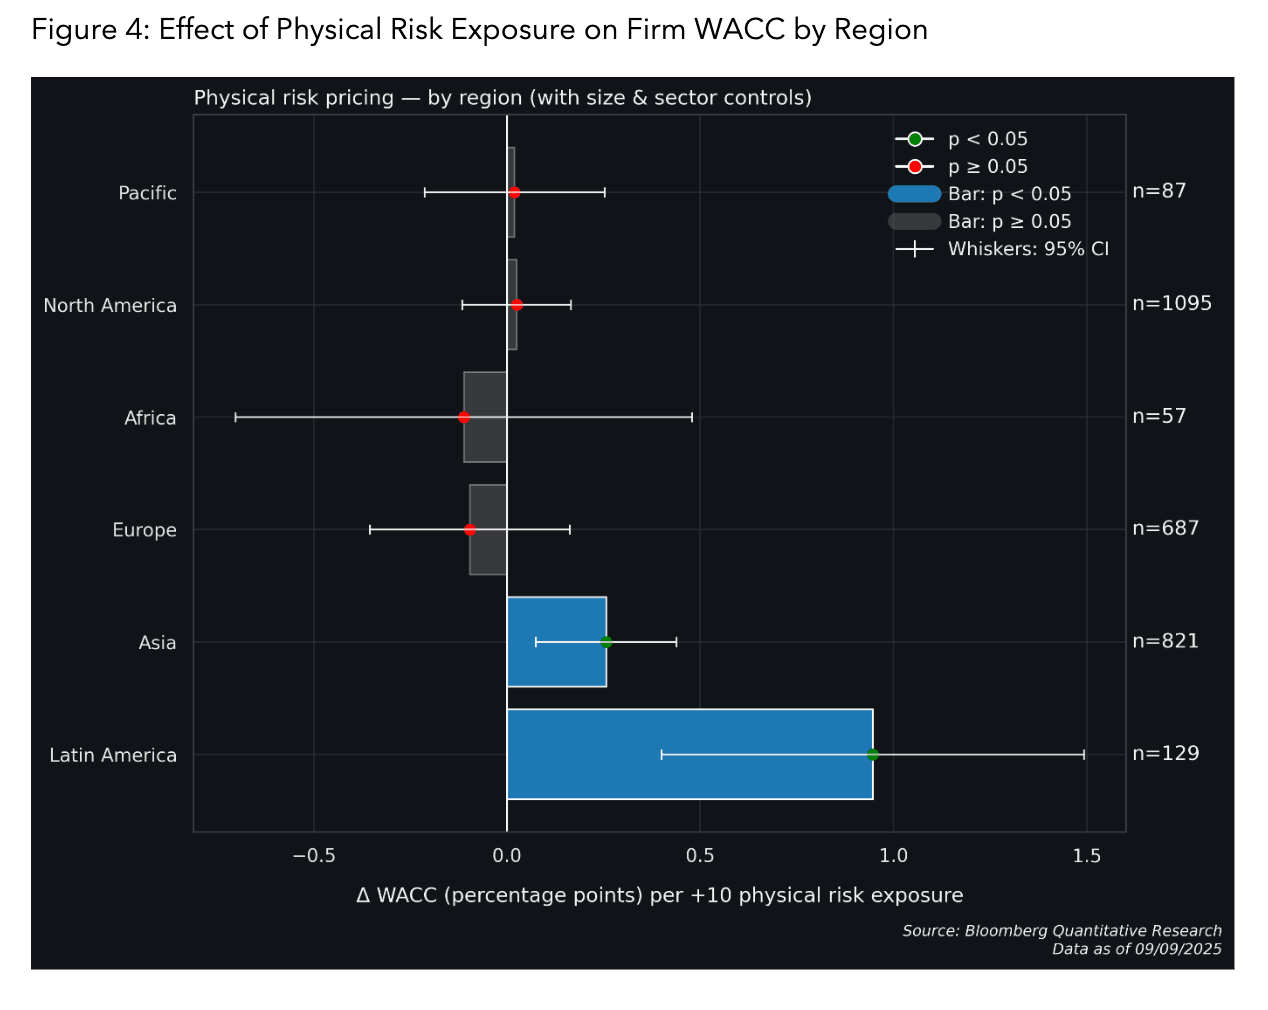
Regionally, the results suggest that higher physical risk (+10) is associated with higher WACC in the predominantly emerging market regions of Latin America (+94bps) and Asia (+25bps), while controlling for sectoral differences (see Figure 4 below).

What physical climate risk premiums mean for investors
Capital markets appear to be pricing physical climate risk exposure into the cost of capital for firms. Overall firms with higher physical risk exposure (+10) face a +22bps premium in WACC, even after controlling for sector, region and size. The effect is not visible in the raw data or country aggregates, yet it appears markets are pricing this in subtly across the global cross section of firms. Furthermore, the effect is heterogeneous thus far, with the premium found to be more strongly evident and pronounced in infrastructure-heavy sectors (Materials, Utilities), as well as some emerging-market regions (Latin America, Asia). This aligns with theoretical expectations, with the evidence pointing to investors penalizing sectors and geographies generally perceived to be more highly exposed to physical disruptions.
Future research should aim to further test the explanatory power of physical risk exposure for financing costs alongside additional macro-economic controls and credit ratings, as well as determining whether markets are pricing exposure to certain climate hazards more strongly than others.
A broader takeaway for investors is that a financial premium is potentially already being attached to physical risk exposure. Investors should look to fully integrate physical risk factors into valuations, discounted cash flow models, asset allocations and wider investment processes to maintain risk-adjusted returns as markets increasingly wake up to the realities of climate change. Corporates on the other hand should note that by demonstrating resilience to physical risk – through disclosure of climate risk assessments and clear adaptation plans – they may be able to lower their financing costs moving forward.
To learn more about Bloomberg’s Sustainable finance solutions: click here
The sample universe for the analysis is the Bloomberg ESG Score Total Coverage Index (BESGCOV), covering approximately 17k companies across global markets. After accounting for data availability, the global cross sectional OLS regression model with size, sector and region controls is estimated on a sample of about 2.9k companies.
Weighted Average Cost of Capital {WACC) is calculated as [KD*(TD/V)] + [KP*(PN)] + [KE*(E/V)]
Where:
KD = Cost of Debt, TD= Total Debt, V = Total Capital, KP= Cost of Preferred, P = Preferred Equity, KE= Cost of Equity, E = Equity Capital
Physical Climate Risk indicators by Riskthinking.AI and Bloomberg are available to Terminal users at ESG CLMR .
Nothing in the Services shall constitute or be construed as an offering of financial instruments by Bloomberg, or as investment advice or recommendations by Bloomberg of an investment strategy or whether or not to “buy”, “sell” or “hold” an investment. Information available via the Services should not be considered as information sufficient upon which to base an investment decision. Bloomberg makes no claims or representations, or provides any assurances, about the sustainability characteristics, profile or data points of any underlying issuers, products or services, and users should make their own determination on such issues.
All rights reserved. © 2025 Bloomberg.