To be or not to be an SI, that is the question
By Gary Stone, Mark Croxon and Joe McHale.
Being a systematic internaliser (SI) comes with a lot of responsibilities. Firms are trying to assess the extent of the obligations: additional regulatory reporting, supplying their NCA with instrument reference data at the end of the day, capturing detailed time stamps in the execution process and calculating detailed best execution (RTS 27) reports.
It appears most firms that deal on their own account in equity and equity-like instruments are opting-in to be SIs before the declaration deadline of September 2018. Unsurprisingly, most market makers in non-equity and non-equity-like securities are not voluntarily opting-in for now. There is a lot of uncertainty around the potential implications of pre-trade quote transparency obligations on market making risk.
However, some bulge bracket firms are opting in early and have declared their SI status in bonds in December, perhaps because they viewit as a competitive advantage. Incidentally, we originally thought the buy side would require brokers to be SIs. Rather than having to keep track of the SI status of brokers that offer capital commitment services, the buy side would make it a requirement to be (remain) on their broker list for those types of orders/executions.
Firms won’t be able to determine their official status until late August or early September 2018, when ESMA releases the first set of official denominators. For those firms not opting in early, this creates a need for SI calculators perhaps from June 1, 2018.
However, market makers are now offering assisted trade reporting services for their clients. Assisted reporting may help market makers to bridge the trade reporting gap so they don’t have to become SIs in all instruments. Bloomberg is for example rolling out functionality so buy-side firms can trade report as part of their execution workflow via VCON, Bloomberg’s voice trade confirmation system and TSOX, Bloomberg’s Fixed Income and Derivatives Execution Management System.
1. How market makers can pay attention to their SI status “state”
Under the assumption that market makers will only become SIs when they are obligated to, traders and desk heads may have to ask themselves the following questions in the first quarter of 2018:
- “In which instruments am I close to becoming an SI?”, and in those situations,
- “Will this trade make me an SI (when I don’t want to become one)?” on an inquiry-by-inquiry, order-by-order basis.
At the end of the quarter, firms will then need to determine:
- “In which instruments do I have to register as an SI?”
2. How do you calculate SI status?
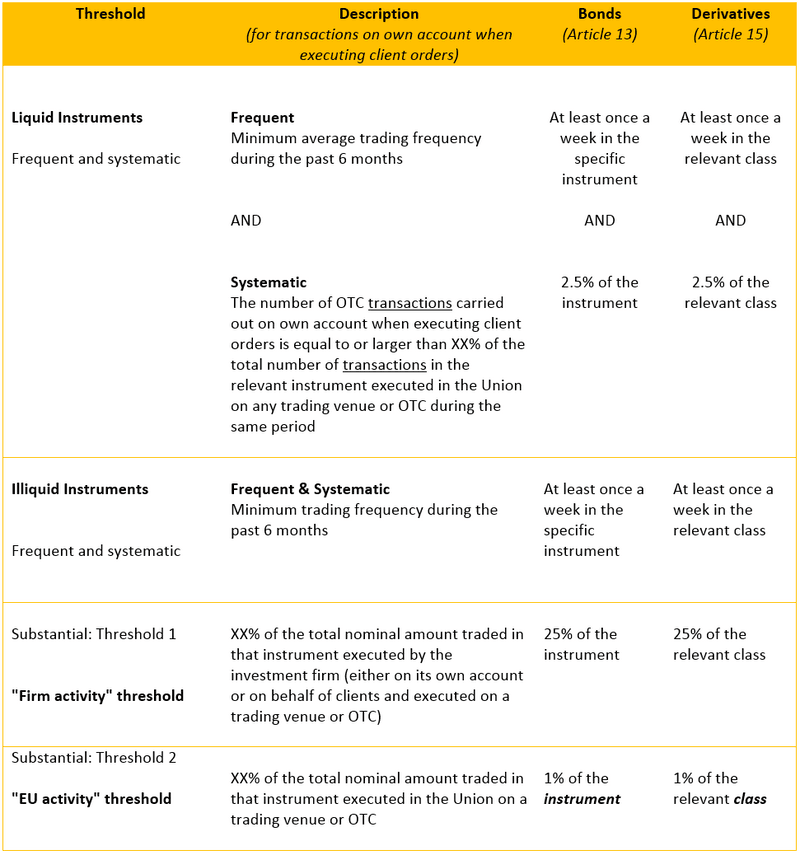
There are three quantitative thresholds to determine if a firm is an SI in a specific instrument, based on the firm’s activity when dealing on its own account in the execution of client orders. Bloomberg is offering an SI calculator as part of its Regulatory Reporting HUB (RHUB) solution, to help firms manage their data and determine their status. The functionality is accessible to firms that use Bloomberg for MiFID II transaction (ARM) reporting. This is the source of the firm’s numerator for the SI calculations. One threshold defines “frequent and systematic” and two thresholds are used to define “substantial” (Figure 1) for example, bonds and derivatives.
3. What are the SI data inputs for the quarterly reports?
Firms will need to verify their status at the end of each quarter to determine for what instruments they need to register as SIs for the current quarter. Bloomberg’s SI calculator can assist firms in identifying where they have crossed the SI thresholds, however, it does not create an official SI notification report.
Firms looking to leverage the Bloomberg SI calculator need to submit ARM reports with a field to denote “client order.” Threshold numerators come from these ARM reports. The end of quarter denominator comes from ESMA and the official EU activity statistics that will be published in the Financial Instrument Reference Data System (FIRDS).
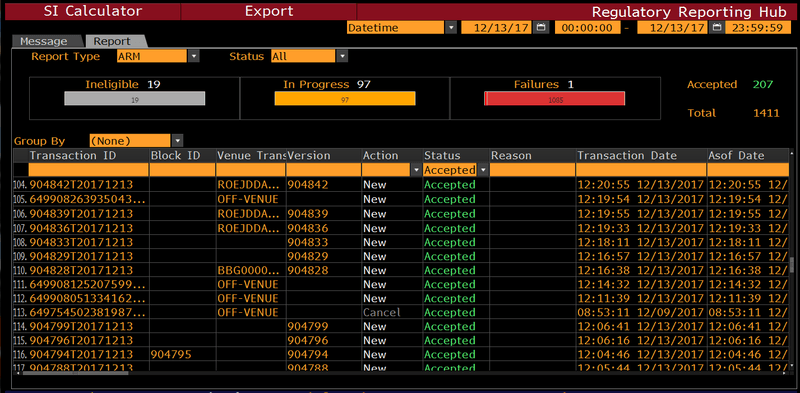
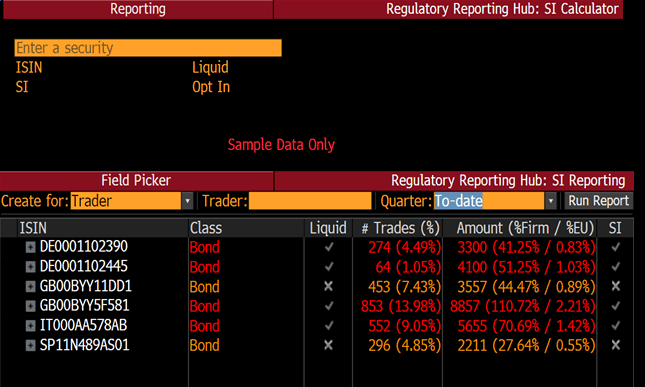
Using Bloomberg’s RHUB, the reporting tab in the SI calculator (Figure 2) produces a spreadsheet-type list (Figure 3). The report can be created for a specific trader, department, firm or ISIN.
4. “Will this trade make me SI?”
The report can be generated using the “Quarter: To-date” reference (Figure 3). This allows users to check at the start of the trading day for which instruments they may be close to, or have crossed, the threshold, and may have to be an SI for the following quarter.
For firms that are actively managing their SI status, traders may wish to verify the effect of an order (inquiry) on their SI status. The denominator for these intra-quarter “what if” calculations is sourced from Bloomberg data. Bloomberg is planning on aggregating data from APAs and trading venues to create an estimated count of the number of trades and EU volume. For instruments that have an ISIN, it looks like the data will be somewhat straightforward to aggregate.
The denominator aggregated by Bloomberg will naturally be conservative for two reasons: (1) Bloomberg may not have all of the sources to aggregate into the denominator and (2), trades that have post-trade deferrals will arrive after the trader’s calculation. This inherently conservative bias works in the trader’s benefit by underestimating the denominator.
The SI Calculator uses the aggregated data to estimate where the end-of-quarter ESMA official number of trades and EU volume could end up. These estimates are combined with the firm’s current numerator information to calculate the expected activity vs threshold.
In the SI calculator, “Show Details” on the security (e.g. TEST_ISIN_14) provides an understanding of where the firm currently stands. Traders can use either the prior quarter ESMA data or base calculations off Bloomberg’s projected denominator (Figure 4).
Green percentages indicate that the firm has not crossed the threshold while red percentages show that a breach has occurred, and that SI registration may be required at the end of the quarter. The colors are consistent with the information of “SI Trends”, where “yes” means that the firm was SI in the last quarter and is on track to be an SI in the next quarter (Figure 4).
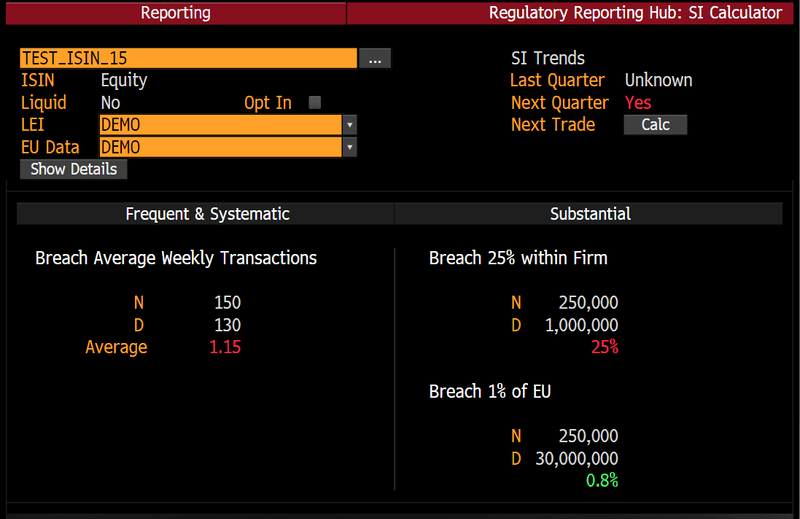
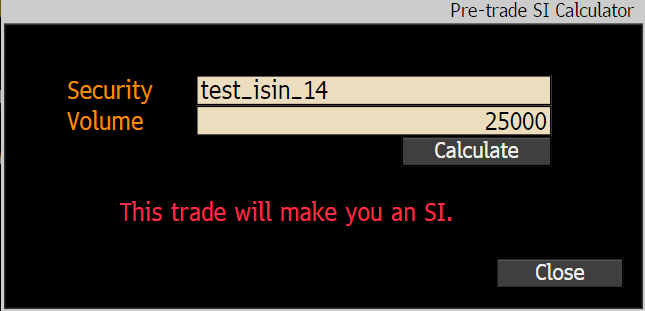
If the firm is not an SI, clicking on “CALC” under SI trends enables the trader to input the order (inquiry) size to determine the potential impact of the trade (Figure 5).