Functions for the Market
- Despite Trump’s public campaign against Powell, it is weak economic data, not political attacks, that’s driving market expectations for rate cuts, with Treasury yields experiencing their sharpest decline in over a year.
- The 10-year Treasury yield experienced its largest drop in more than a year following July’s jobs report, signaling an increased likelihood of a rate cut similar to the one one following the July 2024 jobs report.
- Despite above-target inflation, markets signal that price pressures no longer justify restrictive monetary policy amid deteriorating employment conditions.
Background
Following months of criticism over Federal Reserve Chair Jerome Powell’s decision to hold interest rates steady, President Donald Trump announced he may name the next Fed Chair “a little bit early.” Trump has been publicly pressuring Powell to lower rates, calling for his resignation and discussing firing him, but also recently said he would wait for his term to end in May 2026.
Trump recently nominated Stephen Miran, chair of the White House’s Council of Economic Advisers, to fill a seat on the Fed’s Board of Governors that ends in January. Miran is to replace exiting Fed governor Adriana Kugler, who announced her early resignation in August 2025.
PRODUCT MENTIONS
Fed chairs typically leave the central bank at the end of their term. Powell, who Trump nominated for Chair in 2017, has declined to say whether he’ll depart in May. If he chooses, he can stay on as a governor until 2028. That would limit Trump’s options to replace Powell as he would have to either put his intended chair into the seat Miran will hold until January, and promote them to Chair in May, or select someone already on the Board of Governors.
Two vice chairs, Michelle Bowman and Philip Jefferson, and Dallas Fed President Lorie Logan are reportedly under consideration to serve as chair of the central bank when the position opens next year. In July, when the Fed’s rate-setting panel opted to hold interest rates steady for the fifth consecutive time, Bowman and Fed Governor Christopher Waller dissented in favor of a quarter-percentage-point cut. Waller is also said to be shortlisted for the Chair role.
The issue
Treasury investors are betting surprisingly weak job and inflation data will force the Fed to cut rates where President Donald Trump’s attacks on Powell failed.
The 10-year Treasuries yield experienced its largest drop in more than a year following July’s jobs report. Only 73,000 jobs were created in July, below the consensus of 104,000, and the prior two months were revised down by 260,000, marking the worst three-month period for jobs growth since the pandemic. Trump subsequently fired chief labor statistician Erika McEntarfer and in a social media post, said reports “were RIGGED in order to make the Republicans, and ME, look bad.”
In August 2024, yields also fell after a payrolls miss (114,000 for July from the 175,000 consensus) and a 29,000 downward revision for June and May. The Fed cut rates by 50 basis points the following month. A cut at the next Federal Open Market Committee meeting, scheduled for September 16-17, would mirror the Fed’s action last September when it started the easing cycle after job creation misses and revisions spurred a bond rally.
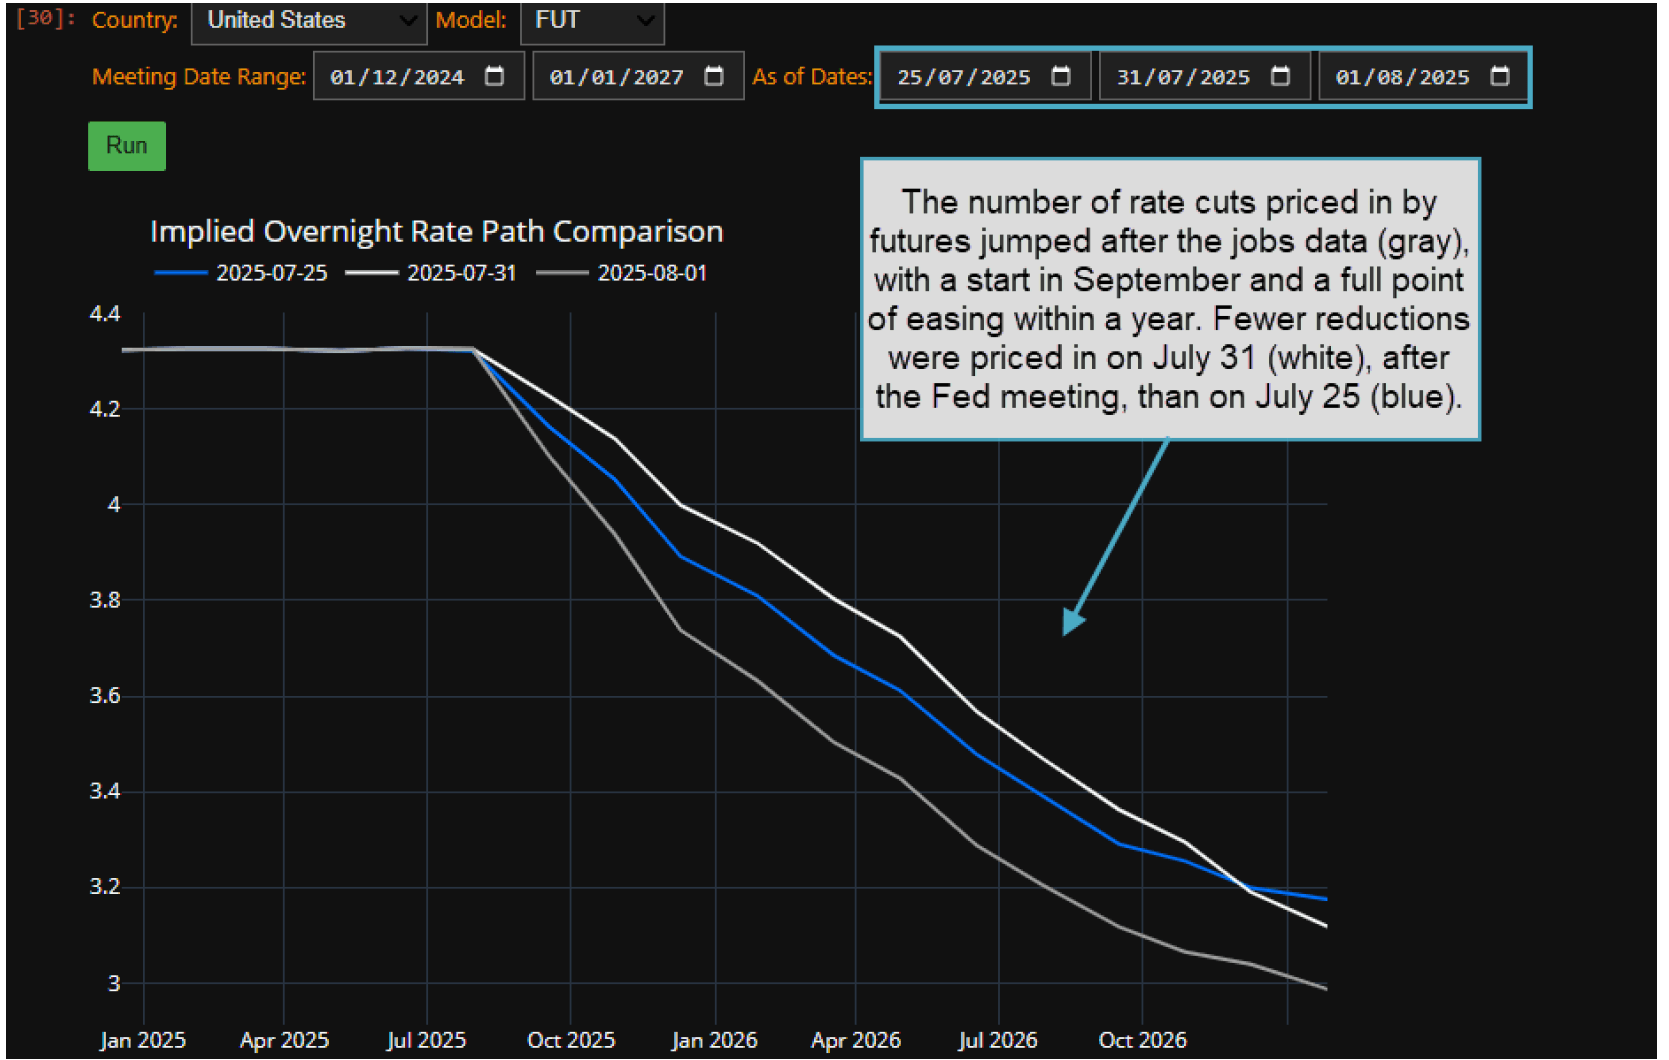
The number of rate cuts priced in by futures jumped after the jobs data, with a start in September and a full percentage point of easing within a year. While inflation remains higher than the Fed would like, investors are now indicating they don’t believe it’s high enough to hold off a rate cut for much longer.
Tracking
Track moves in the futures-implied Fed rate path with the BQNT function. To track rate cuts priced in by futures:

- Type “bquant help” and select BQNT HELP – BQUANT: Guides and Documentation.
- Select the Examples tab on top of the page, then click the box next to Macro on the left.
- Click Implied Overnight Rate Curve Evolution and then the yellow Add to My Projects. BQuant is an interactive computing workspace for exploring datasets and building quantitative models that launches in a web browser.
- Run BQNT and double click Sample Notebook: Implied Overnight Rate Evolution in your library.
- Click the Run tab at the top and Run All Cells.
- Scroll to the bottom and set As of Dates to July 25 2025, July 31 2025 and Aug. 1 2025.
- Click the green Run tab above the chart.
For more information on this or other functionality, click here to request a demo with a Bloomberg sales representative. Existing clients can press <HELP HELP> on their Bloomberg keyboard.