This analysis is by Bloomberg Intelligence Rates Strategist Ira F. Jersey and Associate Analyst Angelo Manolatos. It appeared first on the Bloomberg Terminal.
Ten-year treasury move on curve could extend
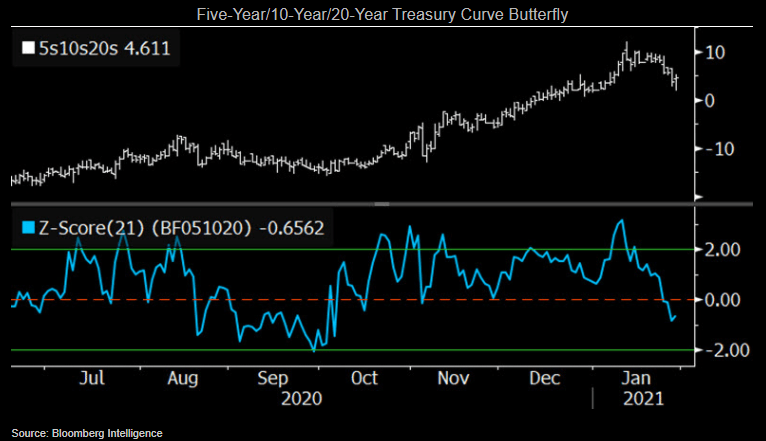
It’s possible the market is poised to find a new, tight, 20-bp range just above the old resistance of 0.98% on the 10-year Treasury yield. If so, finding opportunities along the curve near term could help generate alpha. The 10-year underperformed along the curve in 4Q, and though its rallied back, it could move further on a relative basis. Given our tactical yield scorecard suggests a modest bearish sentiment on the market and a curve-steepening bias, such a move may come from higher yields in the wings of the curve butterfly rather than a rally in the belly.
In the past, we’ve noted that when the 21-session Z-score was two standard deviations from the mean, the butterfly tended to retrace, and the past month wasn’t different. With this indicator near neutral, this wouldn’t be an impediment to further moves.
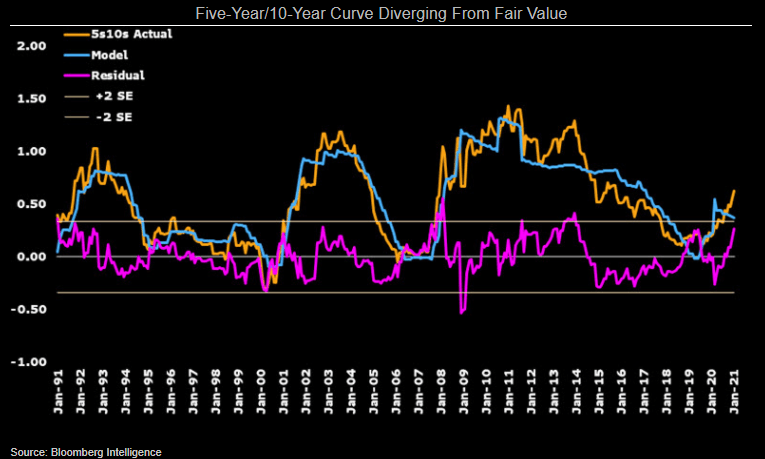
Model shows five-year/10-year curve too steep
Our fundamental yield model highlights that the five-year/10-year Treasury curve has steepened near levels where it tends to reverse. Typically, when the residual of our model gets to 25 bps, the market reverts toward the model’s fair value. There have been several instances where the model caught up to a market that moved prior to the model inputs being realized (2008 is the most notable example). We suspect in this period it will be possible to see modest bear-flattening tactically within the broader and longer-term bear steepening theme for 2021.
Methodology: Each curve model is a simple ordinary least squares regression with the independent variables of the midpoint of the Fed’s policy-rate band, our long-term debt demand proxy, the percentage of foreign ownership of the Treasury market and a dummy variable for quantitative easing.
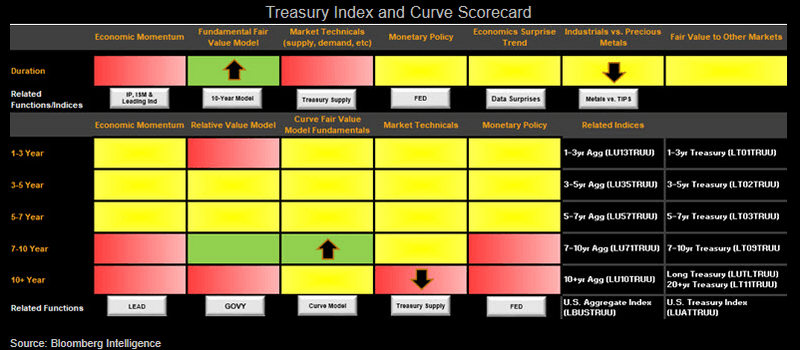
Scorecard points to modest bear-steepening
Our Treasury market and curve scorecard is pointing toward short-duration exposure and bear-steepening of the yield curve. There were few changes to the direction of our indicators this month, especially compared with the many differences in early January. One of the changes was our fundamental yield model now suggesting yields are above fair value, while yields have fallen back in-line with our metals performance indicator. Yet market technicals and economic momentum still favor a modestly negative view of the market.
For the curve, a 50-year bond being discussed by the Treasury Department could weigh on the long end. The reiterated stance that the Federal Reserve will allow inflation to run hot for a period of time also suggests further steepening. However, our curve model suggests the 10-year is cheap along the curve.
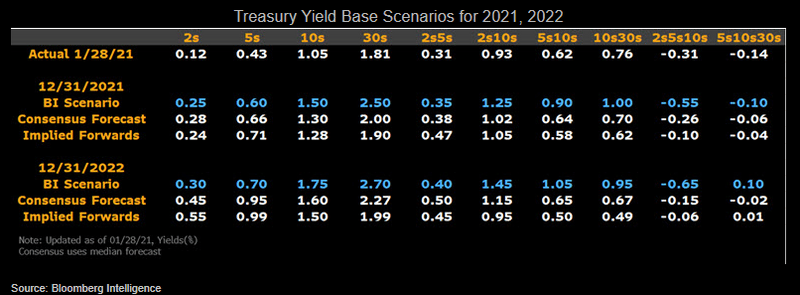
Yield scenarios point to bear-steepening
Our base scenarios for Treasury yields point to bear-steepening in 2021, yet we don’t expect the market to move toward those levels in a linear fashion. There’ll be volatility around the numbers. In fact, we suspect that much of the move could happen in 2H as the overall economic environment improves. While additional increases of inflation breakevens are possible, we question whether this reflects actual expectations, given real yields remain extremely negative — in part due to purchases by the Federal Reserve.
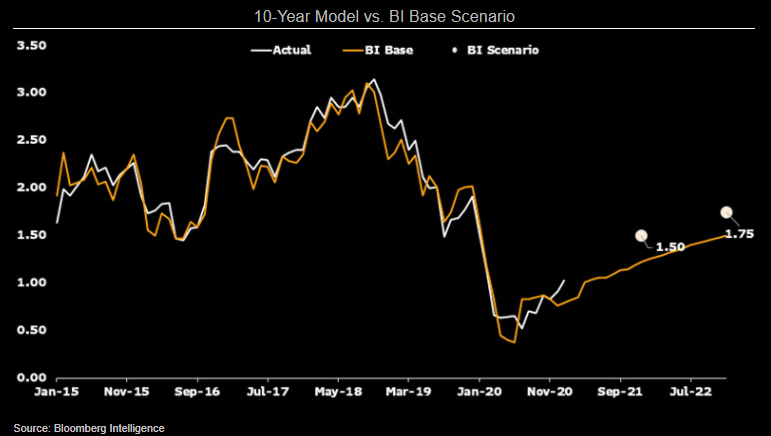
These base scenarios suggest that yields could be higher and the curve steeper than consensus forecasts and the implied forwards are currently suggesting. Implied forwards see the 10-year yield at 1.28% at year-end and finishing 2022 at 1.50%. Consensus is only modestly more bearish.
10-year cheap to model fair value
The 10-year yield is trading about 20 bps above the BI rates 10-year Treasury model-implied fair value. The model, which uses consensus growth and inflation expectations, sees the 10-year yield rising to 123 bps by year-end. Earlier this month, the 10-year yield touched 1.19%; therefore, the model doesn’t predict yields breaking much above this year’s range in 2021. Looking ahead to 2022, the model sees the yield climbing to 151 bps. Our base scenario is a bit more bearish than the model.
The model uses ordinary least squares regression with monthly data inputs. The five variables included are GDP growth, year-over-year CPI, Federal Reserve assets as a share of GDP, the fed funds target rate and the one-year/three-year curve for Fed bias. We adjust the intercept lower by 38 bps for the post-crisis structural break.