
Bloomberg Intelligence
This analysis is by Bloomberg Intelligence Senior Commodity Analyst Mike McGlone. It appeared first on the Bloomberg Terminal.
A key theme of 2025 might be that reversion can be a powerful force. Broad commodity and US Treasury bond indexes are showing bottoming patterns from multidecade lows vs. the US stock market, which could portend what matters. The inordinate burden on rising US equity prices to lift all boats may have reached an apex with $100,000 Bitcoin.
That gold ETF holdings are rapidly recovering, after four years of outflows, might not be coincidence on the back of the highly speculative crypto marking the biggest ETF launch ever in 2024. Gold appears on track to keep outperforming most risk assets and commodities, but is stretched at almost $3,000 an ounce. Copper’s February 14 $4.84-a-pound high is atop our peak inklings radar, along with ceilings in corn of around $5 a bushel and $4 per million British thermal units in natural gas.
Reversion risks are down
Feint or enduring rally? Tilts toward $60 crude, $4 copper, corn
February may have set a 2025 ceiling for broad commodities. US tariffs could pressure copper to $4 a pound. Crude oil is increasingly comfortable below $70 a barrel. Corn is struggling to stay above $5 a bushel and US natural gas at $4 per million British thermal units often fuels reversion to $2. A bottoming Bloomberg Commodity Spot Index vs. the S&P 500 might suggest what matters.
Commodities, T-bonds gaining upper hand vs. stocks?
There’s little doubt that broad commodities are relatively cheap vs. the US stock market, but so are Treasury bonds, which may augur what matters. Our graphic shows the Bloomberg Commodity Spot Index (BCOM) potentially bottoming from about a 25-year low vs. the S&P 500 and similar inklings for the Bloomberg US Treasury 20+ Total Return Index. The almost $12 trillion 2024 spike in US stock-market wealth (the most ever), along with Bitcoin’s spurt to $100,000, could have marked as-good-as-it-gets for risk assets, with deflationary implications.
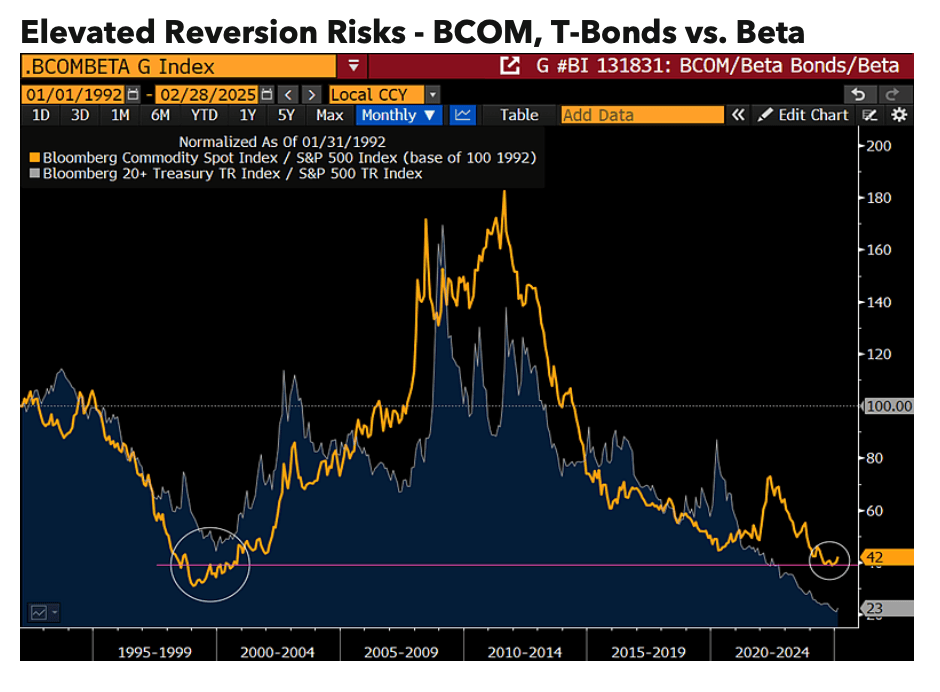
The Treasury bond index at the lowest in our database since 1992 vs. the S&P 500 might suggest an upper hand vs. broad commodities, especially if WTI crude oil stays below $70 a barrel. It typically takes a catalyst for reversion; US tariffs and cost cutting might be sparks.
$60-$80 crude vs. $4-$5 copper, corn, treasury bonds
WTI crude oil’s 2025 high to Feb. 27 at about $80 a barrel might be leaning toward $60, with implications for most commodities and interest rates. That lower energy prices and Treasury bond yields are stated goals of the Trump administration could solidify ceilings, along with headwinds from excess US crude, gas and liquid-fuel supply. It might not be coincidence that the US Treasury long bond’s January 5% high roughly coincided with $80 crude. Our graphic of the per-pound price of copper, bushels of corn and 30-year yield on the same scale shows good resistance at around $5 to 5%, and implications if oil drops toward $60.
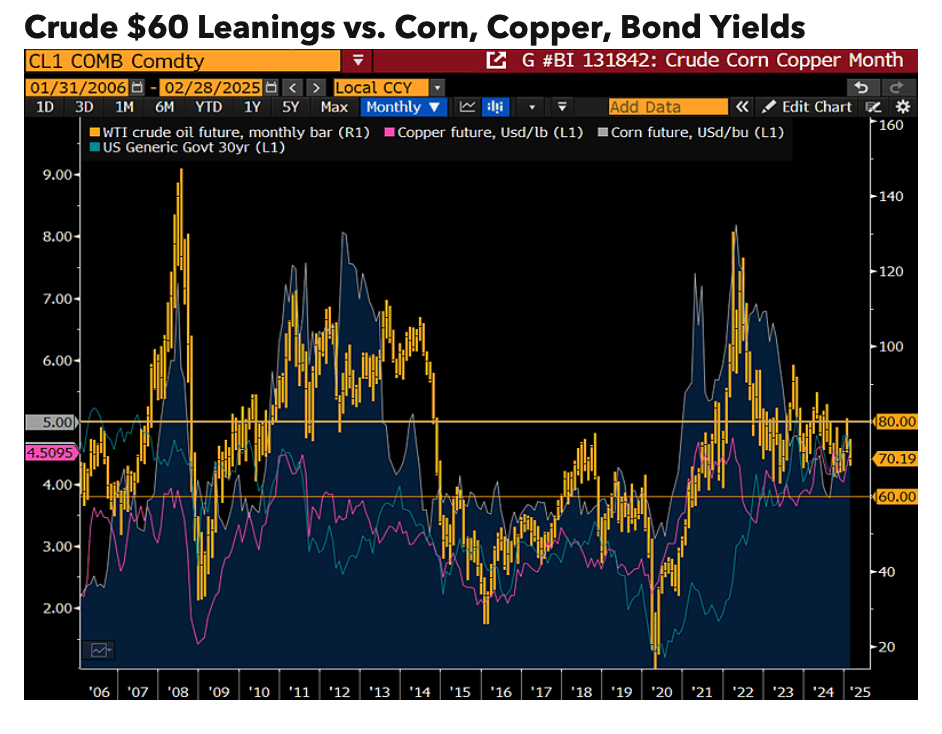
Crude at about $70 appears on track to visit its US breakeven cost around $57. Unless WTI can put distance above $70, we see corn, copper, and Treasury bonds likely to lean to $4 to 4% rather than above $5 to 5%.
Commodity risks appear down with copper, bond yields
The new year and significant shift in US leadership and policy have launched gold and copper to the top of 2025 performers, pressuring crude oil and Bitcoin. It’s a question of trend duration and we put the industrial metal in a least-likely category of continuing to rally in the face of US tariffs. Strength needs to be proved above Feb. 14’s $4.84-a-pound high is how we see copper versus its typical autocorrelation tendency toward $4. Rising US excess crude oil, liquid fuel and natural gas supply are notable preexisting trends favoring Trump administration goals of lower energy prices and Treasury bond yields.
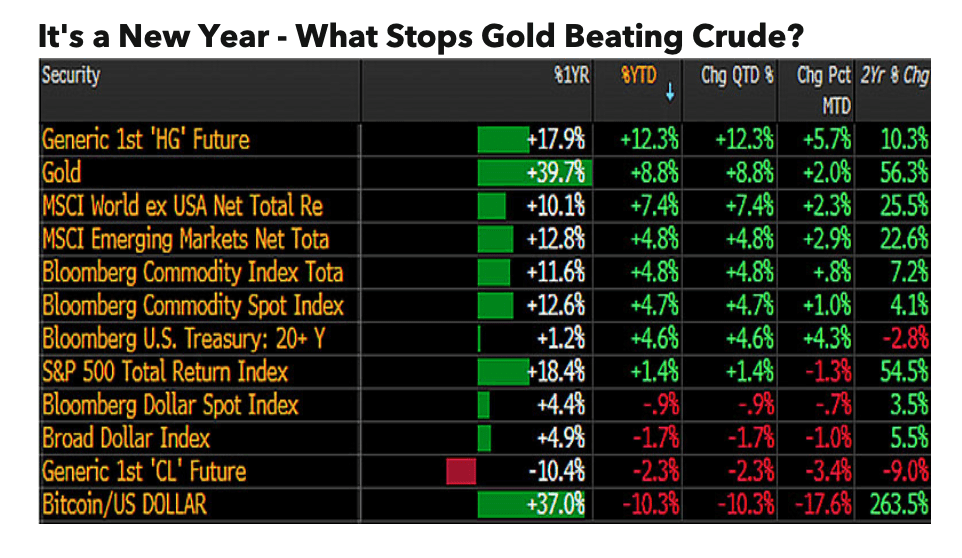
The highest level of gold in our database since 1992 vs. US Treasury bonds could suggest a top beneficiary of some reversion, especially if the US stock market declines. Bitcoin might be the primary leading indicator.
Gold set to take the 2025 medal?
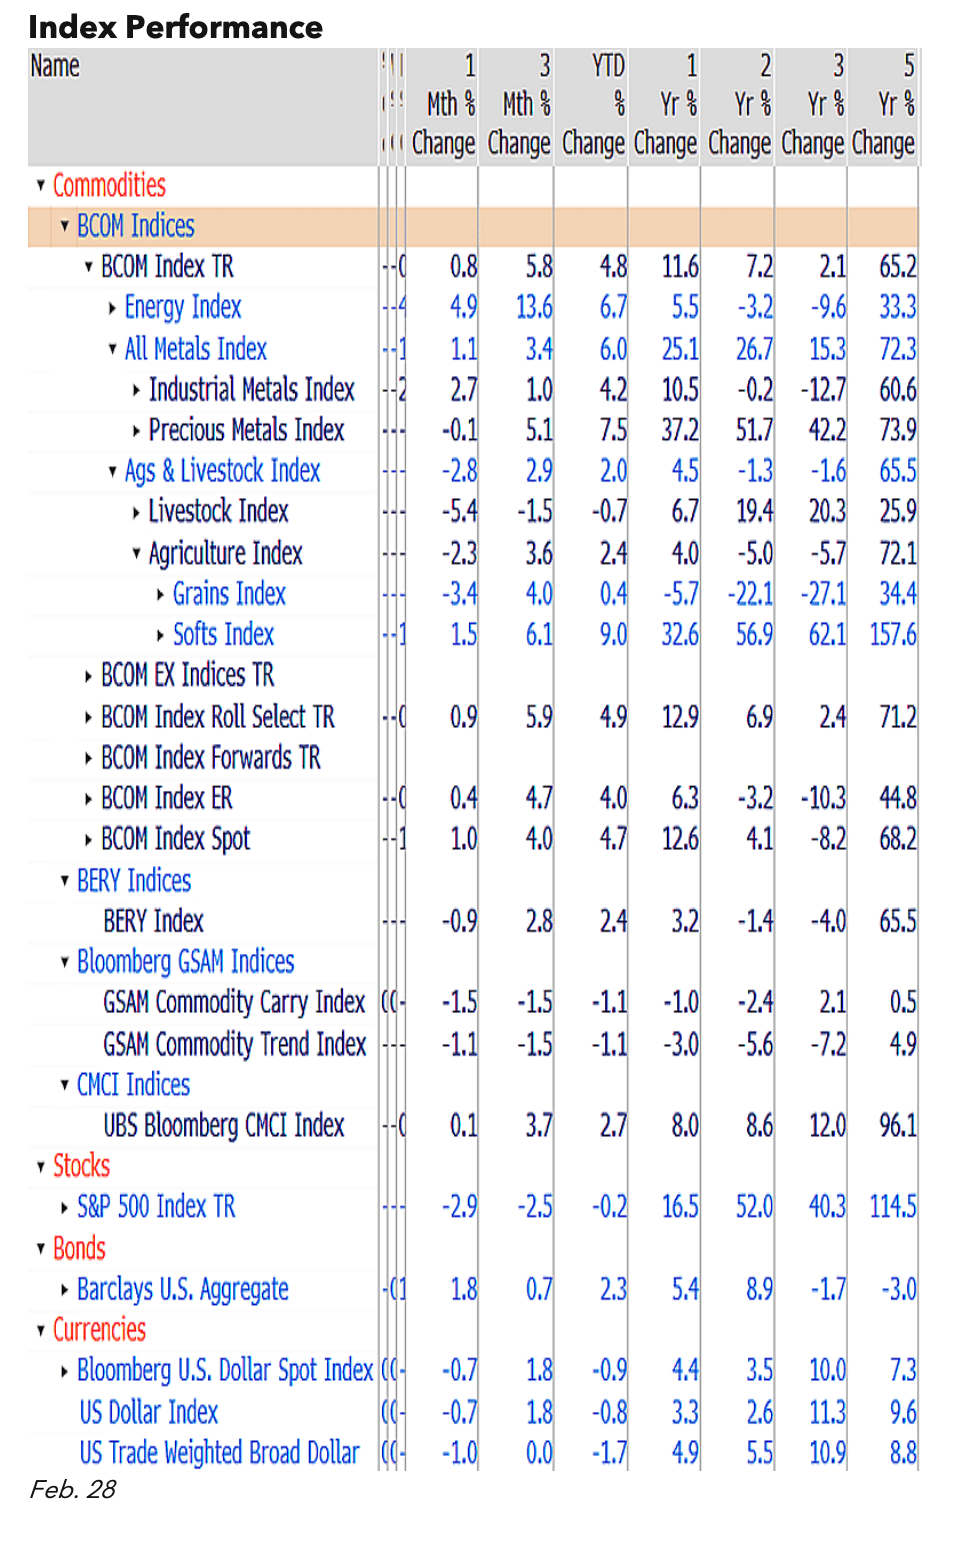
Led by gold, the least-elastic precious metals atop our annual sector-performance dashboard vs. the most supply-to-price sensitive grains on the bottom could be trends with legs in 2025. Headwinds for energy and agriculture resonate from the price spikes to the 2022 highs. Low-price cures can take years and crude- and liquid-fuel supply excesses in the US, Canada and OPEC vs. waning demand from China tilt our bias toward $60 a barrel WTI crude oil more likely than above $80. Similar in US natural gas, reverting to $2 per million British thermal units has been normal after reaching $4.
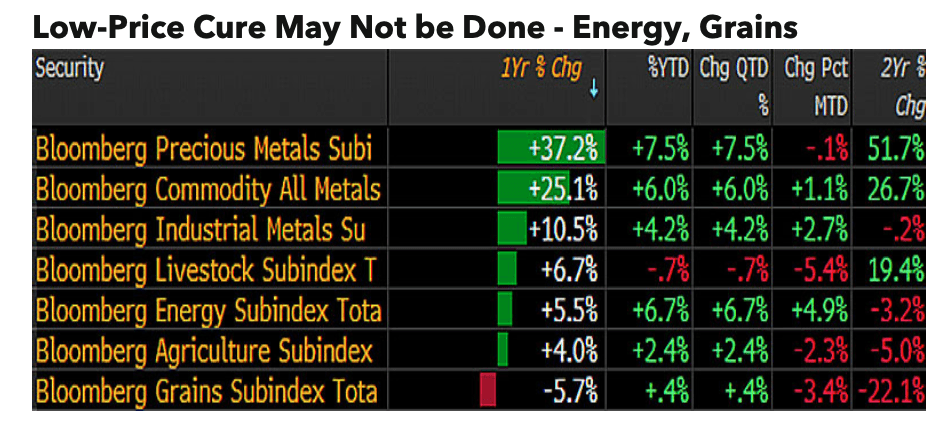
A massive supply of soybeans from Brazil, about twice the US exports, represents a top agriculture headwind. Absent a poor Corn Belt growing season, we see $9 a bushel beans and $4 corn as more likely than above $11 and $5.
Terminal subscribers can access full version of this report via BI <GO>.
The data included in these materials are for illustrative purposes only. The BLOOMBERG TERMINAL service and Bloomberg data products (the “Services”) are owned and distributed by Bloomberg Finance L.P. (“BFLP”) except (i) in Argentina, Australia and certain jurisdictions in the Pacific Islands, Bermuda, China, India, Japan, Korea and New Zealand, where Bloomberg L.P. and its subsidiaries (“BLP”) distribute these products, and (ii) in Singapore and the jurisdictions serviced by Bloomberg’s Singapore office, where a subsidiary of BFLP distributes these products. BLP provides BFLP and its subsidiaries with global marketing and operational support and service. Certain features, functions, products and services are available only to sophisticated investors and only where permitted. BFLP, BLP and their affiliates do not guarantee the accuracy of prices or other information in the Services. Nothing in the Services shall constitute or be construed as an offering of financial instruments by BFLP, BLP or their affiliates, or as investment advice or recommendations by BFLP, BLP or their affiliates of an investment strategy or whether or not to “buy”, “sell” or “hold” an investment. Information available via the Services should not be considered as information sufficient upon which to base an investment decision. The following are trademarks and service marks of BFLP, a Delaware limited partnership, or its subsidiaries: BLOOMBERG, BLOOMBERG ANYWHERE, BLOOMBERG MARKETS, BLOOMBERG NEWS, BLOOMBERG PROFESSIONAL, BLOOMBERG TERMINAL and BLOOMBERG.COM. Absence of any trademark or service mark from this list does not waive Bloomberg’s intellectual property rights in that name, mark or logo. All rights reserved. © 2025 Bloomberg.