This article provides a summary of key concepts from our latest whitepaper, “Pricing Power Everywhere”, written by Steve Hou, PhD, Quantitative Researcher at Bloomberg.
“The single most important decision in evaluating a business is pricing power. If you’ve got the power to raise prices without losing business to a competitor, you’ve got a very good business. And if you have to have a prayer session before raising the price by 10 percent, then you’ve got a terrible business.” – Warren Buffett
With inflation rising to the highest levels in four decades the concept of pricing power has once again become top of mind for investors. Pricing power or a company’s ability to raise prices and maintain profit margins amidst increasing costs or competition is one of the most important dimensions for evaluating the value of a business. Yet, a simple and robust measure for pricing power remains elusive.

Pricing power is profit margin stability
In this article, we propose such a simple and robust measure for capturing corporate pricing power. We define pricing power as the inverse of the standard deviations of trailing 5-year 12-month gross margins.

Pricing power factor offers strong performance in the US
We have found that companies as identified by our measure of pricing power have significantly and consistently outperformed the broader market over the past 15 years with lower volatility and smaller maximum drawdowns.

The Bloomberg Pricing Power Index (BPPUS Index), which selects 50 US Large and Mid-Capitalization stocks with the greatest pricing power, has consistently outperformed the underlying benchmark in both up and down years, by rising more in up-years and not falling as far during down-years.

Since September 2020 the US has seen inflation surge to 40-year high. In response the Federal Reserve raised the Fed Funds Rate at the fastest pace on record from 0.25% to 5.5% causing one of the sharpest selloffs in both stocks and bonds in recent history. Figure 3 shows that the Bloomberg Pricing Power index performed resiliently during this period: not only held up better than the benchmark in 2022, also rebounded more sharply.

Pricing power offers strong performance across global markets
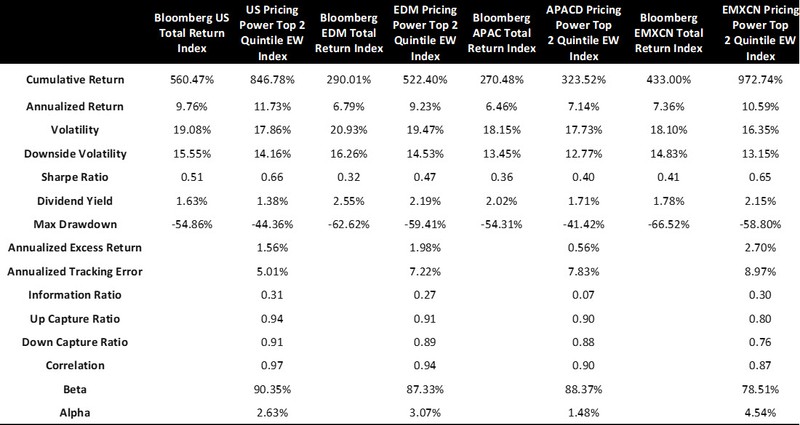
If the pricing power factor only performed well in the US from 2007 to 2023, it may have been a fluke and hence less persuasive. We expand our analysis by constructing pricing power indices in four different global markets from 2003 to 2023, spanning twenty years.
Pricing power indices have significantly and consistently outperformed their respective benchmark indices with similar risk and return characteristics. Remarkably in Europe and Emerging Markets, pricing power indices have realized US level average annual returns and go against the narrative that the Rest of the World has uniformly underperformed the US over the past decade.
Pricing power stocks are higher quality, higher growth, and low beta
So why has the pricing power index outperformed despite being such a widely known concept? To understand the sources of the pricing power index outperformance, we analyze the pricing power index through the lens of factor analysis using Bloomberg’s state-of-the-art MAC3 factor risk model.
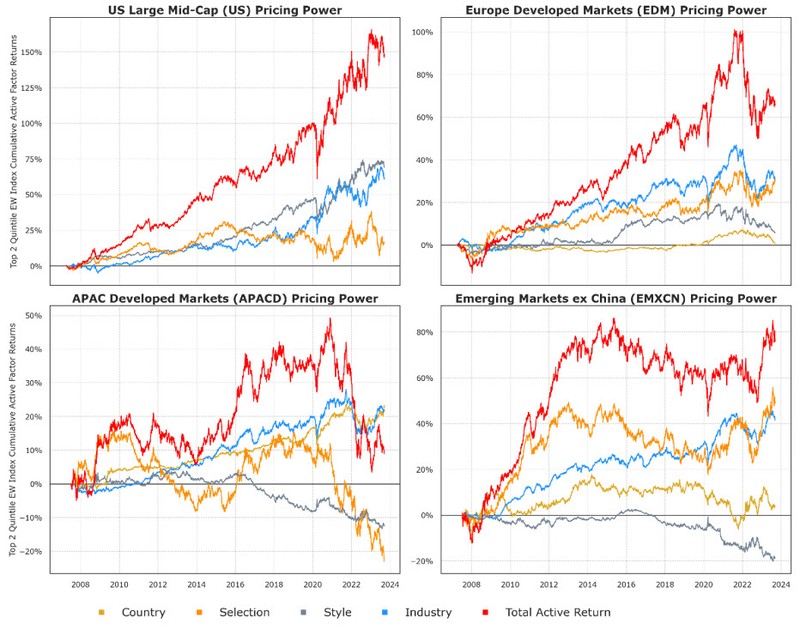
We find that pricing power index has very consistent factor characteristics. We can see in Figure 5 that in each geography, pricing power has accumulated very significant excess returns from industry active exposures (relative to benchmark), in the US and Europe meaningful returns from style factor exposures and finally in each case a significant and persistent amount of non-factor or selection effect returns.
Of course, the realized returns of style and industry factors during any historical period, even as long as 20 years, can be somewhat fickle. It is more useful to examine the types of exposures or characteristics pricing power companies tend to have.
In terms of style factors, pricing power companies consistently tend to have higher quality (profitable and low financial leverage), lower market beta, modestly faster growth, and interestingly lower value (in other words relatively more expensive in terms of valuation).
This is an interesting combination of style factor exposures. The risk created by the relatively higher valuation in a valuation compression environment is compensated by the lower market beta exposure, as evidenced in the 2022 stock market sell-off (Fig. 3). On the other hand, the low market beta is offset by the modestly higher growth.
In terms of industry factors, pricing power companies tend to come from industrials, consumer staples and consumer discretionary sectors. It should be unsurprising that we find many companies with pricing power in these sectors as they tend to be suppliers of hard to substitute input to firms and consumers. These customers tend to accommodate the cost increases for these suppliers’ products while cutting down on expenditures in other categories.
Pricing power companies are “quiet quality compounders”
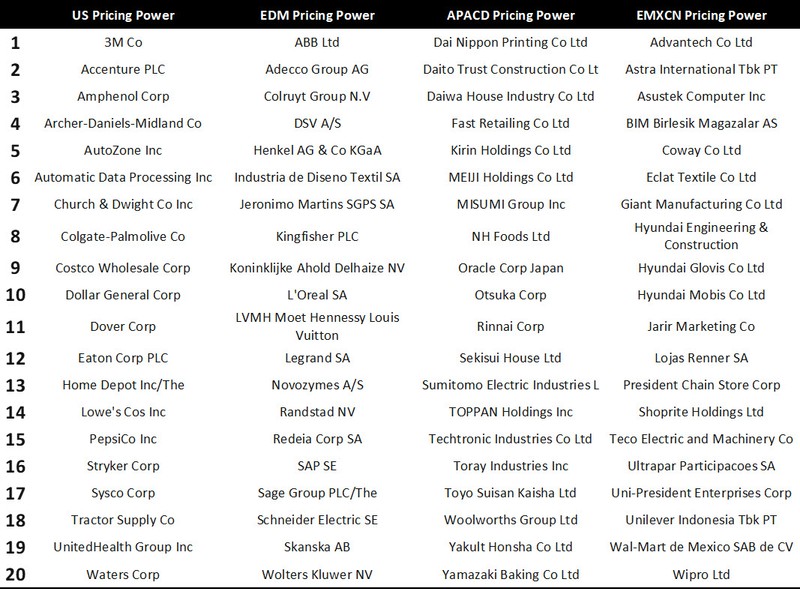
From our factor analysis, one could already surmise that pricing power companies, as identified by our metric, are not the most glamorous and headline-occupying companies, but instead tend to be “quiet quality compounders”. They tend to be niche suppliers that have strong and steady earnings, cash flows and very stable profit margins as they can pass on costs increases.
If we take a quick look at the companies that most frequently appeared in our price power indices across each selection date over the years, we see that this is indeed the case with only some subtle regional variations. In the US, we notice that pricing power companies tend to come from consumer staples or specialized industrial suppliers. Good examples include Costco, Pepsi, Eaton or Autozone. In Europe, we see similar patterns, but we also see luxury companies such as LVMH or L’Oréal, which are Europe’s “quality growth companies”.
In this article, we introduce a simple new way to capture “pricing power” as a concept systematically and show that pricing power has provided a strong and consistent source of equity returns over the long run across multiple geographical markets across the globe. With the global economy clearly poised to enter a new macroeconomic era with higher inflation in contrast with the last decade, we believe that pricing power provides investors a uniquely suitable type of equity exposure and potential source of alpha.
- Invesco Ltd has launched the Invesco Pricing Power ETF based on the BPPUS Index under the ticker POWA.
Visit I<GO> on the Terminal or browse our website to find out more about Bloomberg’s indices and request a consultation with an index specialist.
The data and other information included in this publication is for illustrative purposes only, available “as is”, non-binding and constitutes the provision of factual information, rather than financial product advice. BLOOMBERG and BLOOMBERG INDICES (the “Indices”) are trademarks or service marks of Bloomberg Finance L.P. (“BFLP”). BFLP and its affiliates, including BISL, the administrator of the Indices, or their licensors own all proprietary rights in the Indices. Bloomberg L.P. (“BLP”) or one of its subsidiaries provides BFLP, BISL and its subsidiaries with global marketing and operational support and service.