ARTICLE
Behind the benchmark: Dissecting active bond fund performance

Pensions & Investments
This article was written by Vikas Jain, Index Quant Research and Yingjin Gan, Head of Index Research at Bloomberg.
Over the past few decades, index-linked (passive funds) have experienced substantial growth, particularly in equities, where research consistently shows that most active managers fail to outperform their benchmarks after accounting for fees.
As of 2024, passive funds represented 62% of U.S. equities AUM and 44% of fixed income AUM—up from 40% and 24% in 2014, respectively. Unlike equities, where passive funds have been displacing active ones, both active and passive bond strategies continue to attract flows. Notably, actively managed bond ETFs made up 36% of fixed income ETF inflows in 2024, more than double their share from the previous year.
This continued interest in active fixed income strategies reflects the view that bond markets —particularly credit— are less efficient, offering opportunities for skilled managers to add value. However, fixed income has received far less analytical scrutiny than equities, mainly due to limited data availability. Our new study, Behind the Benchmark, helps fill that gap by examining U.S. active fixed income fund performance across four key categories: Aggregate, Government, Investment Grade Corporate, and High Yield. We not only assess fund returns versus benchmarks but also evaluate the drivers behind performance—asking whether excess returns stem from true skill or are largely compensation for systematic risk.
At first glance, active bond funds seem to deliver
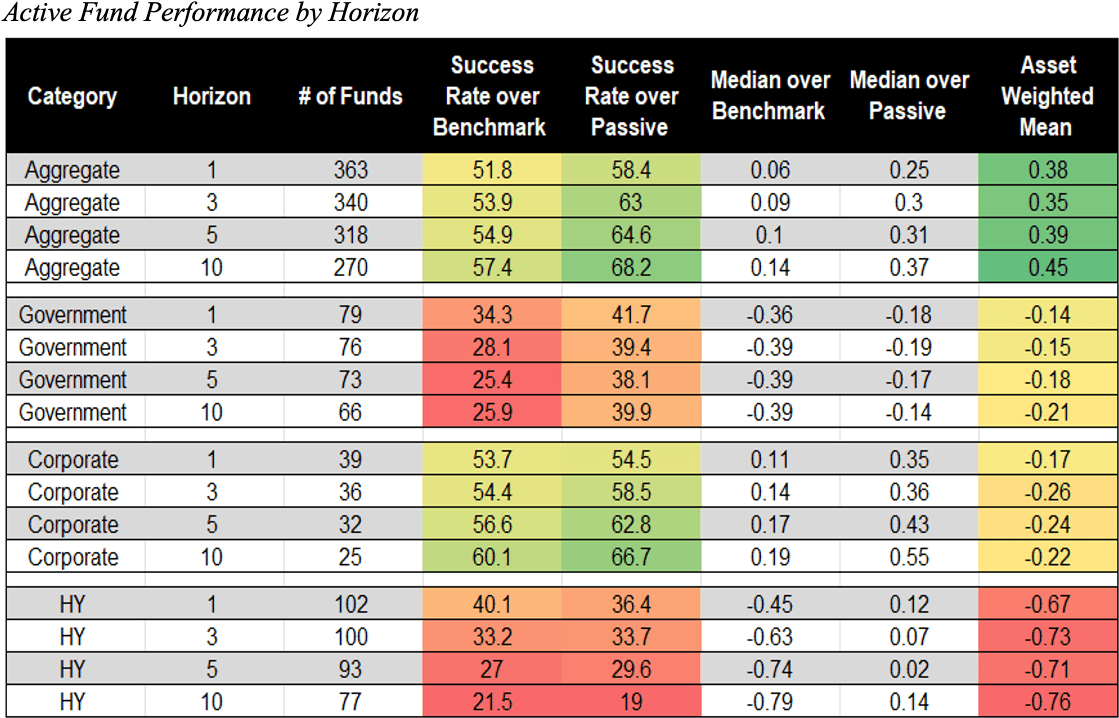
When measured against their stated benchmarks, many active bond funds—particularly in the Aggregate and Corporate segments—appear to outperform with positive median excess returns. However, performance in Government and High Yield categories are less encouraging: most funds underperform, with negative median excess returns and low success rates.
This divergence highlights the unique challenges within each sector. In the Government category, active strategies often rely on duration timing, which our data suggest is difficult to execute successfully and consistently. In High Yield, the dominant approach is fundamental security selection—similar in philosophy to active equity management. Yet, as with equities, our research suggests that this rarely produces durable alpha.

Digging deeper: alpha or systematic risk?
To better understand what’s behind active bond fund performance, we conducted both correlation analysis and multi-factor regressions. The findings were consistent:
- Nearly all active funds take on more credit risk than their benchmarks
- This higher credit exposure is structural and persistent over time
- Most outperformance is attributable to credit risk, after controlling for systematic risk, outperformance largely disappears
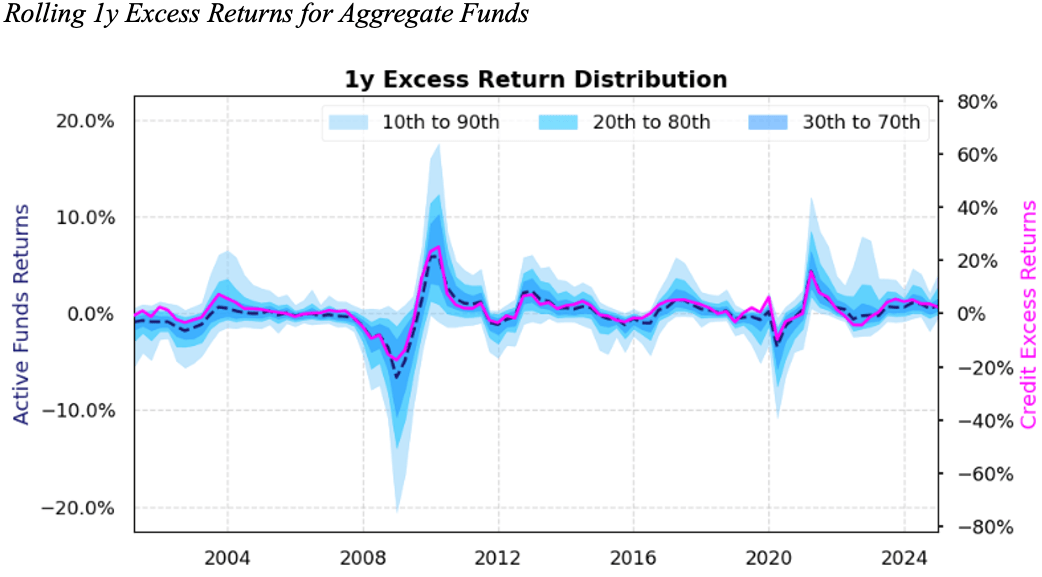
For example, rolling 1-year excess returns in Aggregate funds track closely with credit markets. This suggests that systematic credit exposure—not manager skill—is the primary driver of performance.

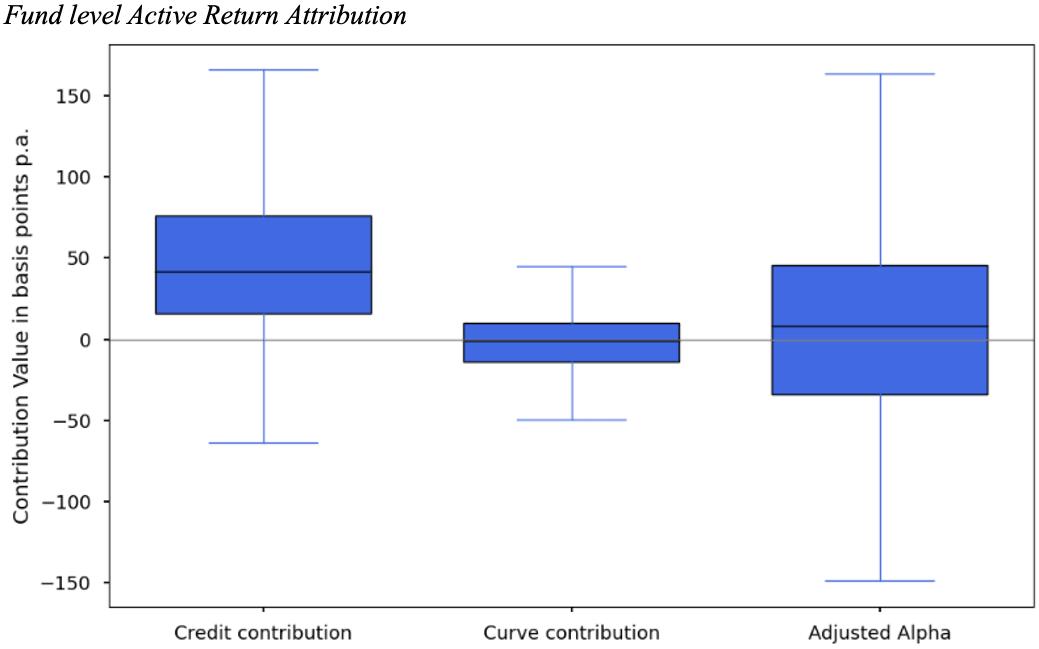
We quantify this this through regression analysis: regressing equal-weighted active returns on the yield curve and credit factor. For active Aggregate funds, we found an average annual excess return of 50 basis points. However, after adjusting for yield curve and credit factors, only 15 basis points remained as unexplained “alpha.” The rest was attributed almost entirely to credit exposure (47bps), with an R-squared of 88%.

Fund level regressions and attribution confirm the same pattern, both the mean and median fund’s outperformance can be mostly explained by the credit factor exposures. Finally, nearly 90% of active Aggregate funds show persistent positive credit exposure. This widespread, consistent tilt toward credit helps explain why conventional benchmarking tends to overstate true alpha.
The benchmark matters: aligning benchmarks with actual risk
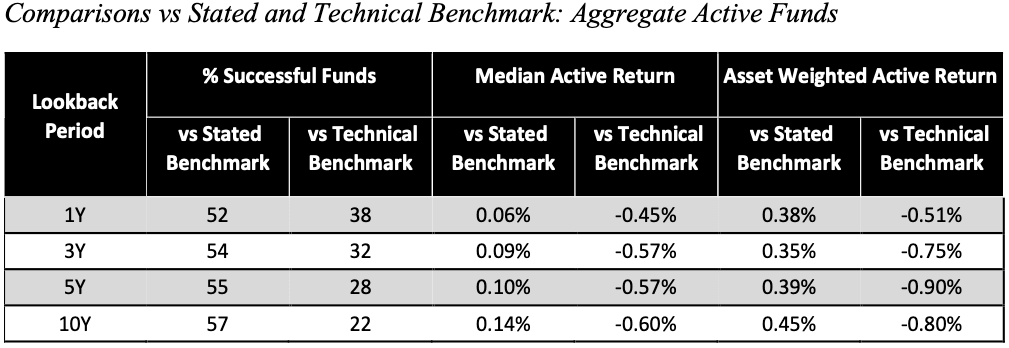
A major contributor to overstated alpha is benchmark misalignment. Many active funds are benchmarked to the Bloomberg U.S. Aggregate Index yet take on significantly more credit risk.
To address this, we introduced “technical benchmarks” tailored to each fund’s actual risk exposures. The results are revealing: success rates fell sharply, and median excess returns turn negative. In short, much of the outperformance disappears once credit exposure is properly accounted for. For example, we find that only 22% of Aggregate funds overperform their technical benchmark over the last 10 years.

Implications for investors and fiduciaries
Here are a few takeaways those evaluating active fixed income strategies:
- Most active performance is beta, not alpha.
Persistent exposure to credit risk—not dynamic skill—is the primary driver of excess returns.
- Benchmark mismatch can mislead.
Evaluating funds against risk-aligned technical benchmarks yields a more accurate picture of true value-add.
- Excess credit risk can undermine diversification.
Many active bond funds take on more credit risk than benchmarks suggest, making them behave more like pro-cyclical assets during market stress—potentially reducing their effectiveness as defensive allocations in multi-asset portfolios.
- Passive strategies can replicate active outcomes.
Systematic exposures in active funds can often be matched using lower-cost passive or credit-tilted approaches.
While some active fixed income managers may demonstrate genuine skill and deliver alpha, our findings suggest that such cases are the exception rather than the norm. Identifying these managers requires a disciplined approach—supported by rigorous attribution analysis and benchmarks that accurately reflect true risk exposures.
Behind the Benchmark brings transparency to a historically opaque segment of the investment landscape. By aligning benchmarks with actual exposures and isolating systematic drivers, we enable more informed decisions, clearer assessments of manager skill, and stronger alignment with portfolio objectives.
This article was written by Vikas Jain, Index Quant Research and Yingjin Gan, Head of Index Research at Bloomberg and is reproduced from Pensions & Investments.