Bloomberg Professional Services
Comprehensive structured tick history data might provide great value in terms of ideation, building and testing trading strategies. Let’s explore the indicative equilibrium price (IEP) during the pre-opening session (POS) as a trading signal and investigate its relationship with the price movement after the market open to test this hypothesis.
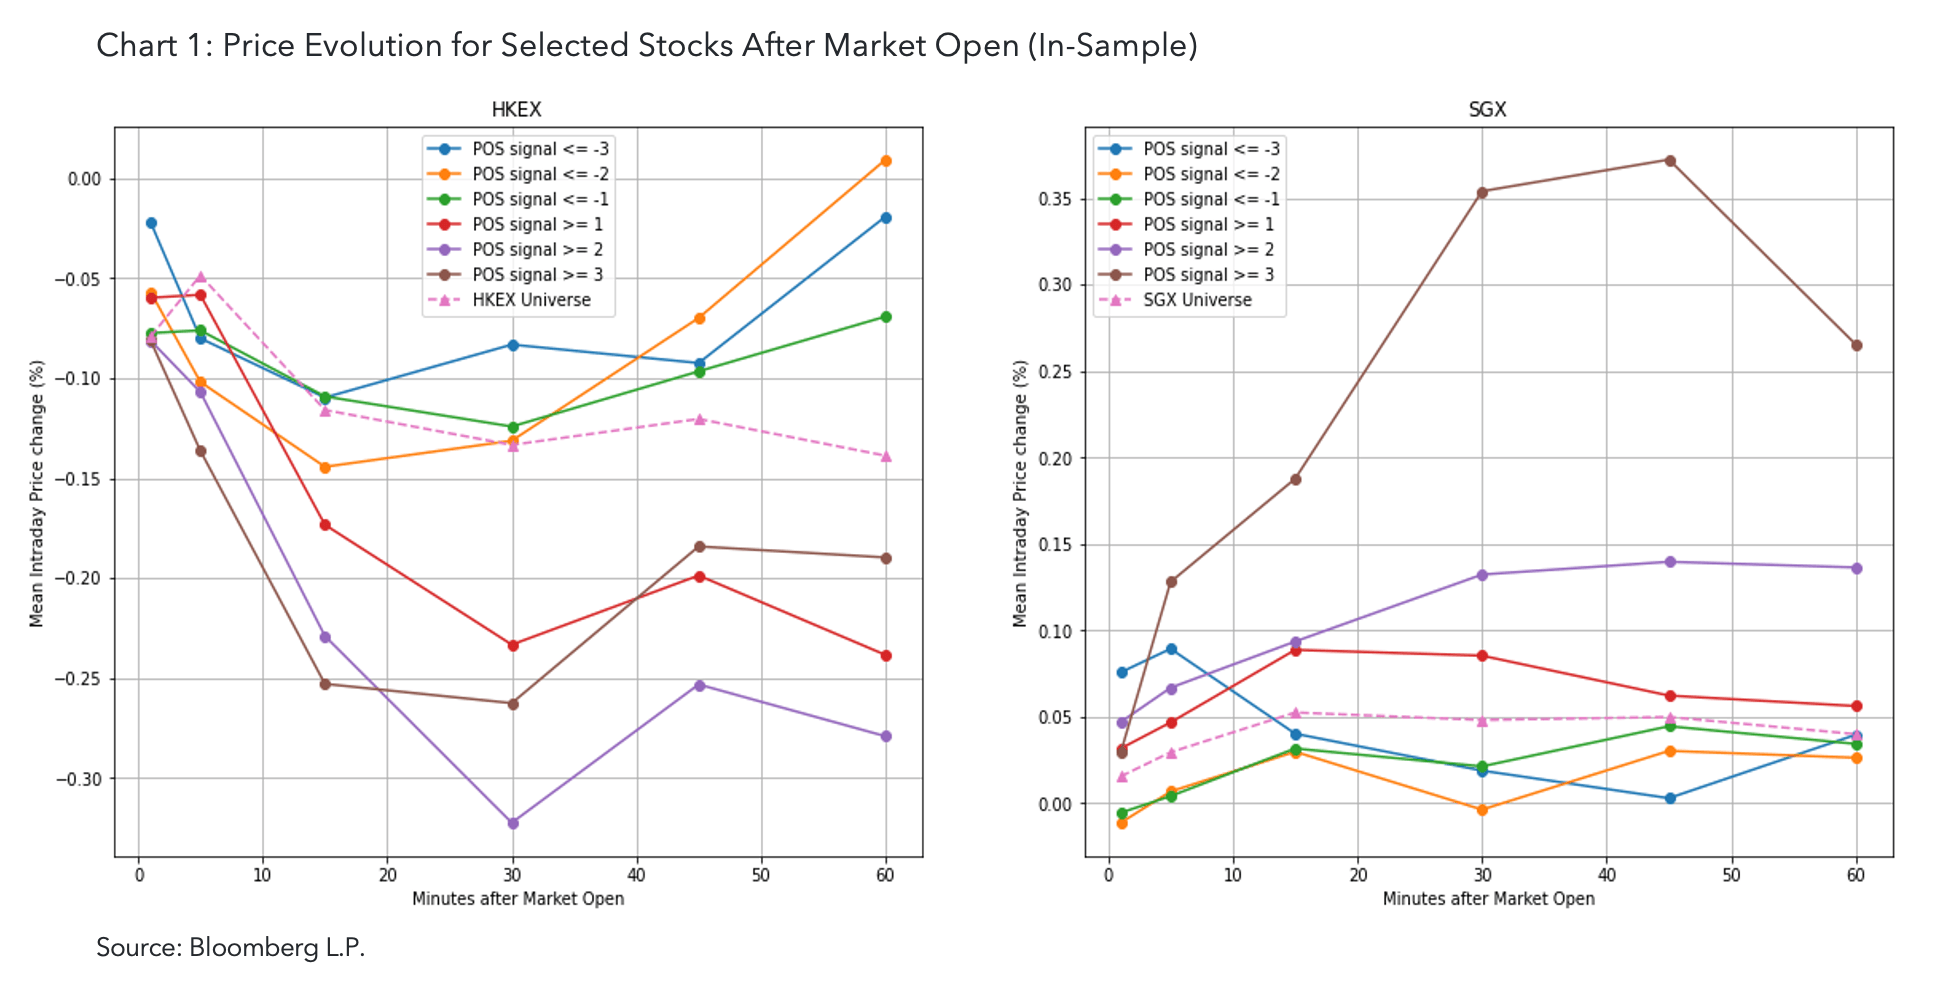
Using Bloomberg’s Tick History dataset, we found that the price change during the POS has a reversal effect on the following intraday price for the Hong Kong Stock Exchange (HKEX), while for the Singapore Stock Exchange (SGX), the impact is dominated by momentum.
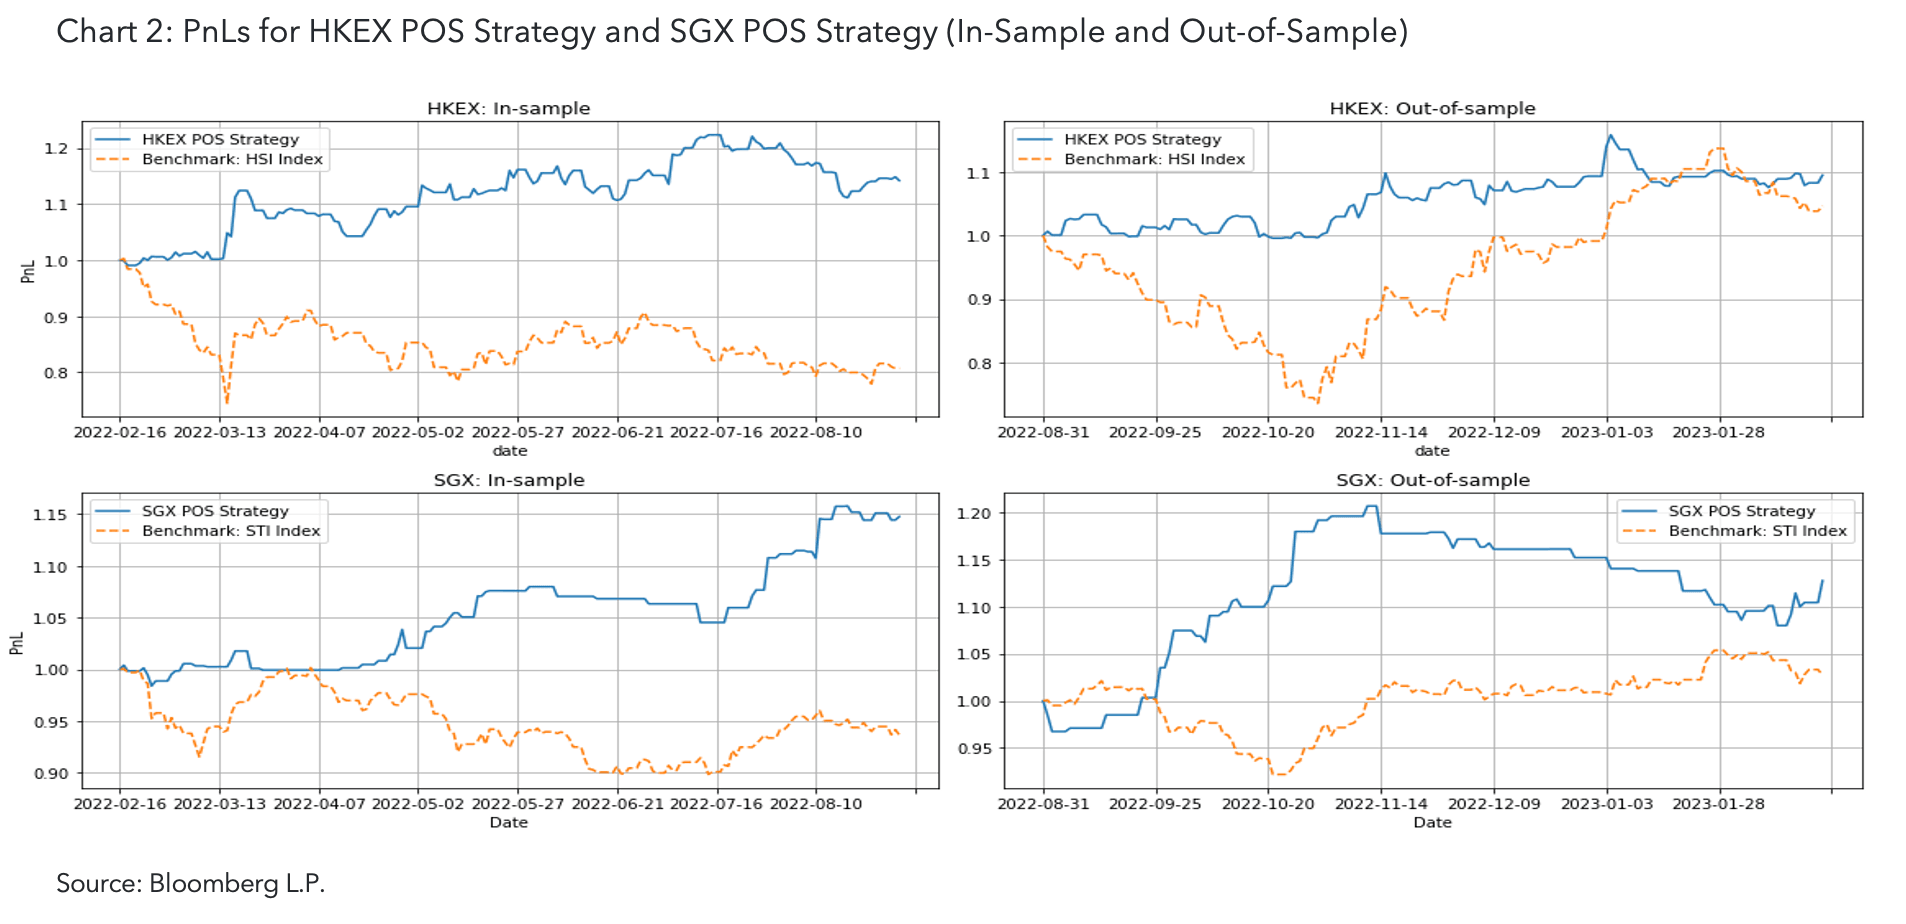
This suggests that different market mechanisms exist within these two exchanges. Based on these findings, we analyzed a long-short intraday trading strategy for each exchange. The backtest results showed consistent outperformance of the benchmark for the defined time period. For full results, download our whitepaper “Trading Strategies with Condition Codes in Tick History Data”.
Bloomberg Tick History dataset
Bloomberg’s Tick History datasets cover the tick history for a variety of asset classes, including equities, currencies, swaps, fixed income products and futures from over 600 global exchanges, with data starting as early as 2008. The tick history contains each individual bid, ask and/or trade published with the associated times and volume, as well as a code that denotes important attributes. These codes are applied by exchanges and are referred to as “condition codes”.
Bloomberg unifies condition codes across exchanges where possible and provides comprehensive up-to-date metadata. We are able to retrieve and investigate the pre-opening auction trade data in an efficient way with the condition codes.
Pre-opening auction signal
As the market approaches the opening, overnight information is being absorbed into asset prices, making the indicative opening prices converge towards a new equilibrium.
The price discovery speed in response to pre-opening information could be different across markets. If the market is not able to absorb the overnight information quickly, the intraday price should continue the trajectory of the POS price change within a certain period of time after the market opens.
However, if the market incorporates additional information efficiently, then by the time of or soon after the market opens, the price will reflect the change. As an example, if we observe a spike in the IEP during the POS, it is likely that a positive overnight event has been observed and asset valuation is starting to converge towards a higher equilibrium.
To statistically test the hypothesis, we used Bloomberg’s Tick History data for the Hong Kong Stock Exchange (HKEX) and the Singapore Stock Exchange (SGX). We normalized the percentage change in the IEP during the POS by its rolling 30-day average and rolling 30-day standard deviation as the POS signal. The data was split into an in-sample period (February 17, 2022 to August 31, 2022) and an out-of-sample period (September 1, 2022 to February 20, 2023).
During the in-sample period, the POS signal leads to price discrepancies after the market opens on average, although the mechanisms are different for HKEX and SGX. For HKEX, the POS signal had a reversal effect on the following intraday prices, whereas, the effect for SGX was dominated by the momentum.
Setting up trading strategy with tick history data
Based on the relationships between normalized POS signals and intraday price movements for both exchanges, we constructed different long-short intraday trading strategies. These were as follows: In the case of HKEX, where the reversal effect dominates, at the market open, we short stocks with POS signal values over a short threshold and go long stocks with POS signal values below a long threshold. In contrast, in order to catch the momentum in SGX, at the market open we go long stocks with POS signal values over a long threshold and short stocks with POS signal values below a short threshold. The positions will be closed after a certain time window.
The window size and the signal thresholds are chosen with the in-sample data for each exchange. We take the Hang Seng Index and the Straits Times Index as the benchmarks for HKEX and SGX, respectively. Notably, backtest results showed that the strategies based on the POS signal consistently outperformed the benchmarks in both in-sample and out-of-sample periods for both exchanges.
Want to learn more how condition codes and tick history can be used to develop long-short intraday trading strategies? Download the whitepaper.