Patterns in the snow: Trading on the weather
Weather patterns have long been of interest to those involved in the stock market, but with the obvious exception of commodities trading, trading signals and strategies based on traditional weather data have rarely generated noteworthy results. Previous studies have examined a range of impacts and scenarios, including: 1) the effects of sunlight and cloudiness in New York City on the stock market as a whole, 2) the effects of daylight savings time and seasons on stock returns, and 3) the relationship between weather and U.S. GDP in general, as well as weather’s effect on interactions within specific sectors of the economy. These studies have all contributed to the knowledge base around weather and financial markets, but they have not necessarily generated reliable or tradable insights.
However, the advent of alternative data sets has stimulated fresh analysis of the impacts weather may have on markets and market sectors such as retail. Alternative data could be used to trade on weather conditions — not only to seek excess returns, but also to manage risk in the sectors most likely to be affected by changes in environmental conditions.
In a new white paper, the Bloomberg quant research team has taken a deeper look at trading based on weather conditions. The research leveraged bespoke snowfall exposure indexes built using two data sets: one containing the GPS locations of all retail stores in the U.S. and the other being a historical database of snowfall measurements in the U.S. maintained by Weather Source. This information was then used to evaluate the effect of significant snowstorms on retail operations, taking regional norms for precipitation into account.
The research results suggest that the market may overestimate the snowfall effect on retailers. In fact, the team found a strong positive correlation between a retailer’s stock return after a storm and the level of the indicator calculated. This opens up the possibility of implementing a rules-based trading strategy focused on very large retailers in the period immediately after a snowfall indicator has exceeded a given threshold. The team applied machine learning in the analysis, taking a training set from data of 2010-2012. In the data set from 2013-2018, the strategy exhibited a conditional Sharpe ratio of 1.47.
Several features of the analysis deserve special attention. First, the dynamics of scale across retailers are important: a very large company might have 10,000 locations around the country, while a smaller firm might have just 200 locations. If there is significant snowfall at 100 locations for each of them, clearly the impact will be much stronger on the smaller firm.
Second, the geography of the U.S. varies substantially: some regions are able to accommodate light-to-moderate snowfall quite easily, while others will be challenged with even the smallest amounts of snow — consider the differences between Boston and Atlanta, for example. Therefore, preparedness and norms around snowfall must also be taken into account.
The research incorporates these observations into the trading strategy through a number of rules. First, the testing is restricted to the universe of publicly traded retailers that have a minimum of 500 locations and are also in the Russell 3000. On the weather side, the researchers accounted for the severity of the storm with a ranking system that reflects variations across the U.S.
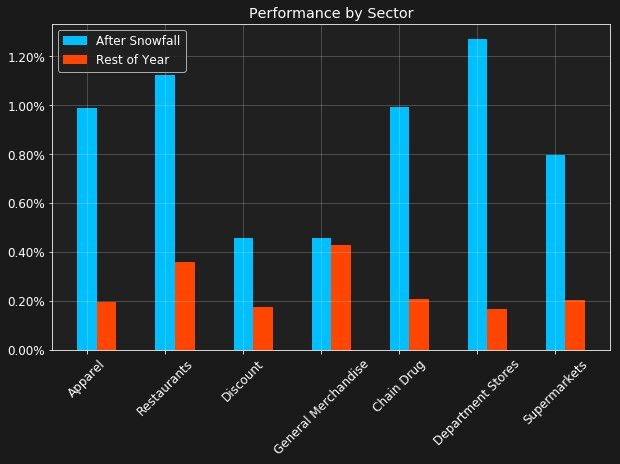
The proposed trading strategy consists of selecting names based on thresholds being exceeded, determining the size of the trades depending on how many other trades have been activated that day and then holding the positions for five trading days. Looking at the average weekly return of the strategy, the performance by sector is particularly striking for apparel, restaurants, chain drug stores and department stores, with supermarkets slightly less dramatic, and discount and general merchandise exhibiting much less of a difference compared with their performance during the rest of the year.
Read more in the full white paper, The Impact of Snowfall on Performance of US Retail Companies.