Bloomberg Professional Services
Welcome to Data Spotlight, our series showcasing insights derived from Bloomberg’s 8,000+ enterprise datasets available on data.bloomberg.com via Data License.
In this edition we dive into data that can help investors with merger arbitrage, inflation forecasting, and news-driven credit analysis.
Interested in previous editions of our Data Spotlight? You can find it here (focus on sustainable finance data) and here (focus on alternative data).
1. Merger arbitrage using machine learning
Merger arbitrage is an investment strategy that involves buying the stock of a company that is being acquired and simultaneously selling short the stock of the acquirer, with the goal of profiting from the spread of price. The goal of this strategy is to benefit from the target company’s stock undervaluation. However, it is necessary to hedge against potential deal risks: predicting the outcome of a deal (completed or canceled) is critical.
To that end, Bloomberg’s Equity Corporate Actions dataset can serve as a foundation to build investment research theses on. The dataset covers over 30 event types including dividends, spin-offs, mergers and acquisitions and comes with deep history going back to 2007. By using deal terms for an acquisition as features in a machine learning classification model, users can improve prediction outcomes of deals the moment they are announced. This model is enhanced further using a range of research specific Bloomberg datasets such as Company Financials Point-in-time, Revenue Segments, Supply Chain and News Headlines.
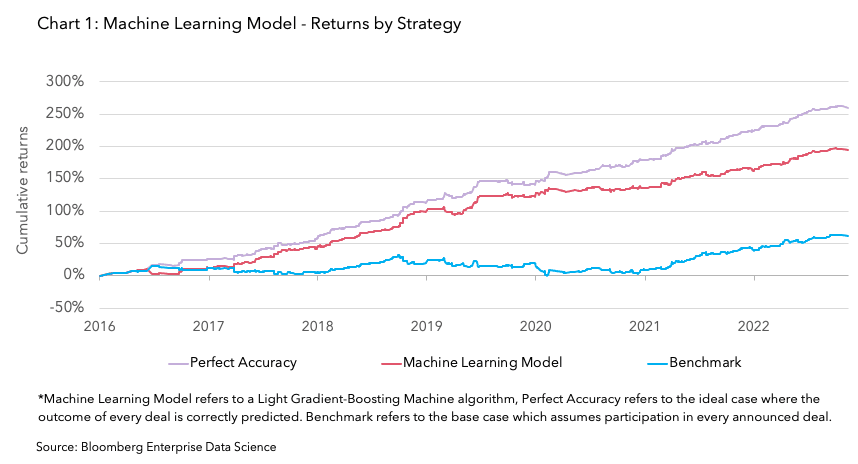
As chart 1 shows, the Machine Learning Model* deployed by us performed significantly better than the Benchmark*, with close to 200% cumulative returns over our assessment period. This is close to the Perfect Accuracy* scenario returns of 260%, assuming 10% of the portfolio is invested in a given deal.
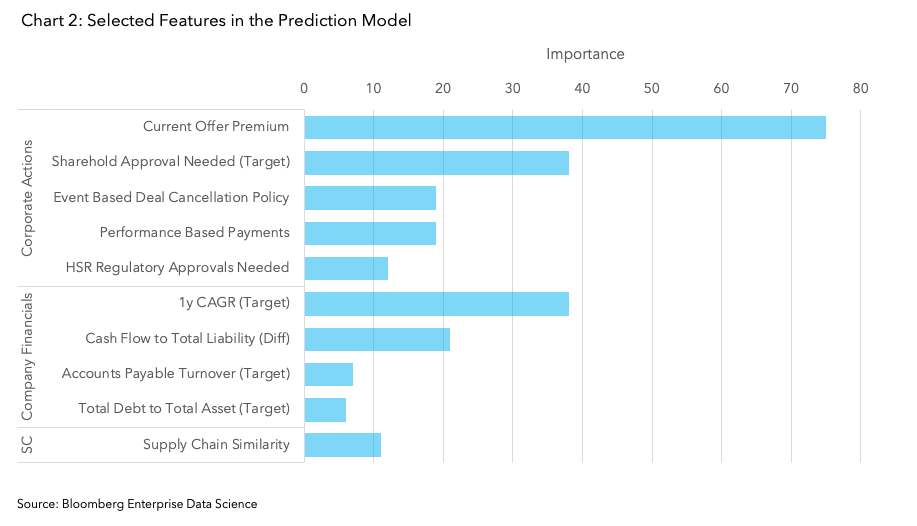
Some notable features in correctly predicting deal outcomes, as shown in chart 2, are the current offer premium, whether the target company’s shareholders need to approve the deal, the 1-year CAGR for the target and a measure of the overlap of the supply chain of the two firms in the deal. Other features we examined were the overlap in revenue segments and the number of news headlines which contained a rumor of a merger between the two companies in question one year prior to the deal’s announcement.
Theme: Merger Arbitrage
Roles: Hedge Funds, Quants, Portfolio Managers, Equity Analysts
Bloomberg Datasets: Equity Corporate Actions, Company Segment Fundamentals, Company Financials, Estimates and Pricing Point-in-Time, Supply Chain, News Headlines and Story Bodies
2. Inflation forecast using transaction data
Inflation information is crucial for investors as it impacts interest rates, economic growth, and asset prices. Staying informed about inflation trends enables them to protect and grow their investments during varying economic conditions and gain a competitive edge while making informed investment decisions.
Below, we highlight how transaction data can be used for such purposes. Powered by billions of U.S. consumer credit card and debit card transactions, Bloomberg Second Measure transaction data analytics provide early insight into the performance of consumer companies and greater depth of analysis.
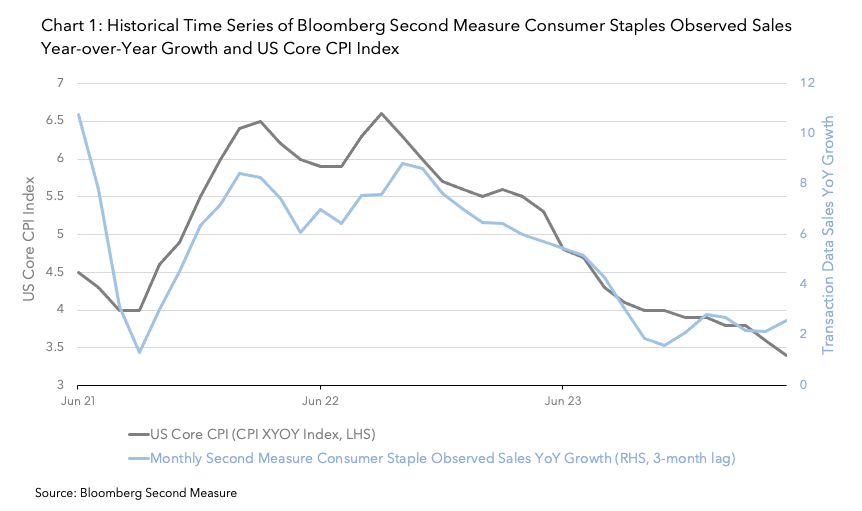
By aggregating observed transaction sales from companies within the Consumer Staples sector (as defined by BICS Level 1 Sector) and measuring its growth year over year, users can derive valuable insights into U.S. CPI trend (chart 1) which looks at the rolling 30-day observed sales year-over-year growth from these companies. Based on this, we have found it is leading the U.S. Core CPI Index (CPI XYOY Index) by 3 months, offering users a powerful tool for understanding the prices paid by consumers, which is one of the most watched macro indicators.
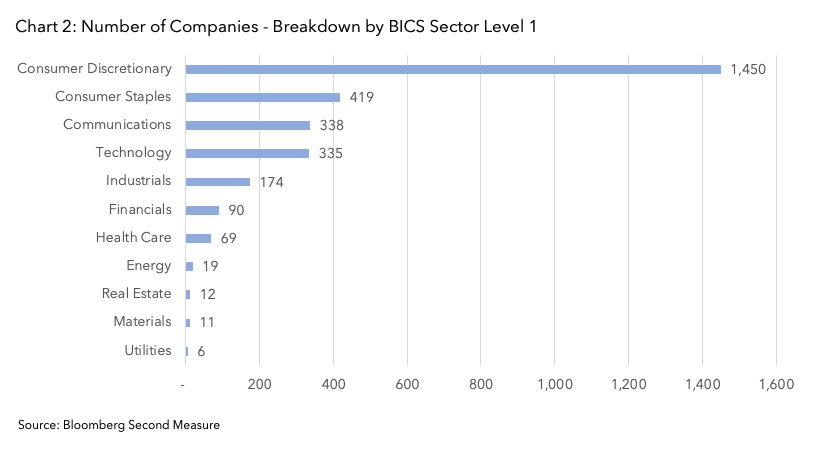
Bloomberg Second Measure transaction data analytics comes from a subset of a U.S. consumer panel that includes 20+ million consumers, and covers 3,000+ public and private companies and 4,000+ brands across industries with over 7 years of consumer spending history. Bloomberg Second Measure transaction data analytics are now available via Bloomberg Data Licence. This data is delivered daily with a 3-day lag. Additionally, Bloomberg Second Measure data analytics are available via Bloomberg Terminal ALTD <GO> function on a 7-day lag. Below is a breakdown of the number of companies by BICS sector level 1 covered within the dataset.
Theme: Macro Investing
Roles: Global Macro Portfolio Managers, Systematic & Quant Investors, Strategists
Bloomberg Datasets: Bloomberg Second Measure Transaction Data, Legal Entity Level BICS
3. News sentiment for credit
Fixed income investors are primarily interested in the creditworthiness of borrowers as they seek stable income streams. News data can help them by providing insights into the financial health and prospects of bond issuers, enabling them to make more informed investment decisions. Bloomberg’s News Headlines and Story Bodies deliver textual news in a machine-readable, analysis-ready format.
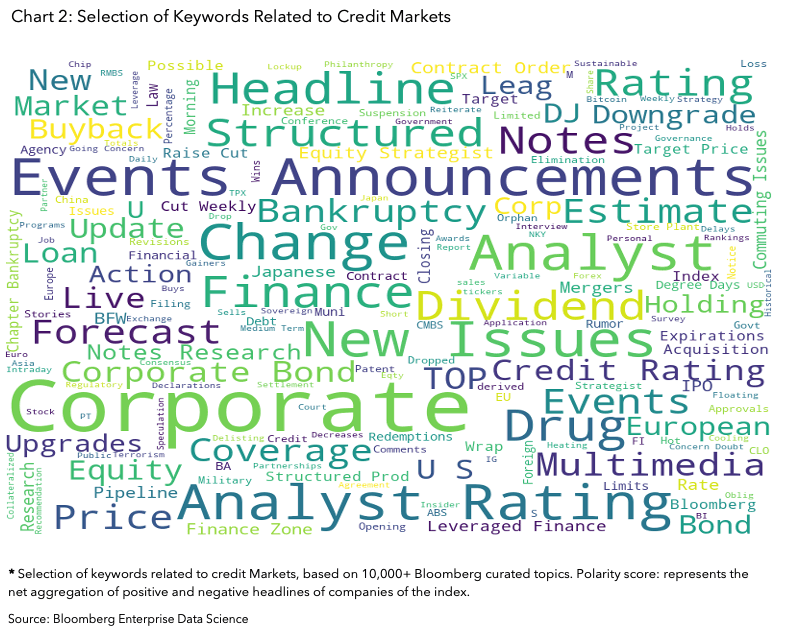
This allows customers to filter news related to specific instruments and topics, and derive actionable insights. In the example below, we have filtered headlines for the bonds in the Bloomberg U.S. Corporate High Yield Index, identified periods in time with unusual headline volume and determined the polarity associated with the headlines at the time by using a hand-picked selection of Bloomberg curated topics, some of which presented in the chart 2. For example, we classify headlines that are tagged with the topic code “DISTRESSED” as negative, as these are related to “News about distressed debt and securities that are in distress, default, or under bankruptcy”.
You can see the results of the weekly polarity scores of the headlines aggregated to the index level and the corresponding index weekly returns in chart 1.
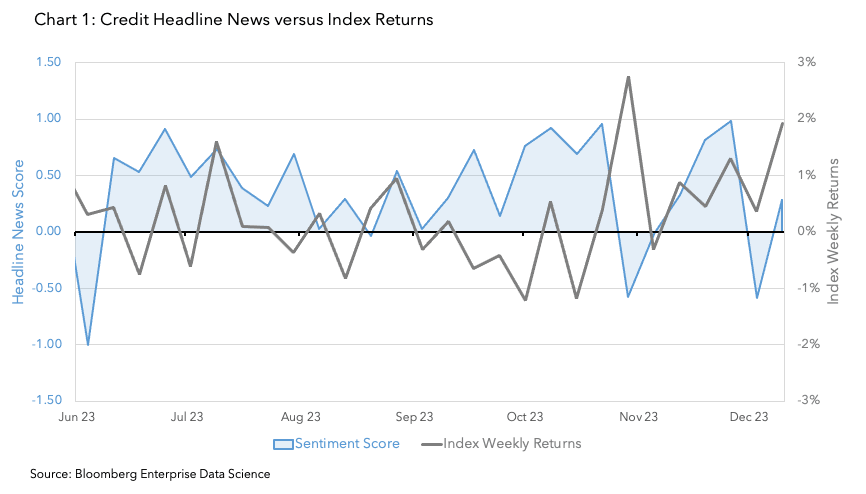
We can see from chart 1 that the pattern between the polarity score of news headlines is at times very correlated with the index returns. Performance of this strategy can be enhanced by incorporating analytics from the Company Sentiment And Market Moving News, such as sentiment information at the news story level. Instead of applying polarity to certain topic codes, the sentiment product can provide clients with accurate machine derived sentiment scores tagged to a specific headline.
Theme: Alternative Data for Credit Investing
Roles: Systematic Credit Investors, Fixed-Income Analysts, Risk Managers
Bloomberg Datasets: Company Sentiment And Market Moving News, News Headlines and Story Bodies
Interested to learn more about our data offering? Bloomberg’s Enterprise Data business transforms the way customers extract value from data by providing the most comprehensive coverage and highest data quality in the industry.
Bloomberg’s OneData approach makes all of the data easily discoverable on data.bloomberg.com, via Data License, instantly usable and delivered via APIs on the Cloud, to a customer’s hosting provider or data center. Our data management solutions aggregate, organize, and link your data to make it accessible through a diverse set of delivery mechanisms.