Bloomberg Professional Services
Welcome to Data Spotlight, our series showcasing insights derived from Bloomberg’s 8,000+ enterprise datasets available on data.bloomberg.com via Data License.
In this edition we take a look at customizable OHLC Bars, Virtual Data Room, and Corporate Event Calendar and how they can help systematic investors, data scientists and event-driven researchers with use cases such as:
- creating intraday strategies
- assessing analysts’ recommendations
- anticipating market volatility based on company events
Our previous editions of Data Spotlight can be found here:
1. Building systematic strategies for intraday trading
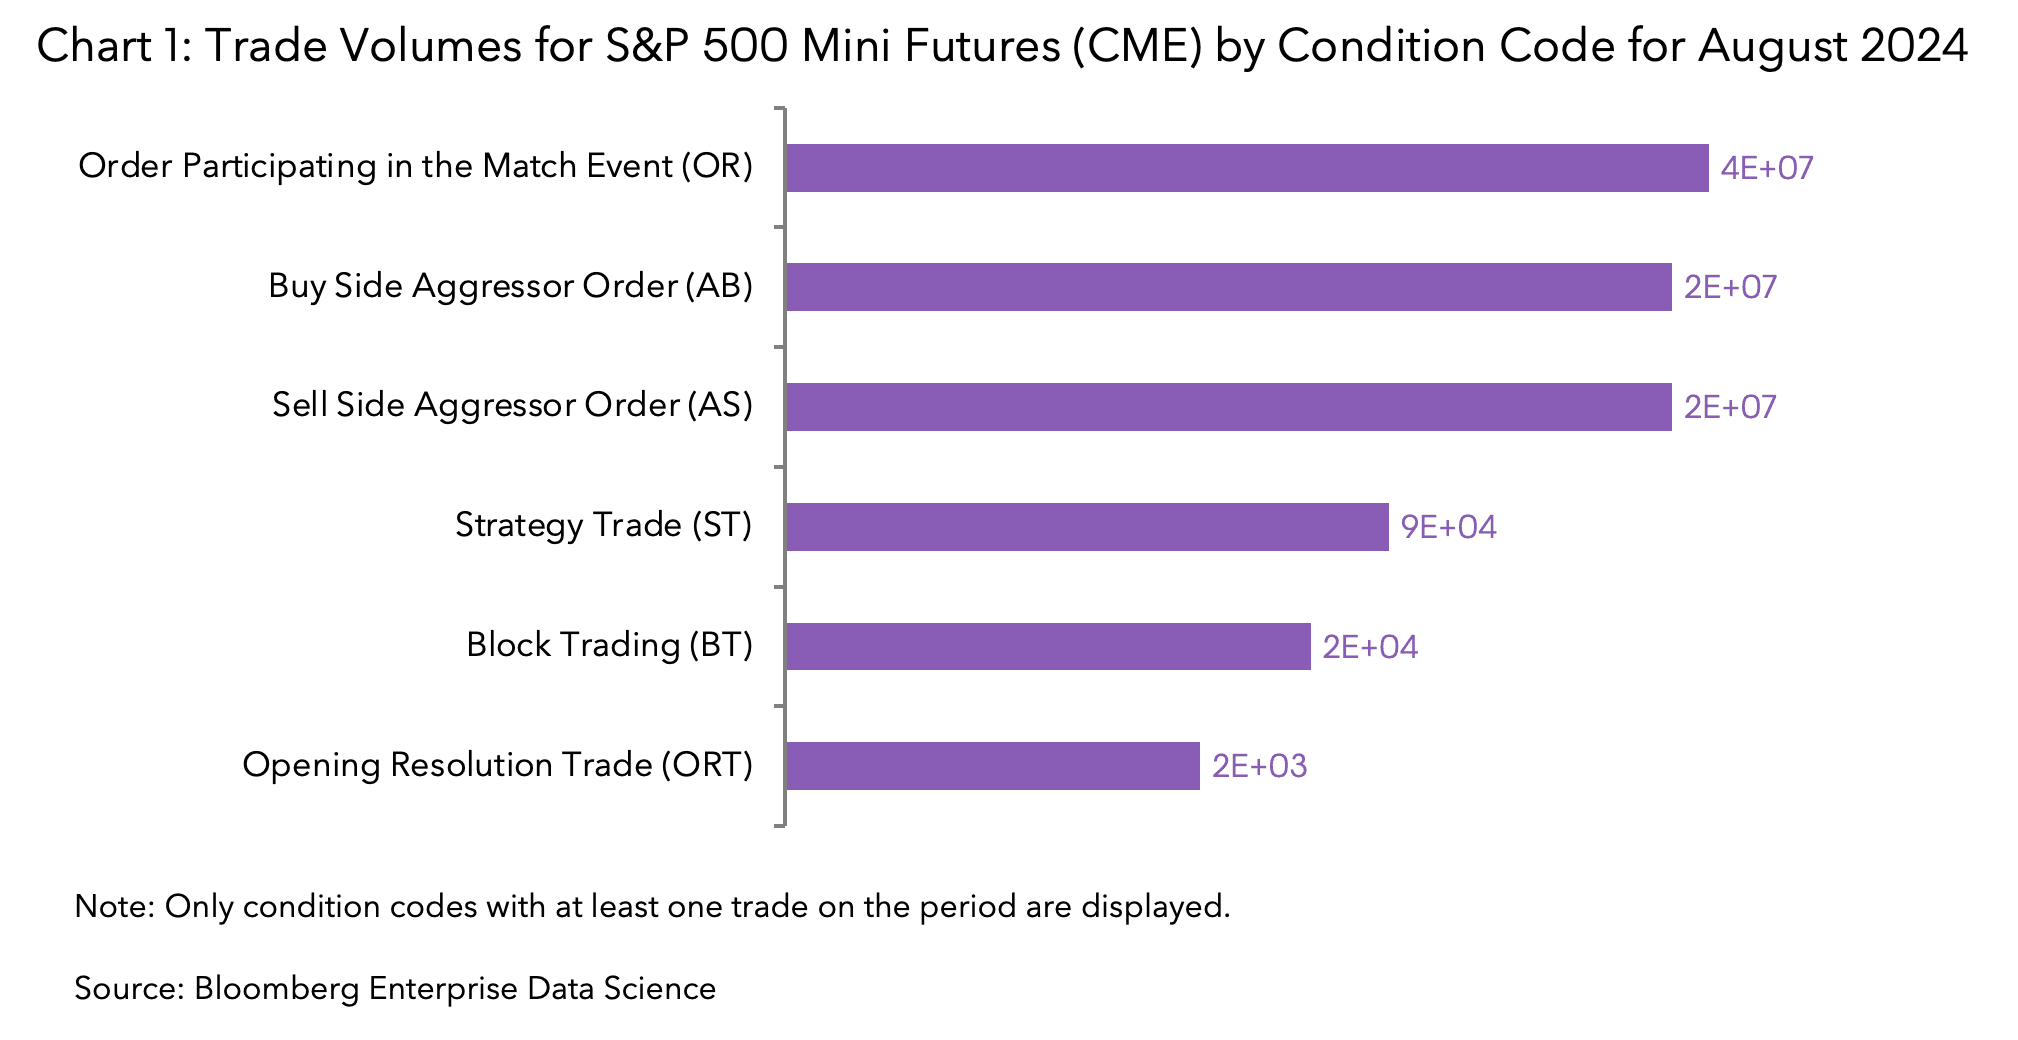
Tick history data is vital for intraday traders, serving as a key resource for market trend analysis and backtesting strategies. Bloomberg Tick History offers an extensive range of tick data on multiple asset classes going back to 2008. The API provides requests for up to a year’s worth of customizable Open-High-Low-Close bar (OHLC) data at a time for a specified bar interval. In addition to pricing data and aggregated quotes, exchanges send condition codes associated with the trade (for an example see Chart 1).
Investors accessing this data can rapidly build custom data bars utilizing a combination of condition codes, which can be used to build intraday trading strategies for futures or other instruments.
As an illustration, we focus on condition codes ‘AB’ (aggressor buy order) and ‘AS’ (aggressor sell order), where a market player is executing at ask or bid prices, which can indicate a signal for market direction.
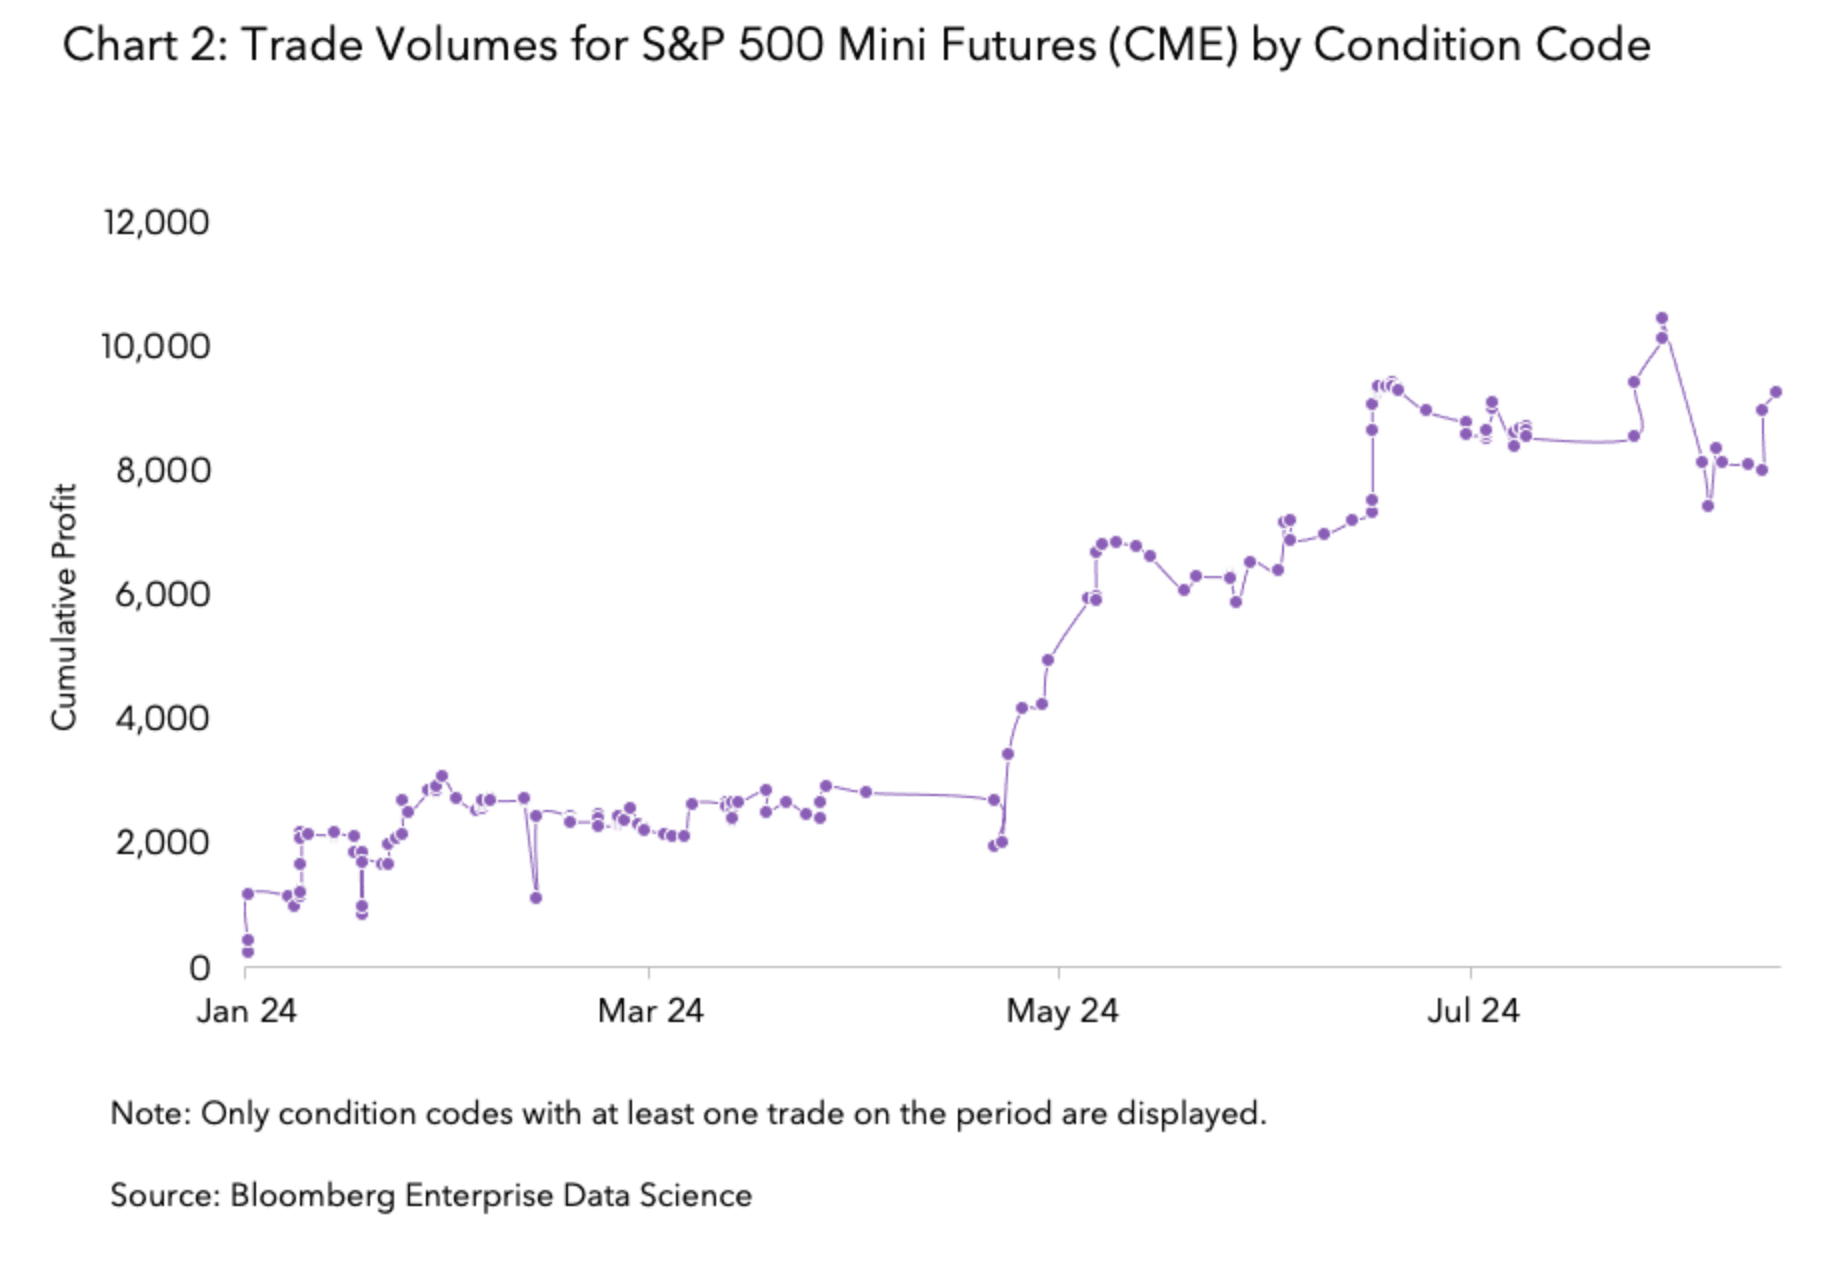
We can derive quantities such as buy or sell pressure and use them as features for a machine learning algorithm that attempts to predict whether entering a trade will be profitable. In Chart 2 (cumulative profit), we can see that algorithms for trading instruments such as S&P 500 Futures can potentially be profitable. Using the additional information found in trade condition codes pointed to potential signals in the intraday market.
Theme: Systematic Investing
Roles: Quant Portfolio Managers, Traders, Systematic Investors
Bloomberg Dataset: Tick History
2. Assessing the power of analysts’ recommendations
While analyst recommendations can be a useful source of gathering information that can help with investment decisions, accessing a wide range of such recommendations can be a daunting task, given their decentralized nature.
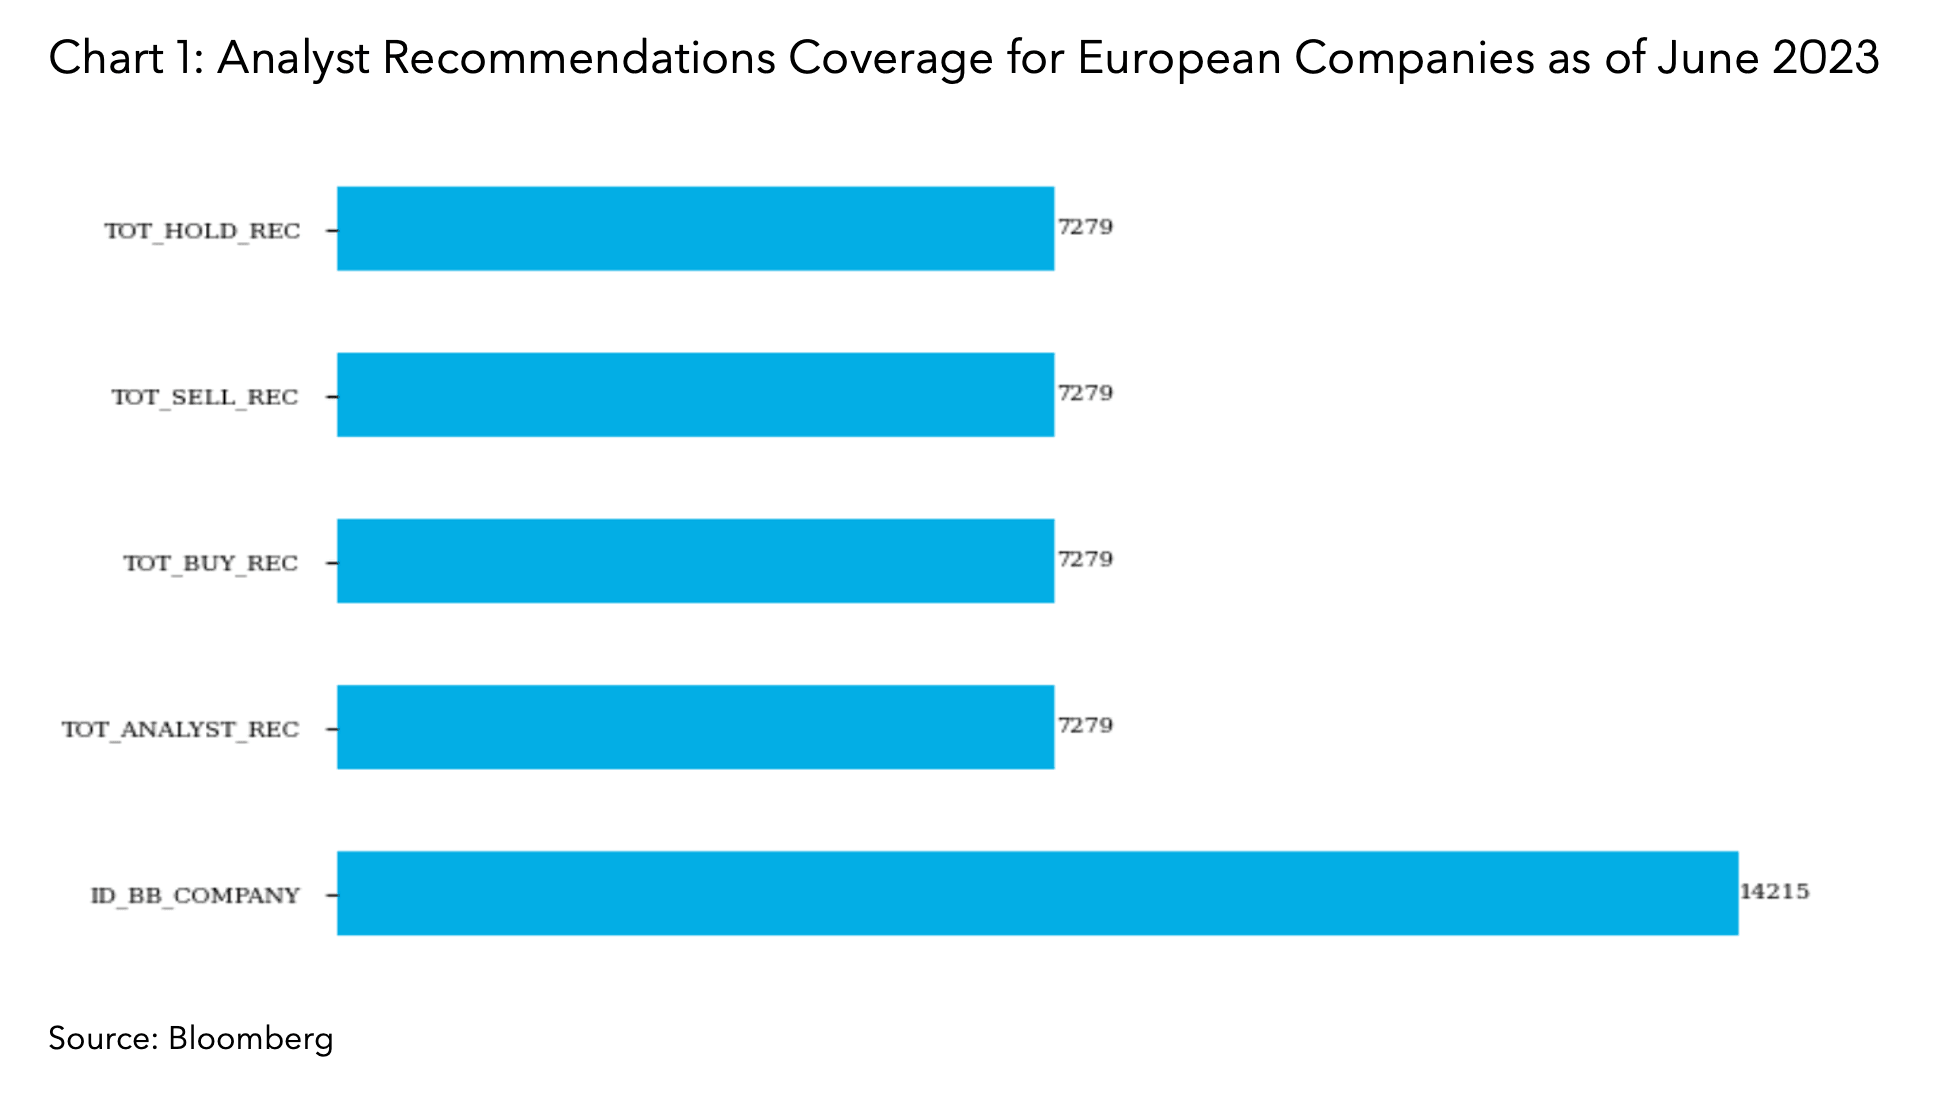
To that end, solutions such as Company Financial, Estimates and Pricing Point-in-Time (CoFI PiT) include analysts’ recommendations for a large number of companies (Chart 1).
However, the timeliness and coverage of consensus recommendation data are crucial to its effectiveness. Inadequate coverage can lead to inaccurate or incomplete information, which can be detrimental to investment decisions. Therefore, it is essential to have a comprehensive coverage of analyst recommendations delivered timely to ensure that the consensus view is representative of the market at a given point of time.
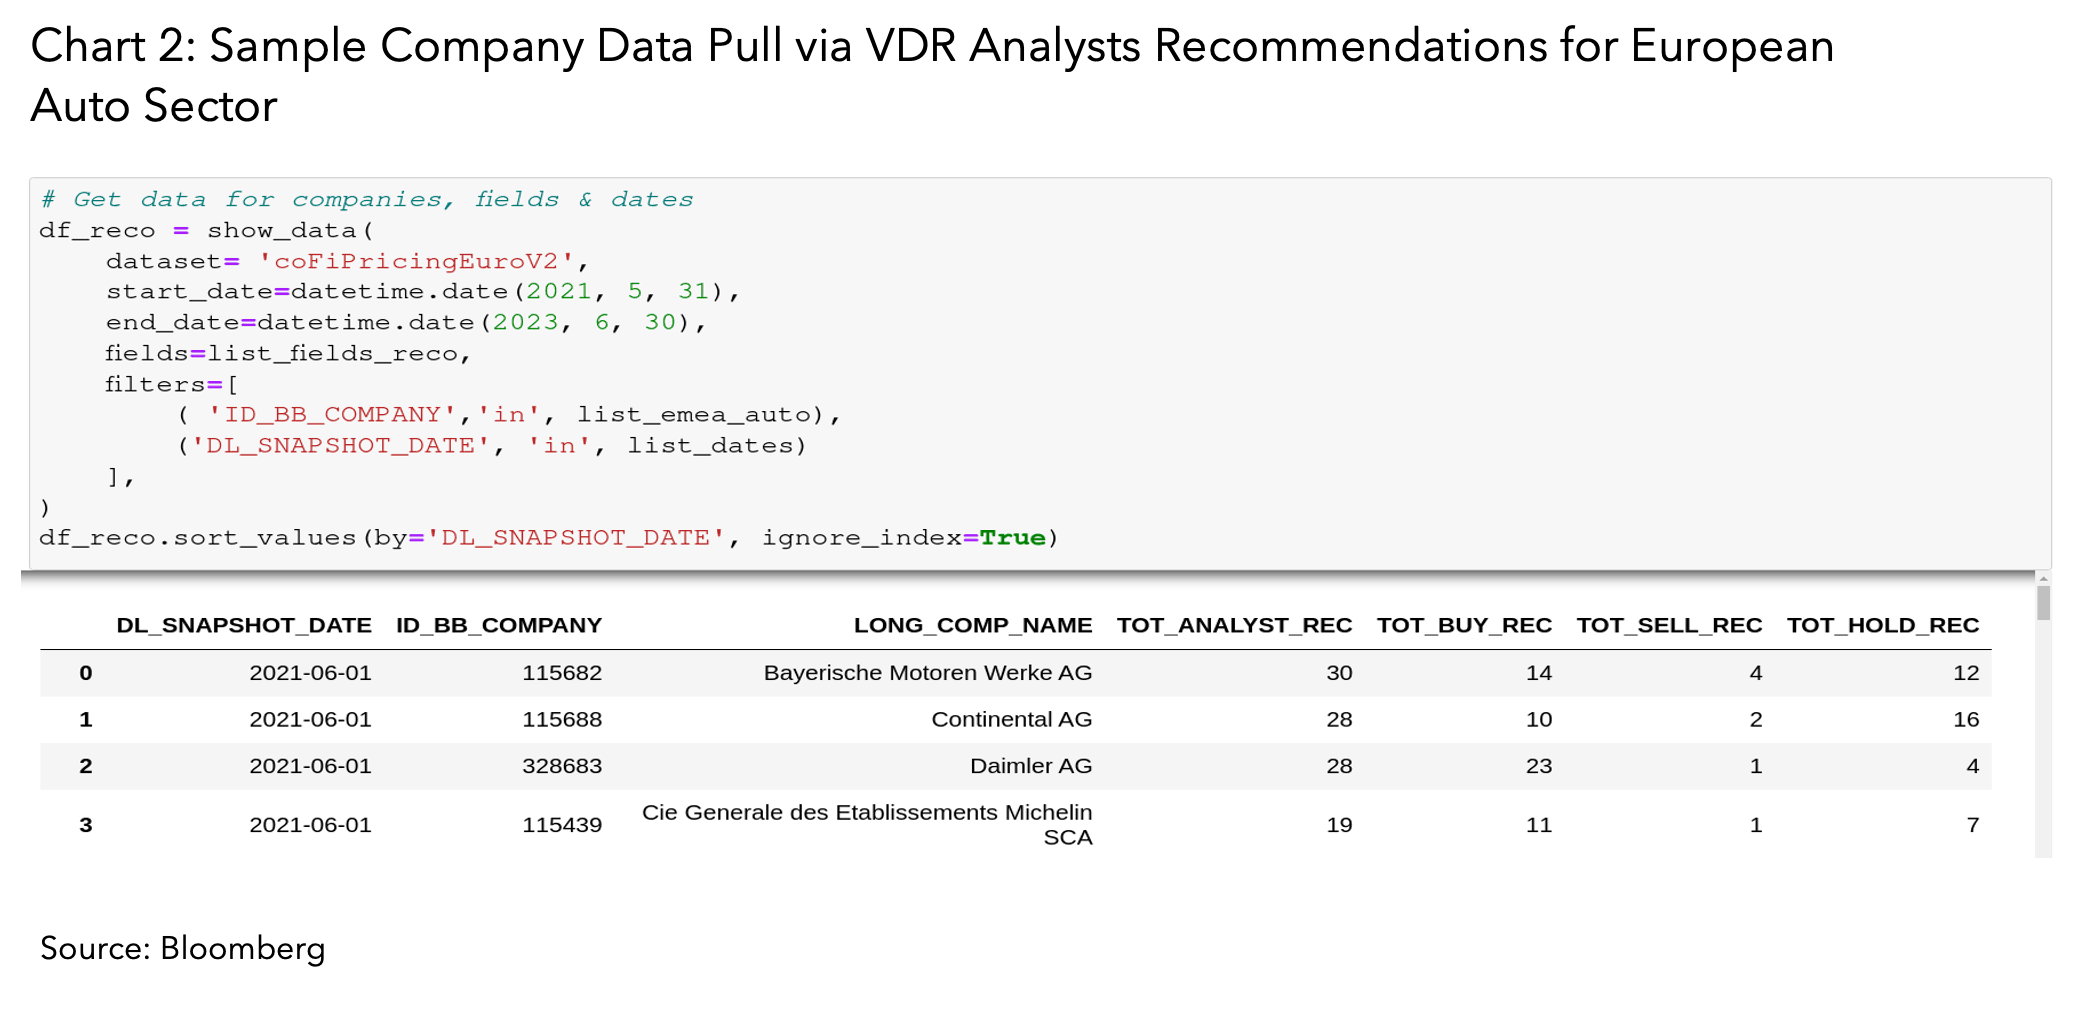
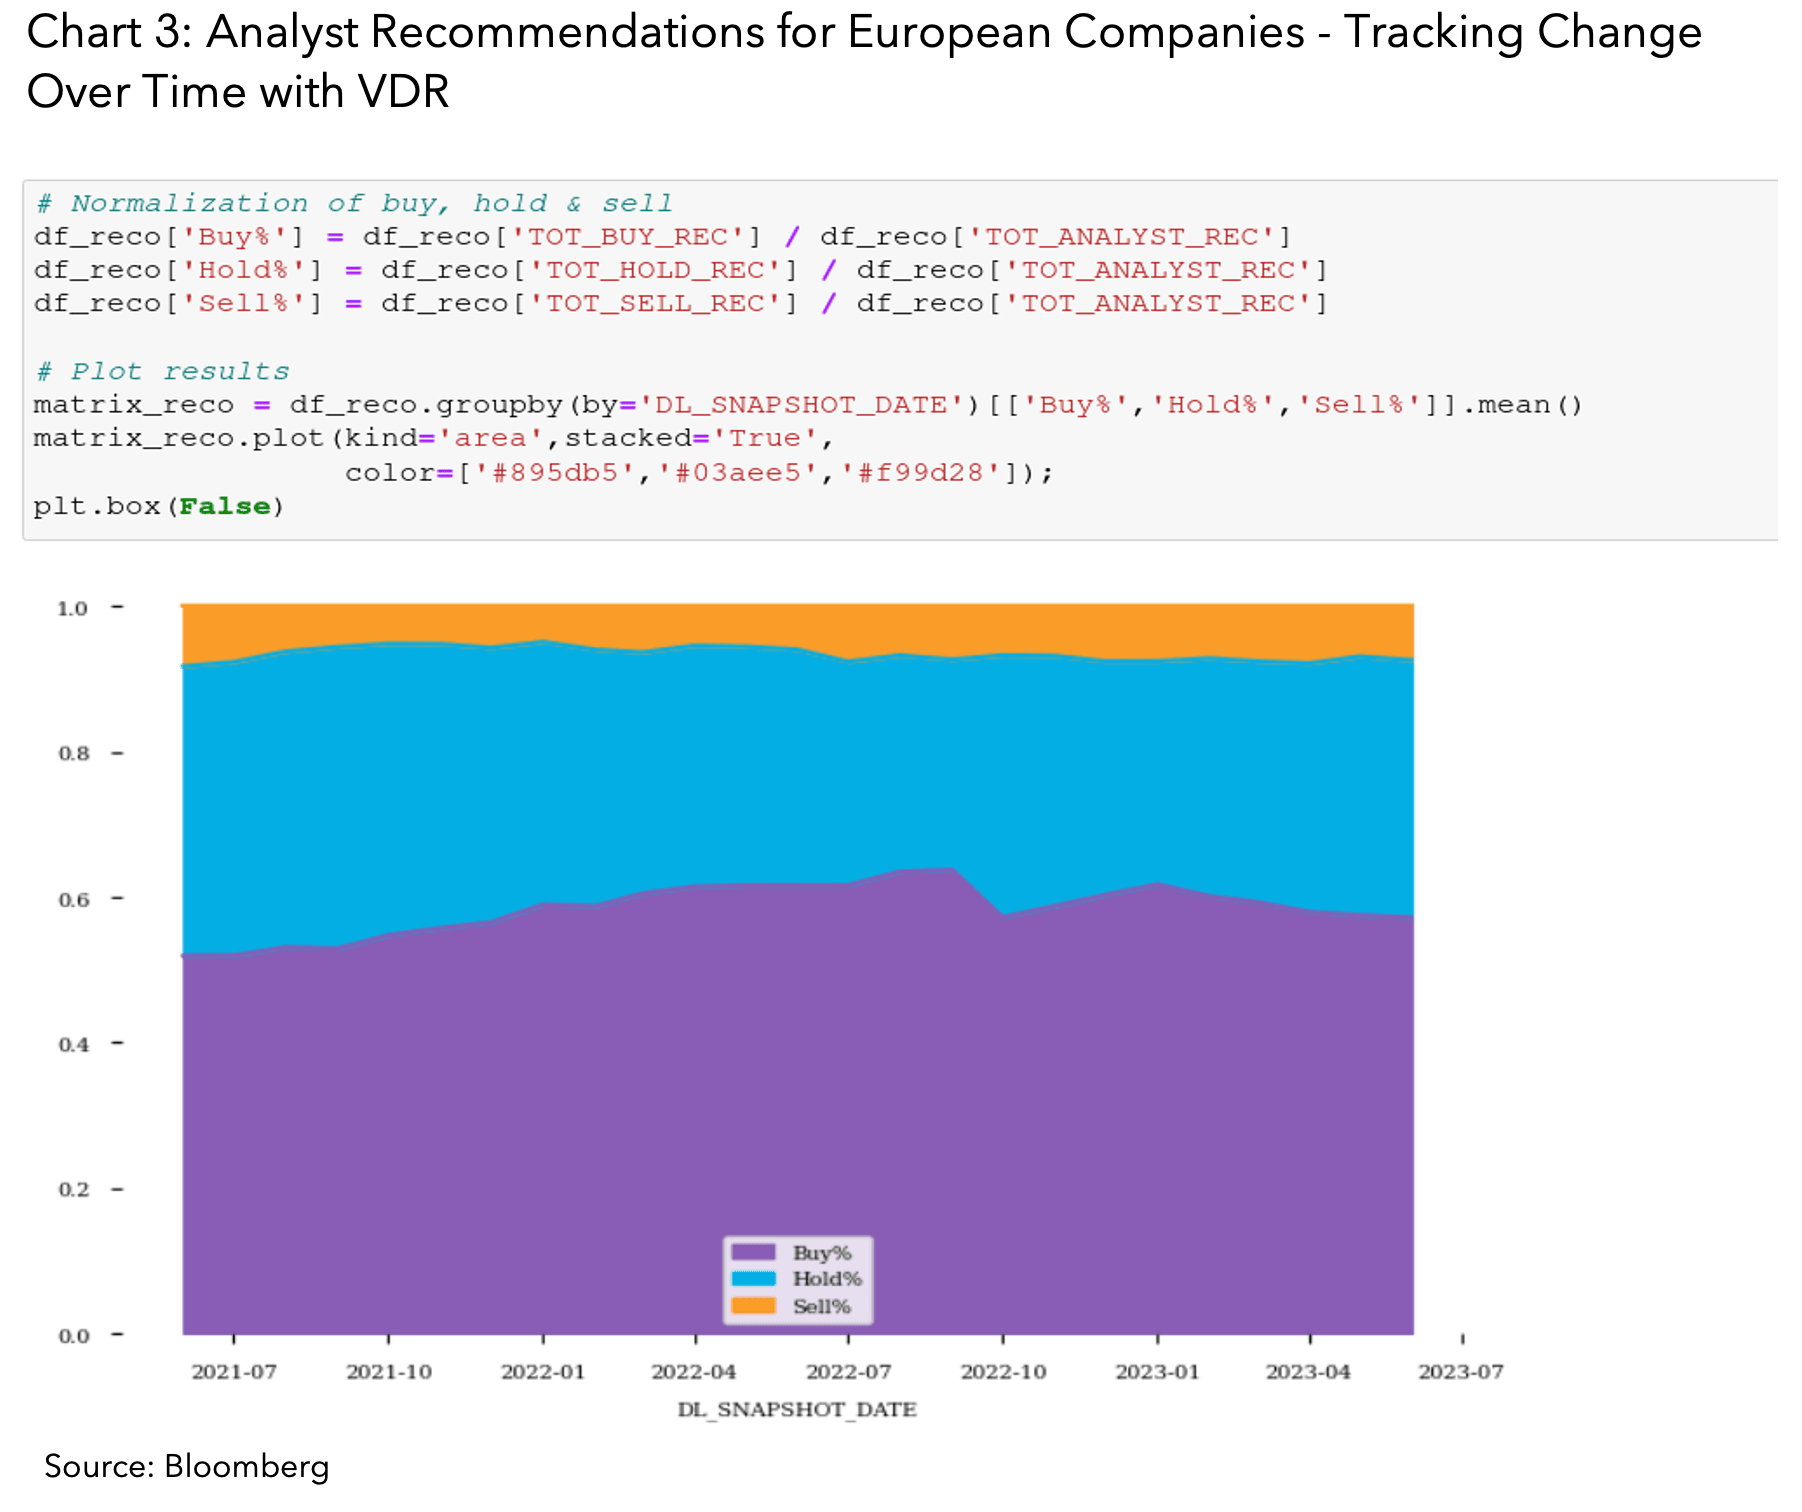
To explore the coverage and quality of consensus recommendations, let’s explore Virtual Data Room (VDR), a sandbox that helps to evaluate Bloomberg’s extensive catalog of data for faster decision making. Chart 2 shows how a VDR user can easily evaluate the data coverage of analyst recommendations in CoFI PiT and how it can be then charted into the corresponding sector analysis (Chart 3).
Bloomberg’s VDR is readily available where customers go to access their Data License content at data.bloomberg.com or by entering Data <GO> on the Bloomberg Terminal. With just a login to Bloomberg’s intuitive online data catalog, customers can begin testing Bloomberg’s bulk dataset spanning company data, sustainability data, pricing, reference data, and more. Bloomberg’s VDR is continuously expanding to include more bulk datasets available for testing to meet a variety of evolving use cases. To learn more, click here.
Theme: Data Exploration
Roles: Data Scientists, Researchers, Equity Portfolio Managers
Bloomberg Datasets: Company Financials, Estimates and Pricing Point-in-Time
3. Anticipating market volatility based on company events
Analyzing company events, such as earnings releases and shareholder meetings can empower investors to spot inflection points, as well as formulate and test their investment theses.
In the study below we looked at the relationship between earnings releases and market volatility. Using Bloomberg’s Corporate Events Calendar (EVTS) which provides a comprehensive summary of upcoming company events, including earnings releases, dividend announcements and investor days.
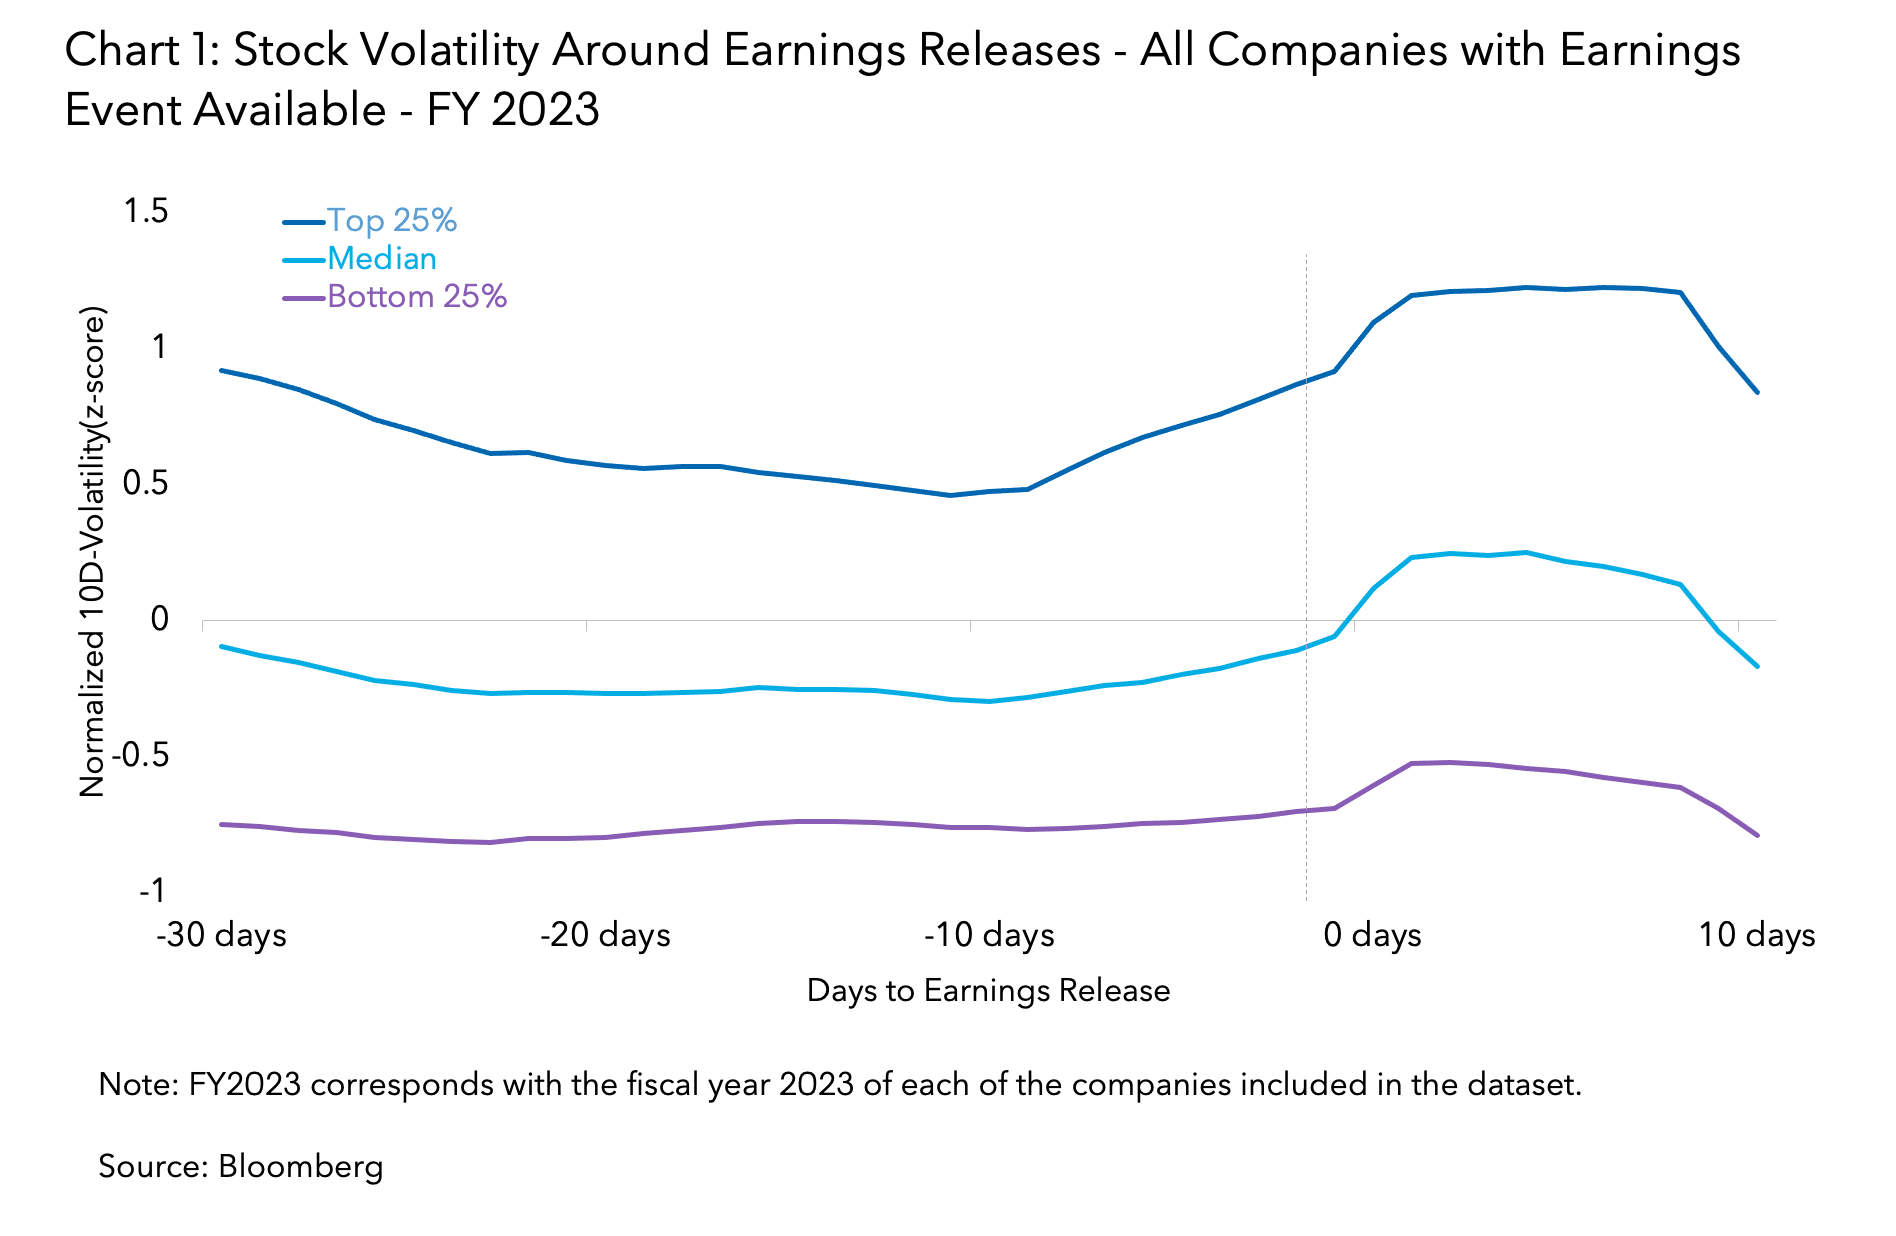
For this study, we analyzed the historical volatility around earnings release dates for the fiscal year 2023 of each of the companies included in the dataset. By standardizing volatility across companies using z-scores, we found that on average, we were able to track stock volatility before the day of the announcement. (Chart 1)
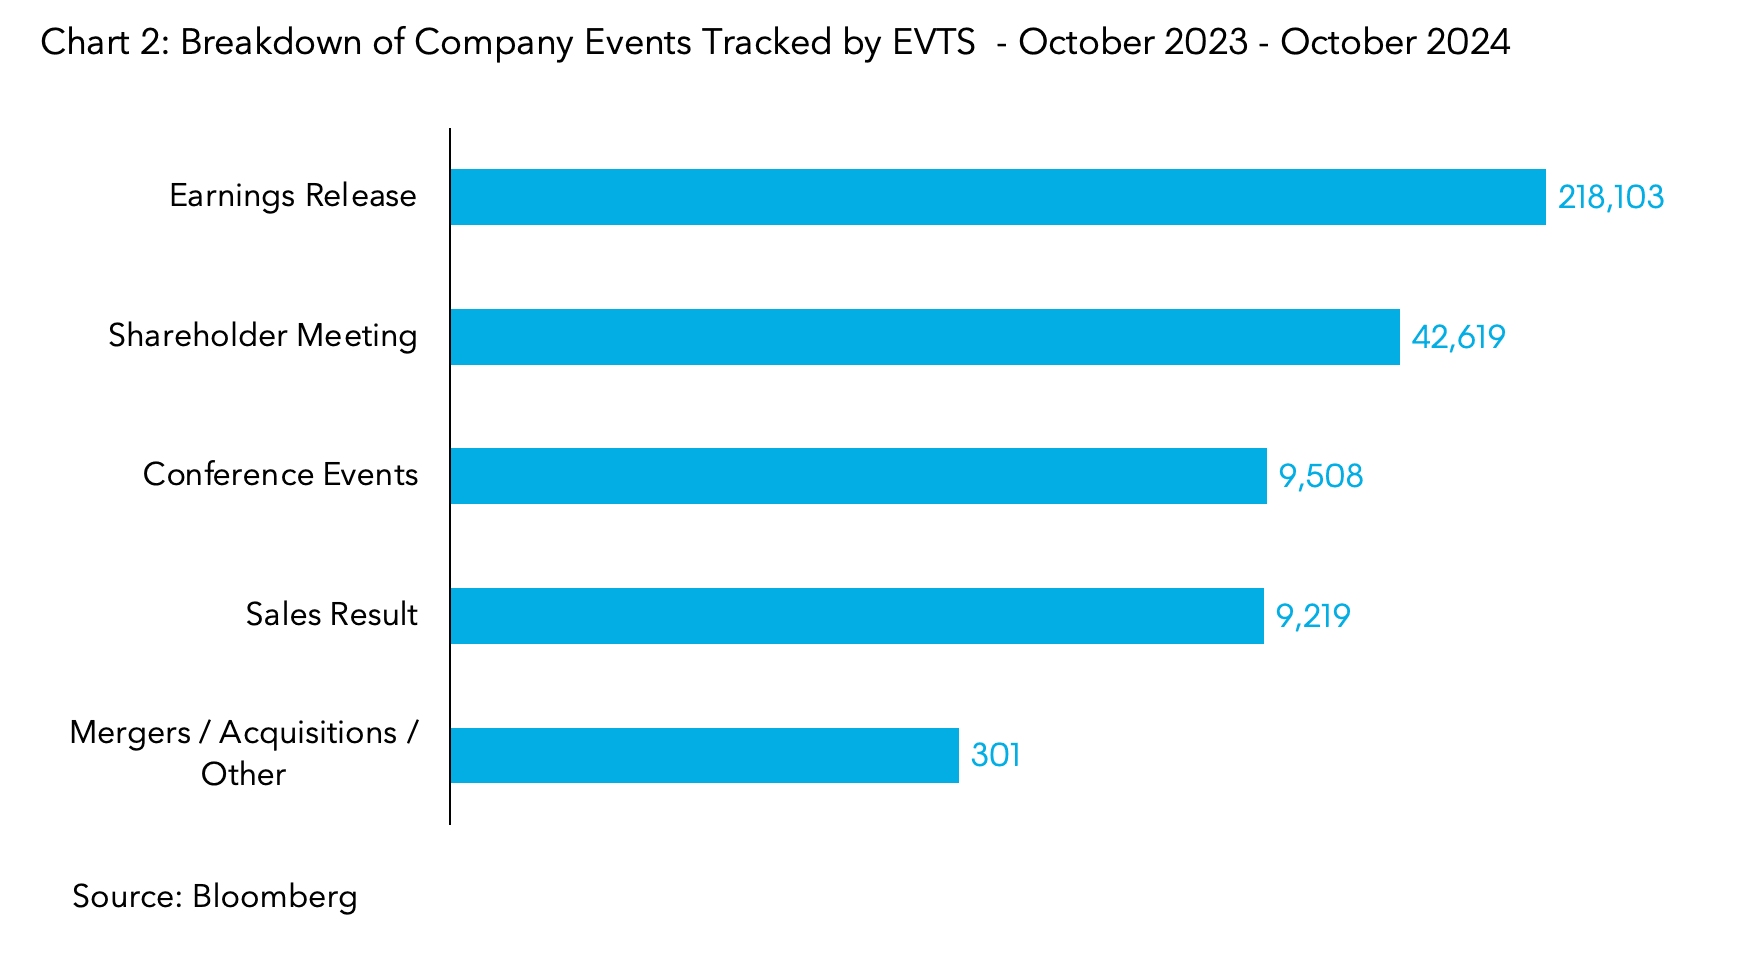
This analysis is based on an extensive list of company events. As shown in Chart 2, in a sample period of twelve months (between October 2023 and October 2024) EVTS tracked 280,000 company events such as earnings releases and shareholder meetings.
Once investors have refined their approach and are confident in its effectiveness, they can put it into practice in real-time with Bloomberg’s real-time solutions.
Theme: Event-Driven Investing
Roles: Quant Portfolio Managers, Traders, Systematic Investors
Bloomberg Dataset: Events Corporate Access
Interested to learn more about our data offering? Bloomberg’s Enterprise Data business transforms the way customers extract value from data by providing the most comprehensive coverage and highest data quality in the industry.
Bloomberg’s OneData approach makes all of the data easily discoverable on data.bloomberg.com, via Data License, instantly usable and delivered via APIs on the Cloud, to a customer’s hosting provider or data center. Our data management solutions aggregate, organize, and link your data to make it accessible through a diverse set of delivery mechanisms.
The data included in these materials are for illustrative purposes only. The BLOOMBERG TERMINAL service and Bloomberg data products (the “Services”) are owned and distributed by Bloomberg Finance L.P. (“BFLP”) except (i) in Argentina, Australia and certain jurisdictions in the Pacific Islands, Bermuda, China, India, Japan, Korea and New Zealand, where Bloomberg L.P. and its subsidiaries (“BLP”) distribute these products, and (ii) in Singapore and the jurisdictions serviced by Bloomberg’s Singapore office, where a subsidiary of BFLP distributes these products. BLP provides BFLP and its subsidiaries with global marketing and operational support and service. Certain features, functions, products and services are available only to sophisticated investors and only where permitted. BFLP, BLP and their affiliates do not guarantee the accuracy of prices or other information in the Services. Nothing in the Services shall constitute or be construed as an offering of financial instruments by BFLP, BLP or their affiliates, or as investment advice or recommendations by BFLP, BLP or their affiliates of an investment strategy or whether or not to “buy”, “sell” or “hold” an investment. Information available via the Services should not be considered as information sufficient upon which to base an investment decision. The following are trademarks and service marks of BFLP, a Delaware limited partnership, or its subsidiaries: BLOOMBERG, BLOOMBERG ANYWHERE, BLOOMBERG MARKETS, BLOOMBERG NEWS, BLOOMBERG PROFESSIONAL, BLOOMBERG TERMINAL and BLOOMBERG.COM. Absence of any trademark or service mark from this list does not waive Bloomberg’s intellectual property rights in that name, mark or logo. All rights reserved. © 2024 Bloomberg.
