Finding accurate market information on securities that seldom trade or only trade in small batches is a tricky proposition and makes it challenging to find answers to the following types of questions:
- How much should you pay to execute a particular trade?
- Without market depth on the security, what does liquidity look like for comparable instruments?
- Can you find cost savings for re-balancing the portfolio?
- What is the liquidity limiting trade in a portfolio trade and how is it affecting the price?
- How do you evaluate dynamic liquidity measures across your entire portfolio/s and monitor watchlists when only a small portion of assets are regularly quoted?
When faced with these questions, firms previously relied on overly simplistic liquidity classifications, or subjective front-office assessments. However, after the recent bouts of market volatility, firms have increased scrutiny of their liquidity risk processes and adopted more robust liquidity analytics like those produced by Bloomberg’s Liquidity Assessment solution (LQA).
LQA solves the key pain points around liquidity risk assessment by combining Bloomberg’s robust financial data sets with advanced modeling techniques to provide daily security-specific liquidity estimates for over 5 million securities across multiple asset classes, including those with little-to-no recent trading activity.
Liquidity assessment at scale: BQL integrates LQA
To extend LQA’s use case and help clients assess liquidity accurately and at scale, Bloomberg has recently integrated LQA functionality into Bloomberg Query Language (BQL).
BQL is the latest generation Bloomberg API that enables firms to easily retrieve and analyze normalized, curated, and point-in-time Bloomberg data. With BQL, firms can easily perform custom calculations directly in the Bloomberg Cloud and synthesize large amounts of data while extracting the exact information needed through easy-to-learn syntax.
The addition of LQA into BQL enriches pre-trade market liquidity assessments so firms can quickly analyze liquidity trends, estimate the expected time to find an execution opportunity, assess slippage cost from a reference price, or evaluate how large market capacity may be for a given universe based upon liquidation cost constraints, among other use cases.
Historically, in order to evaluate the liquidity profile based upon liquidation cost within an index, it was necessary to download extremely large volumes of raw data then perform time-consuming Excel based manipulations. Now, LQA via BQL streamlines this process by extracting only the data requested and all calculations are performed directly in Bloomberg Data Centers helping firms to optimize their data consumption.
The following sections provide examples on how LQA via BQL can be used to achieve the following common analyses:
- Performing current and historical analysis on liquidity metrics leveraging BQL aggregation capabilities.
- Enhance research / pre-trade analysis to assist with portfolio construction, rebalancing, performance benchmarking, and relative value analysis.
Macro analysis: Aggregate liquidity metrics
LQA via BQL enables users to analyze liquidity metrics (e.g. liquidity score, estimated round trip cost) on a chosen universe (e.g. single security, watchlist, portfolio, index) and easily aggregate the results based on specific requirements to extract the exact information needed from a large universe of data. This minimizes the amount of data to be managed, which vastly reduces both the time and effort required to produce this research.
For example, the chart below shows how a client can use LQA via BQL, to analyze the weighted average liquidity score by sector (according to Bloomberg FI Classification System, BCLASS, Level 2), and custom duration bucket for the Bloomberg Pan-European High Yield Index, as of May 31, 2023. With limited time spent, it is clear to see there are liquidity concerns for the Financial Institutions sector.

Execution analysis: Estimating cost slippage
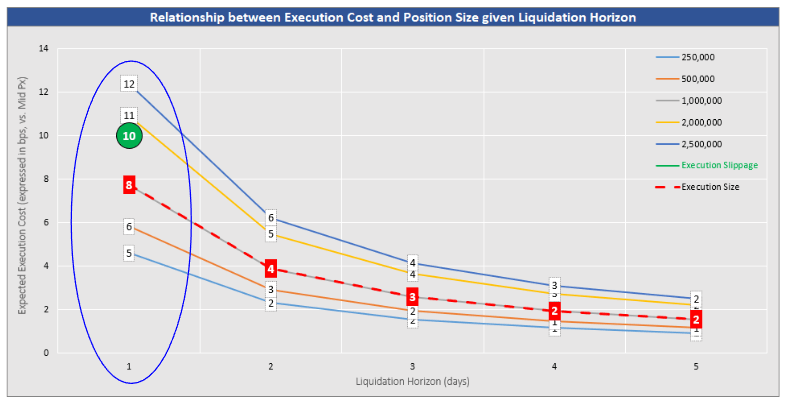
Clients can also use LQA via BQL to implement a simple interface for execution analysis (either pre- or post-trade). When looking to execute a security which may not have a very active two-way market, it’s often difficult to assess what would be a fair price spread (bid-offer). LQA via BQL allows users to analyze the estimated cost to liquidate a security for multiple combinations of volume and horizon.
The following chart illustrates the relationship between the liquidation horizon, position size, and slippage cost. In this example, given a 1-day liquidation horizon and a EUR 1 Million nominal size, LQA estimates a cost slippage of 8 bps (of price relative to mid). This compares to an expected (or realized) slippage of 10 bps (shown in green).

Pre-trade analysis: Research and trend analysis
LQA via BQL provides an intuitive view for evaluating the market liquidity landscape for a list of securities where traditional risk or performance measures do not provide insights into ease of execution. BQL can be used to perform an assessment of how the liquidity profile of a target security compares to similar securities in the current market environment and over time.
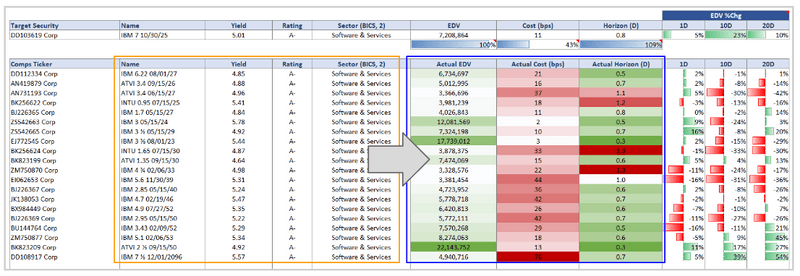
Taking an example of the IBM 7 2025 bond, the below dashboard shows how securities with similar yields, credit ratings, and sectors can have different liquidity profiles even when they are issued by a single entity like IBM. LQA measures via BQL present opportunities to further refine a universe of similar securities comparing liquidity profiles in addition to traditional metrics.

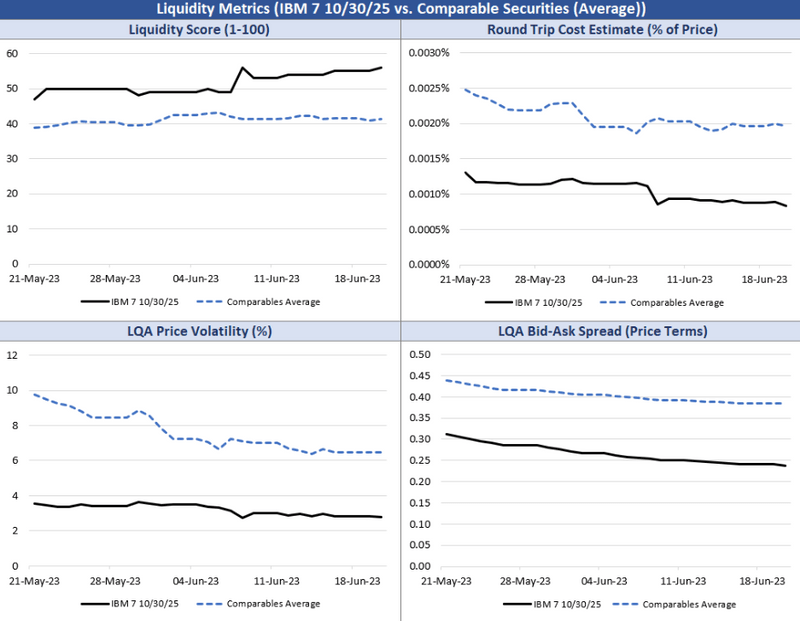
Clients can also complement current data with a time series analysis of whether liquidity measures are converging or diverging. For example, the following time series analysis suggests that the target security has consistently had a more favorable liquidity profile using key liquidity indicators over the past month.

The path ahead
Accurately assessing liquidity metrics is a critical piece of the front-office workflow and having tools that can fill in gaps where there is limited trading data is imperative as firms navigate today’s markets. LQA analytics delivered via BQL provide a scalable solution for pre- and post-trade analytics saving clients significant time so they can make decisions faster and with more confidence.
To learn more about how firms’ can enhance pre-trade liquidity analysis by incorporating axe data into their investment analytics via BQL, view Bloomberg’s earlier blog post in the series, here.