Supply shock vs. Demand destruction: Commodities face lose-lose
This analysis is by Bloomberg Intelligence analyst Mike McGlone. It appeared first on the Bloomberg Terminal.
Commodities can be their own worst enemies when they get too far out over their skis, and we see 2022 risks akin to 2008’s pump and dump. Energy prices may inch higher or collapse, the latter typical amid similar supply-shock spikes. What’s different now is the U.S. paradigm shift to largest energy producer and net exporter from the top importer. Embracing technology is a primary reason, and the war and high prices should accelerate existing trends away from a world reliant on fossil fuels, notably from mercurial sources.
Copper and base metals are subject to demand destruction and reversion risks along with crude oil, in addition to central banks fighting inflation. A record Corn Belt crop this year is likely, but it may not be enough to cover production lost to the war. Gold may be a primary beneficiary.
Nixon-Ford level of commodity inflation may prove ephemeral
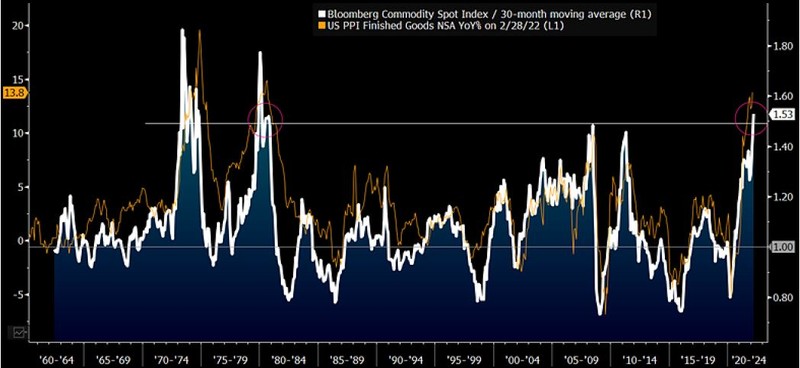
The lessons of extremely stretched commodity prices achieved in 1Q is that they typically revert sharply and can set enduring peaks. It was the transition to the Gerald Ford administration in 3Q74 that the Bloomberg Commodity Spot Index had its best quarter. It took about four years to sustain higher levels. The BCOM’s third-best showing came in 1Q22.
Rare extremes for commodities, inflation
For commodities, which are typically more tactically oriented, the decision to buy or sell can be a question of determining the velocity of price movements, and history may favor responsive sellers at end of 1Q levels. At about 50% above the 30-month moving average, our graphic shows the elevated reversion potential of the Bloomberg Commodity Spot Index and the connection with the producer price index. In 2008, the BCOM corrected about 50% from similar stretched levels. We see parallels.
So, what’s different this time? That the U.S. has evolved from a net importer to one of the world’s largest energy and agriculture producers and exporters may tilt the bias toward reversion. The higher-price cure may be stronger than ever, and if risk assets don’t decline, the Federal Reserve is set to tighten the clamps.
Commodities about as stretched as they get

What does $100 crude oil history show? The price is too high
When Saddam Hussein invaded Kuwait in 1990, crude oil spiked to about $40 a barrel from $20, then took about 14 years to breach that peak, and we see parallels in 2022. What’s different is that North America is now the world’s top producer and a net exporter of energy, and harnessing advancing technology is a top reason why. The war is likely to fuel this trend.
$50 Crude oil may be path of least resistance
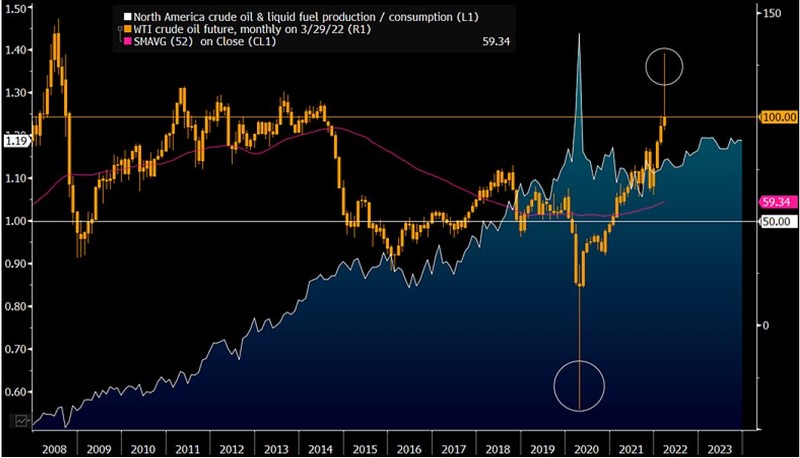
The potential for the 1Q West Texas Intermediate crude oil future high of about $130 a barrel to be as enduring as $40 in 1990, or the low at about minus $40 in 2020, is rising. We see reversion parallels to the only two times in futures history that WTI stretched a similar 2x above its 200-week moving average — the 1990 Gulf War and the all-time high in 2008. Our graphic shows what has happened since the first time crude crossed the $100 resistance threshold in 2007 — the surplus of U.S. and Canada liquid-fuel production vs. consumption has risen to about 20% from a deficit closer to 50%.
What’s notable is the upward trajectory of demand exceeding supply has a tendency to stall when prices plunge. We expect more of the same — elasticity — to boost supply and reduce demand on the back of the 2022 spike.
$100 Crude oil and supply, demand elasticity

Recession or reversion: Gold vs. Base metals, the Fed and Putin
Industrial metals may have entered a potential lose-lose situation vs. crude oil, the stock market and Federal Reserve. If some combination of these asset prices keep rising, the Fed will have to be more aggressive fighting inflation. We see risks tilted toward reversion for copper, crude and stocks, which should buoy gold.
Copper, base metals: War pump vs. Demand destruction
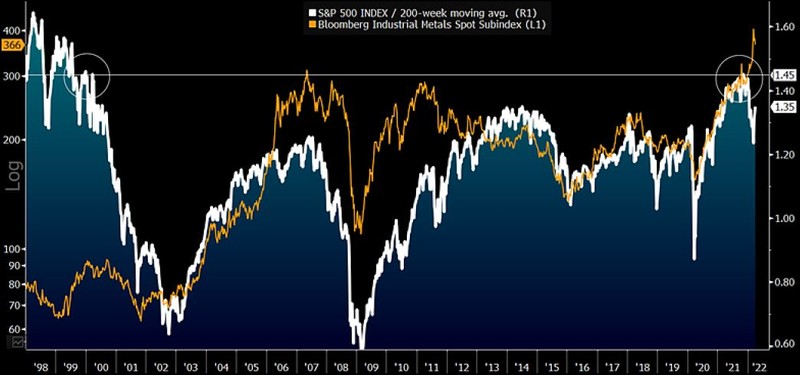
Industrial metals exiting 1Q appear dependent on a buoyant U.S. stock market to keep advancing and outperforming gold, and our bias favors the precious. Reversion risks for the Bloomberg Industrial Metals Spot Subindex are the most elevated vs. the S&P 500 and its 200-week moving average since 2000. Russia’s invasion of Ukraine has spiked aluminum and nickel, but slack performance of the most significant base metal — copper — may be sniffing out greater risks of crippling demand. It’s a question of duration until the higher-price cure typically prevails.
Rising risks of global recession, central banks’ increasing restraint, the inflation base effect and elevated chances of stock market reversion point to limited further upside for industrial metals vs. the normal pullback potential.
About 20-year extremes for reversion risks

It’s 2022 vs. 1973 – Soviet Union great grain robbery parallels
If there’s a time for North America to boost grain production, it’s 2022, since we expect the largest Corn Belt crop in history due to motivation and profit to help offset supply that may be lost due Russia’s invasion of Ukraine. What’s similar now vs. 1972-73 is the potential for sustained higher prices, akin to when the then-Soviet Union imported a large amount of U.S. grain.
What was resistance is shifting toward support
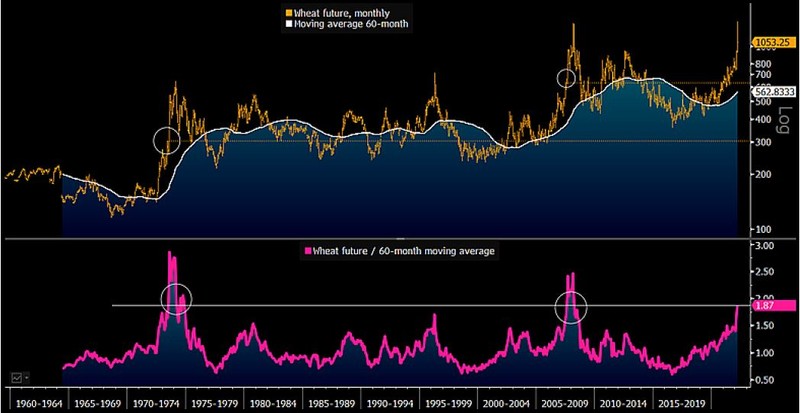
The lessons of commodity history don’t favor sustained higher grain prices following elevated levels achieved at the end of 1Q and the start of northern hemisphere planting season, but Russia’s invasion of Ukraine may add endurance. The unusual combination of high prices and sowing season will incentivize plenty of production in grains, the most supply-elastic commodities. It’s a question of how much and when, and we expect the Great Grain Robbery of 1972-73 to offer price guidance, when resistance in the benchmark wheat future at about $2 a bushel shifted to elongated support at around $3.
Our graphic depicts stretched prices vs. the 60-month moving average to March 28 approaching 1973 extremes. Since the 2007-08 spike, about $6 as acted as the pivot and resistance until 2021. We expect that to be revised toward $10.
Wheat $6 floor and enduring $10 average?
