Bloomberg Professional Services
This analysis is by Bloomberg Intelligence Senior Commodity Strategist Mike McGlone. It appeared first on the Bloomberg Terminal.
US natural gas and corn have dropped to break-even costs around $2 per million BTUs and $4 a bushel, with implications for most commodities, notably crude oil. If WTI does what it has since the 2008 peak — get too cheap — a rough equivalent is around $40 a barrel. Plunging government bond yields in China and rising US unemployment may indicate the commodity pendulum isn’t done seeking a low-price cure. But sold-out managed money (hedge funds) offers near-term support.
Commodities are in a great reset, indicated by gold’s roughly 30% rise vs. a similar decline in the Bloomberg Commodity Spot Index since Russia invaded Ukraine. That the metal is beating equities may suggest deflationary domino risks from some reversion in the US stock market. It often takes a lag to Fed easing for commodities to bottom.
Reset inklings: Corn at $4, gas $2 and oil $40 vs. $3,000 gold
The process of commodities falling to break-even costs vs. gold rising with US unemployment and declining government bond yields in China may continue. A top force that could hasten these trends is a decline in the US stock market. Crude oil remains well above production costs in the largest producer — the US — and may follow natural gas and corn.
Commodity low-price cure could gain fuel from China
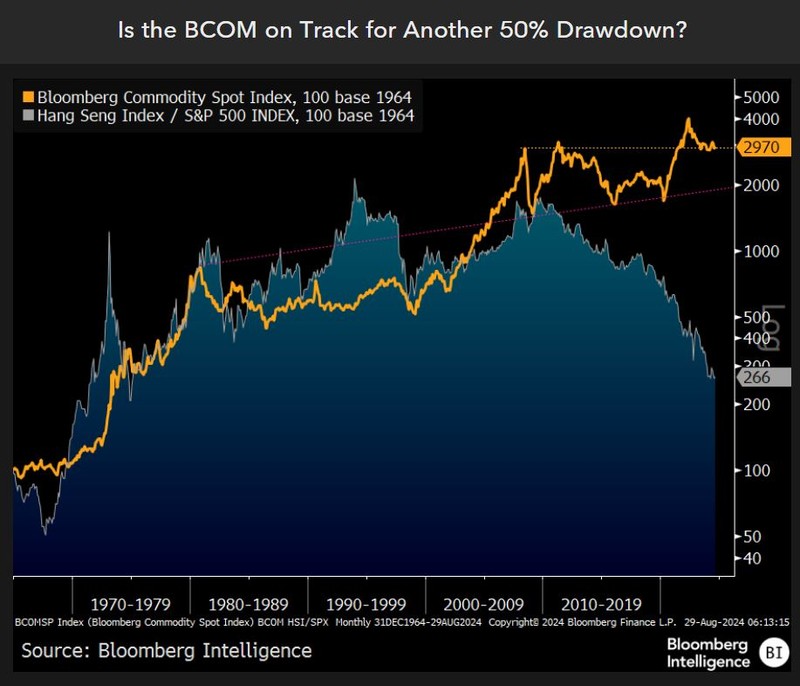
About another 30% decline in the Bloomberg Commodity Spot Index (BCOM) would be a normal drawdown from the 2022 apex and may gain traction in 2H. Our graphic shows a decline in a fundamental driver, China, as evidenced by the plunging Hang Seng Index (HSI) vs. the S&P 500 (SPX). On a similar track from a base of 100 in 1964 until about a decade ago, the HSI/SPX ratio at about 265 and BCOM closer to 3,000 on Aug. 29 could portend reversion risks. Reversion is emphasized as that’s how we see the commodity pendulum cycle at the end of August, and there may be little to stop about a 50% peak-to-trough decline akin to 2008-09 and 2011-16.
A prerequisite for BCOM stability likely starts with the US stock market staying resilient, which emphasizes deflationary domino risks from a bit of beta back-and-fill.
Diminishing disparity risks – BCOM/SPX, jobless
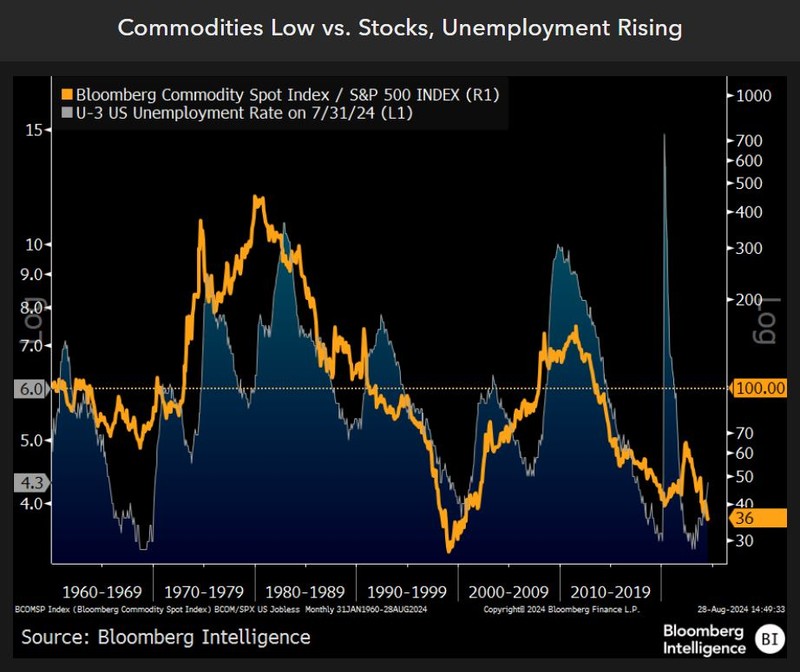
What may be disconcerting is the upside room in the US unemployment rate and commodities vs. stocks. The Bloomberg Commodity Spot Index (BCOM) at the end of August is at about a 25-year low vs. the S&P 500 (SPX), and the jobless rate has since 1948 always reverted to at least 6% from troughs akin to 2023. Or is the US stock market too expensive? Our graphic shows the BCOM/SPX ratio at 36 from a base of 100 in 1960 and its propensity to gravitate toward par, especially when the jobless rate is rising.
The need for US equities to lift all boats appears an inordinate burden, which may emphasize risks of a bit of reversion. The distortions of the pandemic, the biggest money pump in history and the “unlimited friendship” between the leaders of China and Russia are ample reason for the disparities, which may be diminishing.
Is deflation the next big trade?
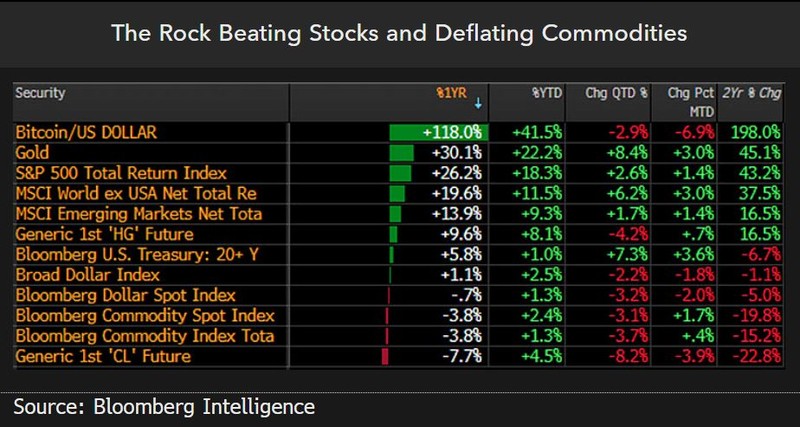
Gold near the top of our macroeconomic annual performance dashboard and beating the S&P 500 vs. commodities on the bottom may suggest the potential for deflationary dominoes due to a key factor: A potential drop in US stocks. We believe equities must keep rising, with the precious metal up about 30% and oil down almost 10% to Aug. 29. Commodity deflation is typical, on the back of price spikes to the 2022 highs, but it’s what fueled the pump that may be profound.
The leader of the largest commodity importer, China’s President Xi Jinping, nurturing relationships with Russia, Iran and North Korea could have shifted the world order, with tailwinds for gold. If US stocks fall with a recession that’s gaining traction, the next big trade may be deflation worthy of the recent inflation anomaly.
Commodity elasticity may be stronger than ever
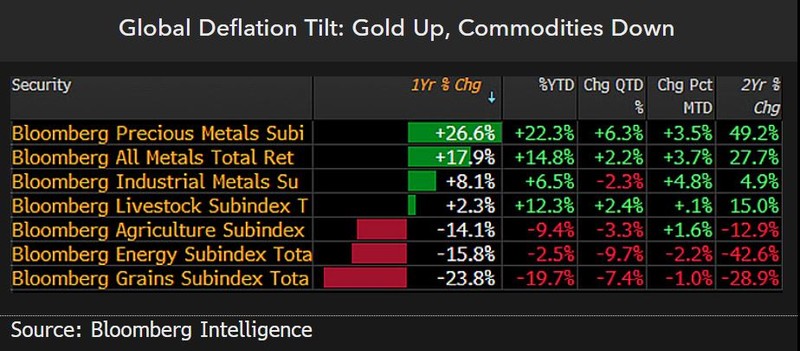
A takeaway from our commodity sector annual performance scorecard showing precious metals on top and grains on the bottom may be deflation worthy of the inflation to the 2022 highs. Grains are declining due to a key reason: Prices went up too much and incentivized plenty of supply vs. demand. It’s a question of carving out low-price cures, and the grains may be leading energy. Typical WTI crude oil lows since the 2008 peak have been around $40 a barrel. What stops that pendulum swing toward too cheap is a key question, and plunging government bond yields in primary importer China seem to support deflation leanings.
Rising gold appears on track with falling CGB yields and increasing US unemployment. Great reset leanings may come from some typical back-and-fill in the US stock market, which has been absent since the 4Q low.
Short at support may be commodity tailwind
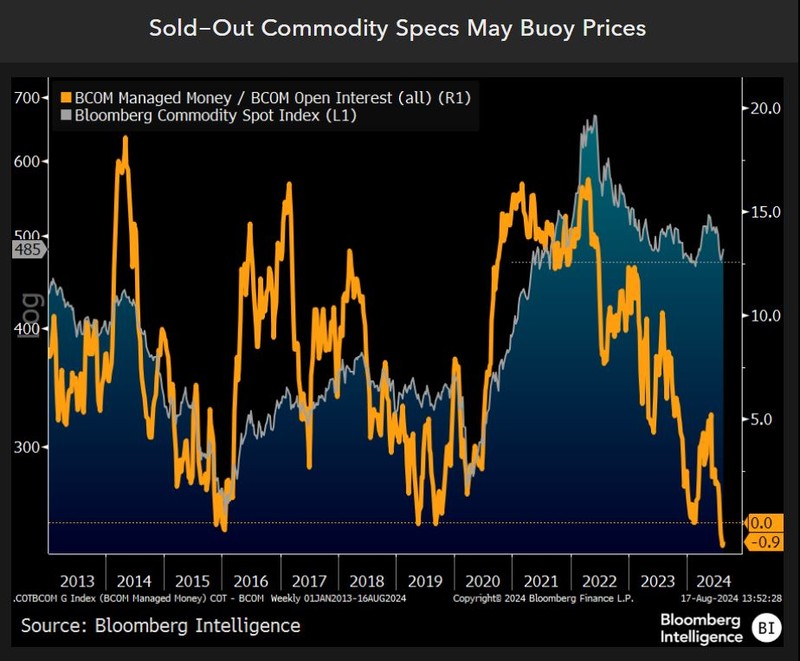
Commodity prices may be buttressed at least near term by being close to good support levels, with hedge funds short. At about 1% of open interest, speculators are the most net-short the 19 major constituents in the Bloomberg Commodity Index in 13 years of data. The BCOM at about 485 on Aug. 16 is down about 30% from the 2022 peak and has reverted to levels from 1H21, around the apex of the biggest money pump in history. Similar sold-out specs marked a BCOM low in 2016 but didn’t in 2019 as the index consolidated before plunging with the pandemic.
A leader in supply elasticity, the grains are also tops in short sellers, and absent a shock akin to Russia’s invasion of Ukraine, the Corn Belt faces bumper-crop-related price headwinds. Key support levels from 1H21 are about $60 a barrel in WTI crude and $4 a pound in copper.
