This analysis is by Bloomberg Intelligence Director of Equity Strategy, Chief Equity Strategist Gina Martin Adams and Equity Strategist Michael Casper. It appeared first on the Bloomberg Terminal.
Presuming U.S. growth prospects are unchanged, but stubborn inflation forces the Fed to tighten the monetary belt, stocks still have 6% fundamental upside, our fair-value model shows. Technicals are weak, but the equal-weighted P/E in the index is below its pre-pandemic average, and excluding the largest five stocks, the S&P 500 trades at 17.2x.
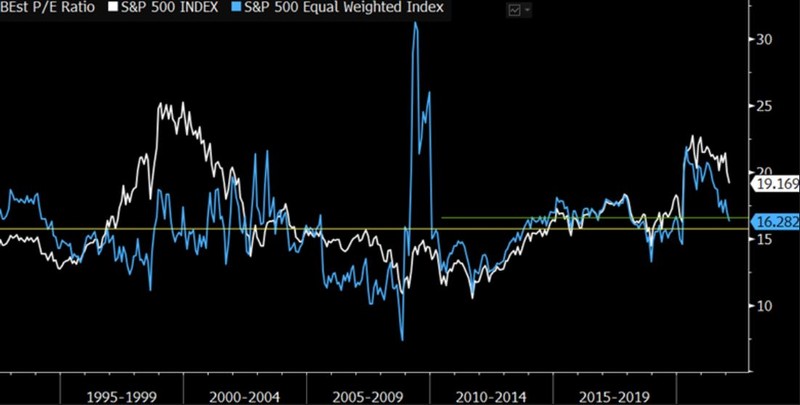
Equal-weighted P/E below pre-pandemic average
The correction has large-cap stocks suddenly looking cheap. While expensive outliers are keeping the large-cap index multiple elevated compared with longer-term averages, the S&P 500 equal-weighted index trades at just 16.3x forward EPS, below the pre-pandemic five-year average of 16.6x and near its 30-year average (excluding the 2008-09 recession) of 15.5x. Stocks have been de-rating for more than a year and a half, though the market cap-weighted index P/E decline has been shallow by comparison to the equal-weighted decrease. The S&P 500 P/E is 19.2x, down 15% from its August 2020 peak of 22.7x, while the equal-weighted forward multiple is down more than 25% from nearly 22x at its peak in spring 2020.
The long-term average equal-weighted index PE is 15.7x, excluding all recessions.
S&P 500 Index P/E

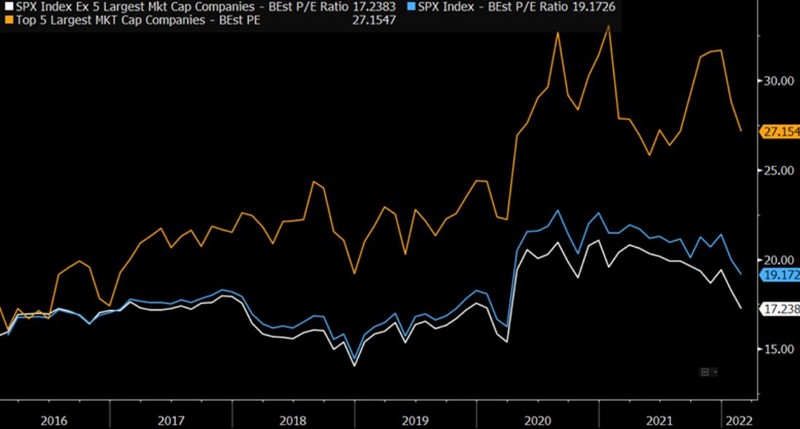
Excluding five biggest improves valuation view
The valuation gap between U.S. mega-cap names and the rest of the index has contracted over the past several months but is still wider than it was for much of 2021. The top-five market-cap names in the S&P 500 (Tesla, Apple, Microsoft, Google and Amazon.com) trade at a market cap-weighted 27.2x to forward EPS, down 17.9% from the group’s late 2020 peak; the S&P 500 price-earnings ratio is 18.1% lower. As a result, the gap between the two has shrunk to 9.9 turns from 13.5. Still, on a median basis, the Fab Five trade at a 52.6% premium to other S&P 500 equities. This is well above the pre-pandemic average premium of 18.5%.
Among the Fab Five, Amazon trades at the most discounted premium to its own average as ranked by forward P/E, while Apple is the most expensive relative to its five-year mean.
S&P 500 Index, with and without Fab 5

Model suggests market is about 6% undervalued
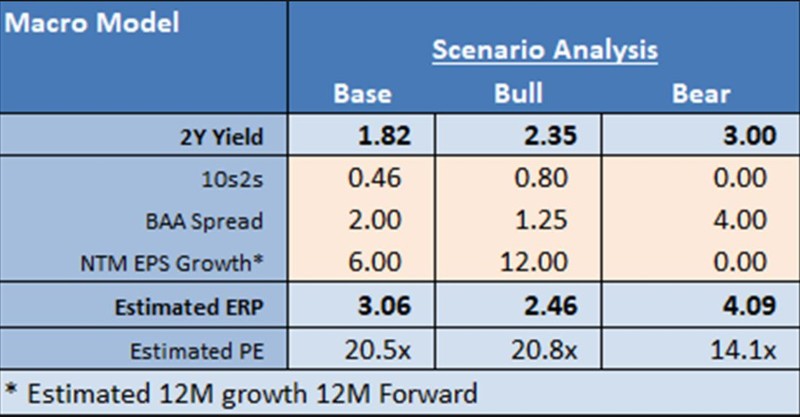
Our modeled scenarios imply the P/E ratio isn’t yet pricing in recession but is nearly 6% below fair value. Our base case for the multiple aligns with the interest-rate consensus and assumes rates rise as the Fed combats inflation, with a slightly wider yield curve and stable corporate credit spreads in the year ahead, as earnings growth stays moderate in 2023. These factors suggest the S&P 500 is fairly valued at 20.5x P/E in 12 months, above the current forward multiple of 19.2x but about one turn below the current trailing measure of 21.5x.
Our bullish scenario, where growth remains robust as the Fed normalizes, suggests multiples around 20.8x. Conversely, if the long end of the yield curve starts to sink, perhaps as the result of decaying growth prospects, multiples could drop to 14.1x.
BI’s S&P 500 valuation scenarios
