Trading in the eye of the storm: Quantifying the impact of cyclones on equity returns of manufacturers
Leading up to major storms of any kind – snow storms, tropical storms, hurricanes – there is heightened reporting in the news and people do their best to prepare for the possibility of power outages, travel difficulties, and days of clean up. But how do severe storms affect businesses, especially manufacturers and their suppliers? Further, assuming there can be dramatic short-term effects on operations and supply chains, how do such disruptions influence the stock prices of affected firms?
In the white paper “Quantifying the Equity Impact of Cyclones on Manufacturers,” Bloomberg’s Quant Research and Maps Engineering teams examine how a cyclone’s forecasted landfall can impact U.S. companies and their suppliers, both before and after a storm. For comparison, they also study the performance of Japanese stocks, which have been particularly impacted by a number of mega-storms over the past two years.
Storm tracking and forecasting
Extreme weather events are well-documented these days, with careful tracking by expert organizations like NOAA and widespread reporting in the news. In order to construct a profile of a given storm, key elements include the track points, which identify the eye of the storm and show its position as covered publicly by the mainstream news media; the so-called “storm quads,” which encompass the wind speed and radius in each quadrant of the storm; and the storm swaths, which describe the geometries of the storm in relation to areas of excessive wind speed. This data is viewed against the forecast history of a cyclone, which also looks at points, quads, and swaths, as well as forecast cones. These cones depict the future path of the storm laid out via the forecast points, with a degree of uncertainty (one standard deviation, or 68%). For the analysis of the impact on factories, this uncertainty is important since even a reasonably accurate impression of the storm track through the forecast cone does not provide information about the wind velocity to be expected at a future location. In essence, we may have a reasonably good idea of where the storm is headed, but we do not have deep insight into how bad it will be when it arrives.
Factory impact
The research evaluates over 162,000 factories and the filings of over 8,500 companies globally. The regions represented as a whole are North America and Europe, and individual countries are the U.S., China, South Korea, and Japan. Broken out by type, the factory facilities include Admin, R&D, Distribution & Logistics, and Manufacturing locations. Due to the global nature of these enterprises, the companies are not necessarily all traded in the U.S., but some could be traded on foreign exchanges. For this analysis, the focus is on firms that do trade in the United States.
The team evaluated the impact on factories through the lens of wind speed, with thresholds of 34 kts, 50 kts, and 64 kts. Across all regions, Japan is the country most impacted by such storms, with the most factory casualties in the dataset at each wind threshold.
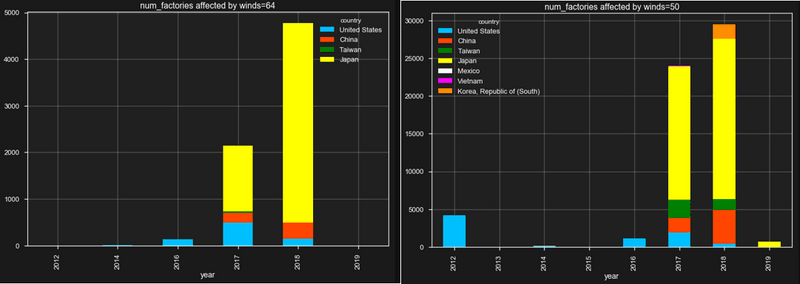
Number of factories globally affected by winds above 64kts (left) and 50kts (right) each year. The large increase over 2017 and 2018 is mainly due to a recent surge of mega storms in Japan (yellow).
Stock price impact
Looking at spread-to-market price evolution 10 days before and 10 days after the landfall of the storm, companies that are highly exposed to a storm do tend to outperform the market over time horizons of about a week after the event. In Japan, the effect has been present since 2012, over short holding periods. As a possible trading strategy, the team calculated the PnL from taking a unit-value spread to the Nikkei position in each stock likely to be affected, with various holding periods. This was, in fact, profitable prior to 2017, when buying the spread to market of Japanese stocks with less than 50% factory exposure at the time of the storm impact. However, since mega-storms gathered destructive momentum in 2017 and 2018, all of the gains were eradicated. In the United States, the strategy has enjoyed some profitability in recent years, but only for holding periods of about one week. Over shorter periods of time, e.g. less than 2 days, the gains were insignificant.
Download the white paper to learn more about storm forecasts and stock price impacts.