This was written by Mihai Stefanita, Constantin Cosereanu and Steven Ioannou. It first appeared on the Bloomberg Terminal.
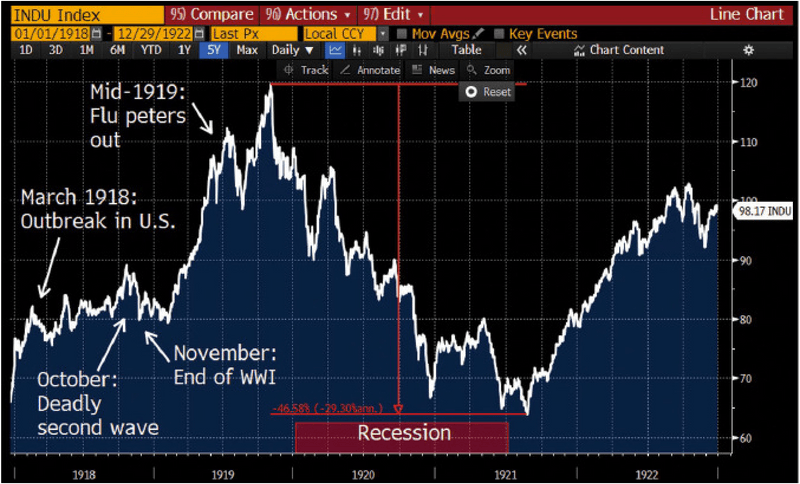
How did stocks perform as the Spanish flu ran its course a century ago? At the beginning of 1918, the Dow Jones Industrial Average stood at 76. Although the pandemic emerged in the early months of the year and World War I raged in Europe, the benchmark rose 17% to a high in October. The end of the war was nearing that month, but it was also when the virus’s lethal second wave crested.
In the current environment, many firms are building historical or hypothetical scenarios to get insight into how to position their portfolios. The Portfolio & Risk Analytics (PORT) function enables you to conduct deep analysis of a portfolio’s performance under different stress scenarios and then share your analysis across your firm or with other sets of users.
You can use PORT, for example, to build a custom scenario based on how markets behaved in the era of the Spanish flu and use that to stress-test your portfolio. Here’s how.
To start, let’s take a look at the Dow back then. To chart the index over the five years from the beginning of 1918, run {INDU Index GP GO}, set the date fields at 01/01/1918 – 12/29/1922, and press. After declining some 10% from October 1918 to February 1919, the market took off, with the index rising 50% to a high in November 1919. That was when the big drop started, however: From that point until September 1921, the Dow fell 47%.

That can be a starting point for building your scenario. The Spanish flu era and this one are not exact analogues, of course. For one thing, there’s no world war going on now. What’s more, with today’s scientific understanding of viruses, modern technology, and advances in health care, you might expect the market impact of COVID-19 to be less severe. So perhaps create a custom scenario with a market downturn of, say, 35%.
To do that, run {PORT GO} and load your portfolio. Click on the Scenarios tab and then the Main View subtab. To create your custom scenario, click the drop-down menu to the right of Scen and select [Edit / Create New …]. In the View Manager screen, click the gray Create New button, and the Scenario Manager screen will appear. Give your scenario a name such as Spanish Influenza (-35%). Click the MacroFactor tab and then Indices to expand the list. Use the scroll bar to go down in the list to DOW equity (INDU Index). Click on it to select it, and then click the >> button so it appears in the Risk Factors column. Then type “-35” in the % change field. That’s it. Click the Actions button and select Save.
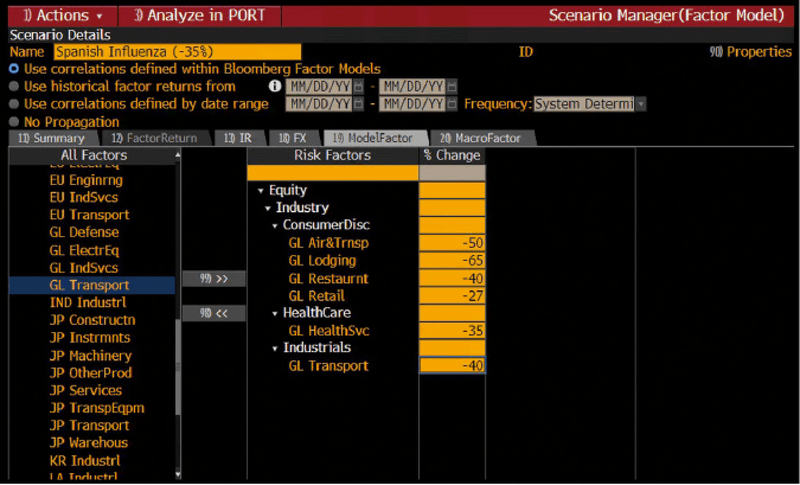
The Scenario Manager also lets you create more targeted scenarios. You can shock specific countries, industries, or style factors within the models. To do that, click on the ModelFactor tab. You could, for example, create different shocks for specific sectors such as global air and transportation and global lodging.

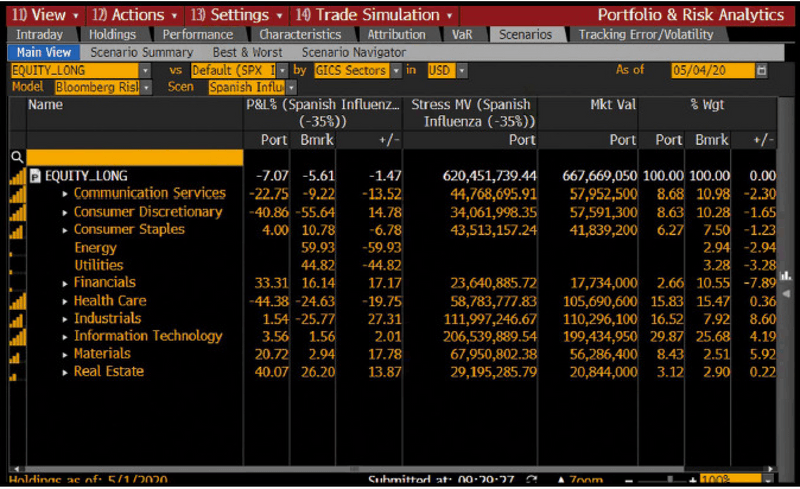
Once you’ve created and saved a scenario, press Menu to return to the View Manager screen. The scenario you created will be listed in the Available Scenarios section under My Custom Scenarios. Click the plus icon to add it to Selected Scenarios. Then click the Run button on the red toolbar to run your custom scenario on your portfolio and benchmark. The Scenario tab in PORT will display the results given the shock in the Dow macro factor and the other industry model factors.
