Dig deeper into clean-energy ETFs: BI Green & Taxonomy model
This analysis is by Bloomberg Intelligence Director of ESG Research EMEA & APAC Adeline Diab and Associate Analyst Nick Scanscartier. It appeared first on the Bloomberg Terminal.
We are often asked, “Just how green are clean-energy ETFs?” Based on our new model, the most diverse of the biggest such funds are indeed green — demonstrating rapid decarbonization, appear best aligned with the EU taxonomy and generate strong performance while showing lower EV/Ebitda. That’s an attractive profile as the European Union deploys 200 billion euros for green-energy stimulus to address energy security and climate concerns amid the Russia-Ukraine conflict.
Not all clean-energy ETFs are equally green, and that’s the challenge. In this report, we leverage our newly launched BI Green & Taxonomy Scoring model to help investors understand the green credentials of clean-energy ETFs and make better informed investment decisions.
How to pick a clean-energy ETF: BI Green & Taxonomy model
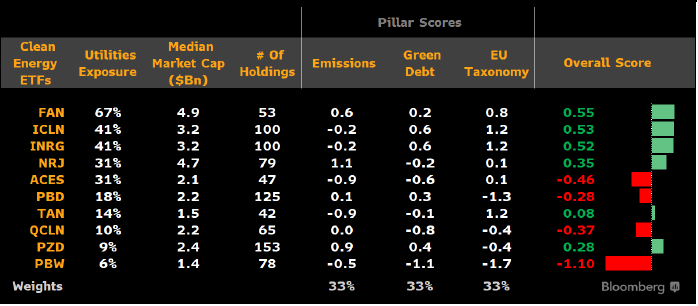
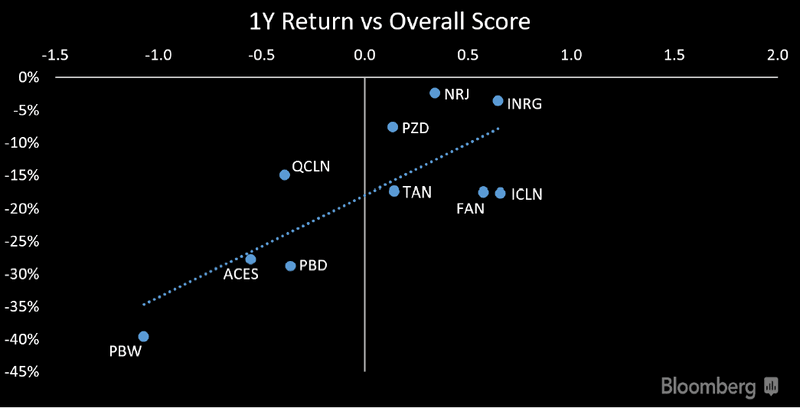
The most-diverse iShares Global Clean Energy (ICLN and INRG), plus the more-focused First Trust Global Wind Energy (FAN) and Invesco Solar (TAN), lead the top 10 clean-energy ETFs, based on our BI Green & Taxonomy model. Our analysis also reveals a strong correlation between fund returns and the overall score derived from the newly launched model — highlighting growing market recognition and performance potential. The best-ranked funds not only display a lower volatility bias relative to peers that’s helping them weather markets but also hold the most companies with lower EV/Ebitda, pointing to attractive valuations.
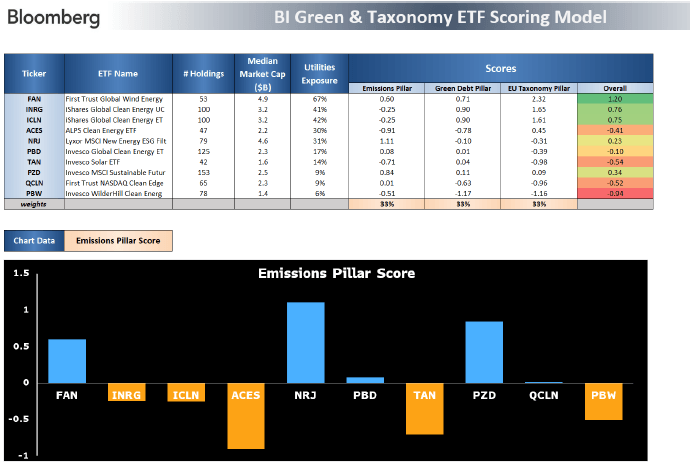
Methodology: BI Green & Taxonomy Scoring model leverages Bloomberg’s environmental, debt, regulatory and financial data to examine fund holdings from three different lenses: emissions, green debt and EU taxonomy alignment.
Introducing the BI Green & EU Taxonomy scoring model
Determining a clean-energy ETF’s green and EU taxonomy alignment exposure will likely become an important element of analysis, given concerns about elevated regulatory scrutiny, energy transition and greenwashing. The European Union is driving this agenda but the SEC’s recent move to standardize climate-related disclosure for investors is another strong signal. Examining clean-energy fund holdings to determine their emissions, green debt and EU taxonomy alignment characteristics, as in our scorecard, help address such analysis and guide investors.
We leverage Bloomberg data to shed light on the ESG exposure of funds. Our model enables users to compare clean-energy ETFs’ emissions risk exposure, green debt profile as well as EU taxonomy alignment by assessing holdings and then aggregating them to the fund level.
BI Green & Taxonomy Model: A case for clean energy

A look under the hoods of clean-energy ETFs: Our model’s scoring
Clean-energy ETFs are not all created equal from a green and EU taxonomy-alignment perspective, resulting in different levels of risk and attractiveness. ICLN and INRG lead their peers on both the green debt and EU taxonomy pillars of our scorecard. Although their emissions pillar scores are weaker in relative terms, we believe that should improve as the funds include energy-transition stocks. FAN and TAN are also among the scorecard leaders, indicating a high level of green and EU taxonomy alignment.
The clean-energy ETFs that trail — Invesco Wilderhill Clean Energy (PBW), First Trust Nasdaq Clean Edge Green Energy (QCLN) and Invesco Global Clean Energy (PBD) — exhibit varying characteristics such as low utilities exposure or small-cap bias. They warrant further scrutiny depending on an investor’s goal.
BI Green & Taxonomy Model: Overall score

Have your cake and eat it too with greener ETFs
Across the 10 big clean-energy ETFs, our analysis reveals a strong correlation between the results of our scoring model and fund performance. Correlations between the funds’ scores against one-year fund returns were 0.8. There was also a moderate inverse relationship between our score and volatility, indicating steadier returns for the best-tallying funds over the past year. The funds that received positive scores — namely Lyxor MSCI New Energy ESG (NRJ), Invesco MSCI Sustainable Future (PZD), ICLN, INRG and FAN — were not only the best-performing funds but also had holdings with the lowest average EV/Ebitda.
All of this suggests that the top-performing funds may continue to outperform on all fronts and may reflect that investors have begun to catch wind of the fundamental green characteristics captured in our model.
BI Green & Taxonomy score vs. 1-year return
