This was written by Bloomberg Intelligence economist David Qu. It first appeared on the Bloomberg Terminal.
China’s consumer price index is a bit of a black box. In this note, we pry it open to shed more light on inflation trends. One thing that’s evident – food is significant, but much less so than a few years ago. And services appear to carry significant weight.
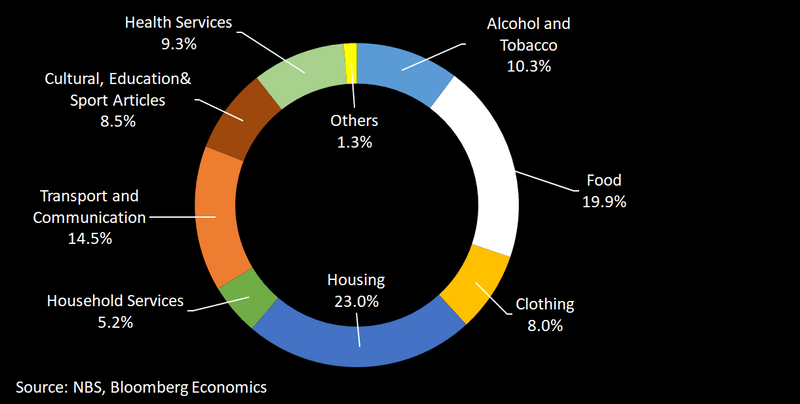
The National Bureau of Statistics has disclosed that the CPI basket consists of eight categories but it hasn’t revealed the weights. Using the contributions of each category to the headline CPI disclosed in the monthly data, though, it’s possible to arrive at fairly reliable estimates:
- The CPI basket has consisted of eight categories since 2016 — food, alcohol and tobacco; clothing; housing; household service maintenance and renovation; transport and communication; cultural educational & sports articles; health services; and other, according to the NBS.
- According to our estimates, the category of “food, alcohol and tobacco” accounts for about 30.2% of the basket, the highest share. More specifically, food accounts for around 19.9% — much lower than
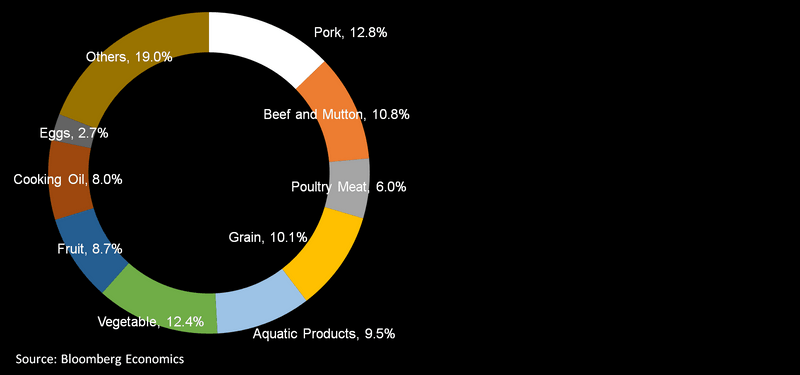
around 30% in 2015. - In the food component, pork has the highest weight, followed by vegetables. The former accounts for slightly more than 2.5%, and the latter slightly less than 2.5% of the CPI basket.
- Items covered in core CPI account for 77-78% of the headline CPI, while energy carries a weight of just 2-3%.
- Another dimension is to divide the CPI basket into goods and services. We estimate goods have a weight of 63%, and services a weight of 37%.
These contributions can help inform our view on the inflation outlook. The weight of food has declined, but it still warrants close watching. Food inflation picked up to 7.7% year on year in May from 6.1% in April, lifted by rising fruit, vegetable and pork prices. These gains, though, are due to a supply shock – which won’t last. For that reason, we don’t think the current food-driven rise in inflation would stand in the way of easing monetary policy if the economy needs it.
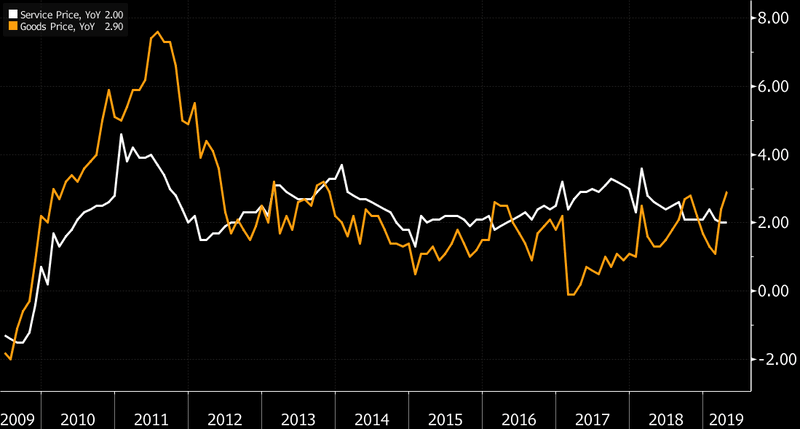
Changing household consumption patterns – with a shift toward services and away from goods – may have more persistent effects on inflation trends. Service prices have been showing relatively strong momentum since 2014, in contrast to sluggish inflation in prices of non-food consumer goods.
A look at China’s CPI basket – food dominates
The NBS overhauls the CPI basket every five years, most recently in 2016. It may also tweak the weights of the components every year. We used data back to only January 2018 to try to get the most accurate estimates of the current weights.
Estimated weights of categories in CPI basket

Weight of food has declined in CPI basket
The weight of food in the CPI basket appears to have declined significantly. Before 2016, it was believed to be around 30%, about 10 percentage points higher than our estimate of 19.9% currently. Among food groups, pork accounts for the highest share in the food basket, at around 12.8%. This translates into a weight of around 2.5% in the headline CPI, less than an estimated 3% before 2016.
Weights in the ‘food’ group

Headline versus core CPIs
It is tough to estimate the weight of the core CPI in the headline index, as the NBS seldom releases the contribution of changes in energy prices to changes headline inflation. To get around this, we use the price of 92# gasoline as a proxy for energy prices. Based on this method, we estimate that the core CPI (excluding food and energy) accounts for 77-78% of the headline CPI, while energy accounts for a mere 2-3%.
Goods versus service price inflation
Service prices have been a supportive factor for the headline CPI in recent years. We estimate that services account for 37% of the CPI basket, with consumption goods (including food) accounting for the remainder. Since 2014, prices of services have have been rising at a pace faster than those of goods most of the time, supporting the headline CPI.
China CPI, services versus goods
