Economic nowcasting: Managing multiple complex datasets for better investment decisions
Bloomberg Professional Services
Buy-side company research analysts have unprecedented access to large, complex datasets. And they also face challenges in managing all that data to evaluate investment strategies and understand potential returns.
Quantitative research is transforming the investment landscape. Accessing large and complex datasets – along with advanced compute infrastructure and tooling – is becoming a necessity for any data-driven investment professional. Bloomberg has developed BQuant Enterprise, a cloud-based analytics platform specifically designed for quantitative analysts and data scientists in the financial markets.
The platform provides broad access to Bloomberg’s financial datasets and services within a sandbox environment, scalable compute resources, and a modern developer ecosystem, enabling efficient execution of data and time-intensive projects.
How much data are we talking about?
Financial market players need to monitor real-time economic conditions to understand how they impact the market environment, fund flows, and investment opportunities. Economic nowcasting, the process of predicting the very recent past, present, and very near-future state of the economy, can help with this. But how can we nowcast when key economic indicators are published with significant lags?
One way is to use real-time financial market data as a gauge for assessing underlying economic activity. In a 2020 paper titled “Nowcasting business cycle turning points with stock networks and machine learning,” the European Central Bank showed how this can be done.
The paper highlights the importance of granularity and the impact of economy-wide return interconnections. For example, when consumer and business spending weaken in some parts of the economy, corporate earnings start to decline, prompting cost-cutting measures.
The authors analyzed “Granger causal” relationships among S&P 500 members to identify which firms influence each other’s returns. They then trained multiple machine learning models using these findings to assess the current state of the US economy by predicting connections between US GDP growth and daily S&P 500 member stock prices.

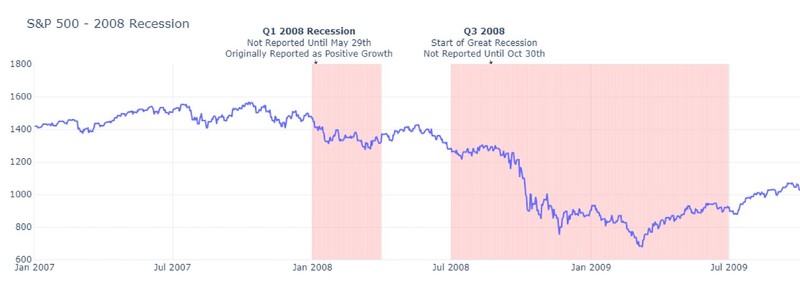
The pink shade in the above chart means the recession cycle or “bad period.” In this case, the 2007-2008 financial crisis.
Nowcasting in a BQuant workflow

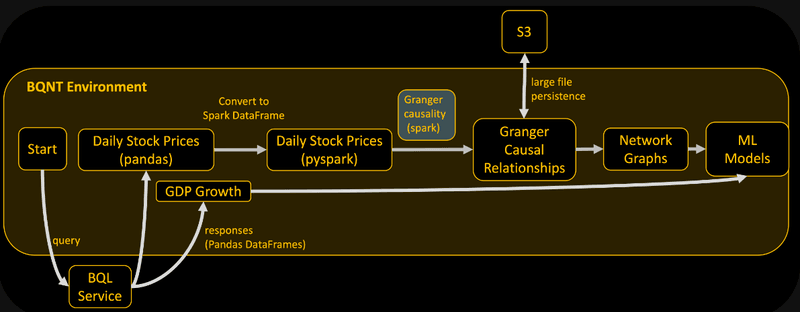
A typical BQuant workflow starts by querying data from BQL services to pandas dataframe, and then converts pandas dataframe into Spark dataframe for Spark speed-up calculation usage.
In BQuant Enterprise, we have the (i) data, (ii) the compute resources (CPU/ GPU/ Memory), (iii) Jupyter Notebook as the IDE.
To use stock market data to identify economic regime changes, we first pull quarterly GDP data and daily stock returns data for the past 40 years. This is a lot of data, but the BQuant Enterprise environment can easily handle it.
Then, to efficiently process the “Granger causal” relationship calculation for each ticker pair at each time point, we can use a native Spark service, leveraging parallel processing. Once “Granger causal” relationship is computed, the results can then be saved in the dedicated S3 bucket provided to each BQuant Enterprise clients. These pre-calculated and cached results can then be called in future requests.
We then perform a large set of “Granger causal” tests to the dataframe to examine the inner causalities, and save the resulting files into an AWS S3 bucket. Then visualizing everything into network graphs and apply machine learning models to do the final analysis.

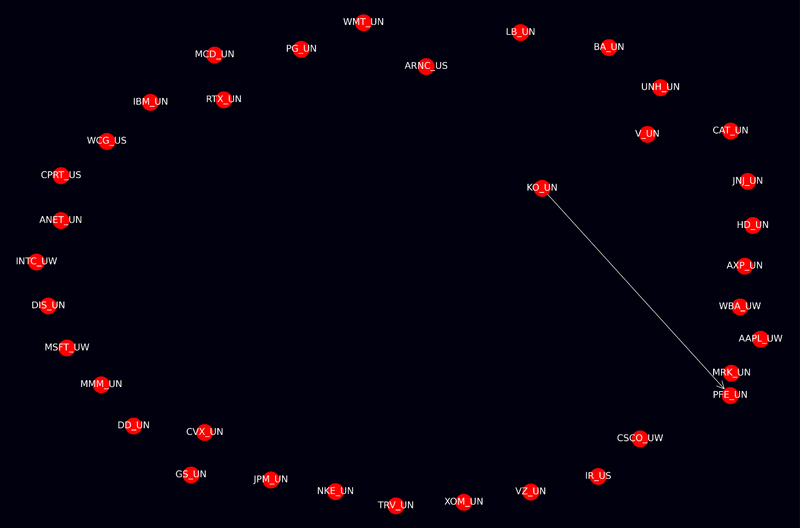
The above network graph depicts the “Granger causal” results as a ball connected to another ball via arrows connecting reason to the outcome. Because the dataset is large, the graph is quite dense. It will be much clearer visually if there are only two or three points.
As the final step, three supervised learning models (Support Vector Machine, Logistic Regression, and Naïve Bayes) are trained and used to create “binary (positive/ negative)”, and “3-class (high-growth/ low growth/ recession) versions of the forecast.
Real time forecast, negative growth, three methods

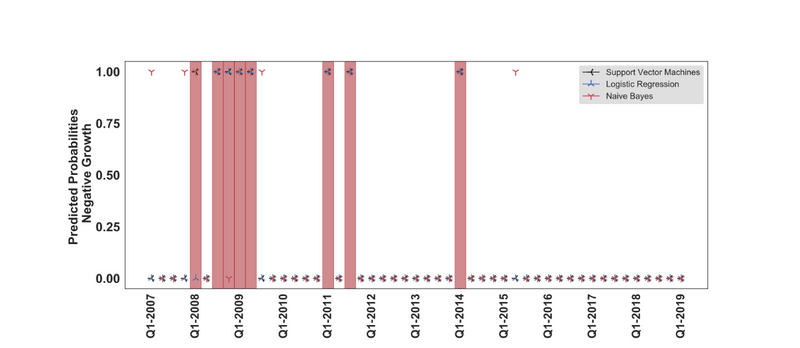
We use 3 different types of classifiers to output the YES/NO for a negative growth prediction.
It’s like a voting system. If all of the models agree the economy will go well, we can have more confidence in our predictions. Here, in the pink recession seasons, lots of our results output negative growth. For the white areas, the models usually gave “there would not be negative growth,” which means our models are relatively accurate.
If you’re interested in testing these results for yourself, please request a demo.