Factor data & backtesting rise as AI transforms credit investing
Bloomberg Professional Services
Beyond the artificial intelligence (AI) stock frenzy, credit investors are adapting to AI and integrating growing volumes of financial factor data into their research.
Very soon, AI systems will learn how to mimic and, in many aspects, co-exist with and even surpass humans in their finesse of approaching both public and private financial markets. Strategy alpha will depend on who has the most innovative technology and makes the most effective use of it and associated financial data.
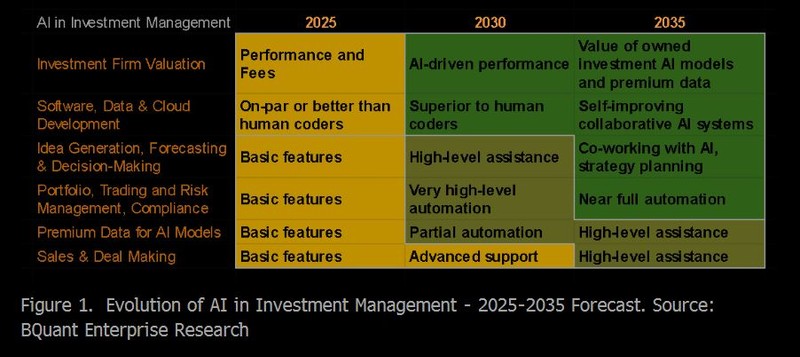
As part of this transformation, portfolio managers and analysts will become increasingly focused on the analysis of historical data to understand how to best present and explain the context of this data and their ideas to the prediction machines. Encapsulating these investing ideas in the systematic factor form will help build an effective communication bridge with the evolving software.
Accessing systematic credit factor data in Bloomberg’s BQuant Enterprise
To prepare for the next phase of AI-driven credit investing, we present a collection of demo factors for systematic research, a small fraction of the many that can be implemented and evaluated across credit universes on Bloomberg’s BQuant Enterprise platform. Historical data on these factors can help identify and analyze trading patterns and trends. We will group similar factors for brevity.
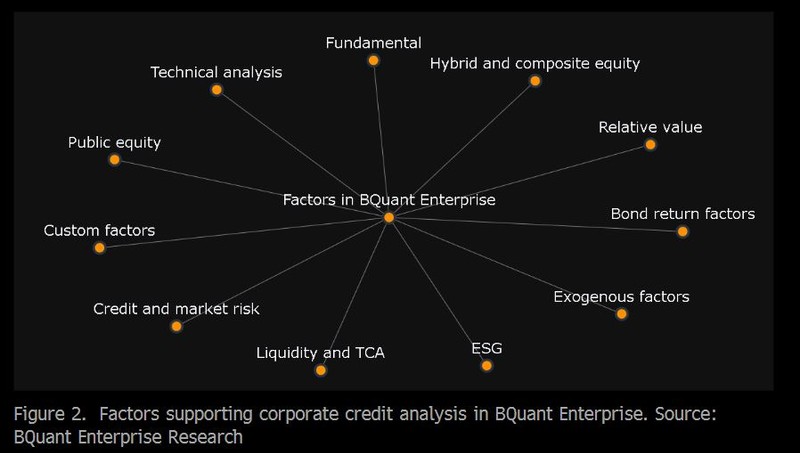
BQuant Enterprise’s API offers programmatic access to an ever-increasing number of financial metrics across many different asset classes, allowing for the creation of numerous formulaic credit, fixed income, and equity factors. This flexibility helps rapidly construct and test simple and highly sophisticated factor definitions for research workflows on the BQuant Enterprise platform. For instance:
- Custom factor scoring models and filters.
- Portfolio construction, clustering, optimization, and ML model development.
- Portfolio and security-level factor backtesting and signal strength evaluation.
- Custom risk measure/risk model development.
- Universe filtering.
Factor backtesting notebook study
The upcoming “BQuant Credit Factors” demo notebook will showcase a classic credit factor backtesting workflow, including customizable portfolio construction and backtesting Python code, and visual analytics. Please reach out to the BQuant team for more information. The notebook provides valuable examples of constructing and testing credit factors before adding those to more complex AI/ML models. This notebook aims to perform a quick check on the selected credit factors and evaluate their effectiveness on a particular filtered universe, further carved into a long-only or a long-short portfolio.
The simple workflow allows for a rapid learning curve and practical application as part of daily credit research. Only three steps are required:
- Preloading the historical universe data.
- Defining portfolio and backtest parameters.
- Selecting a credit factor (single or composite) to run a backtest on.
The backtest library outputs can be saved and aggregated to study the performance of multiple factors across different market regimes.
In the notebook, we first define a factor, such as Excess Spread to Peers = Security OAS – BClass3 Average OAS, and then run a highly customizable backtest on this factor. Finally, the notebook uses the backtesting outputs to generate portfolio analytics for the factors tested.
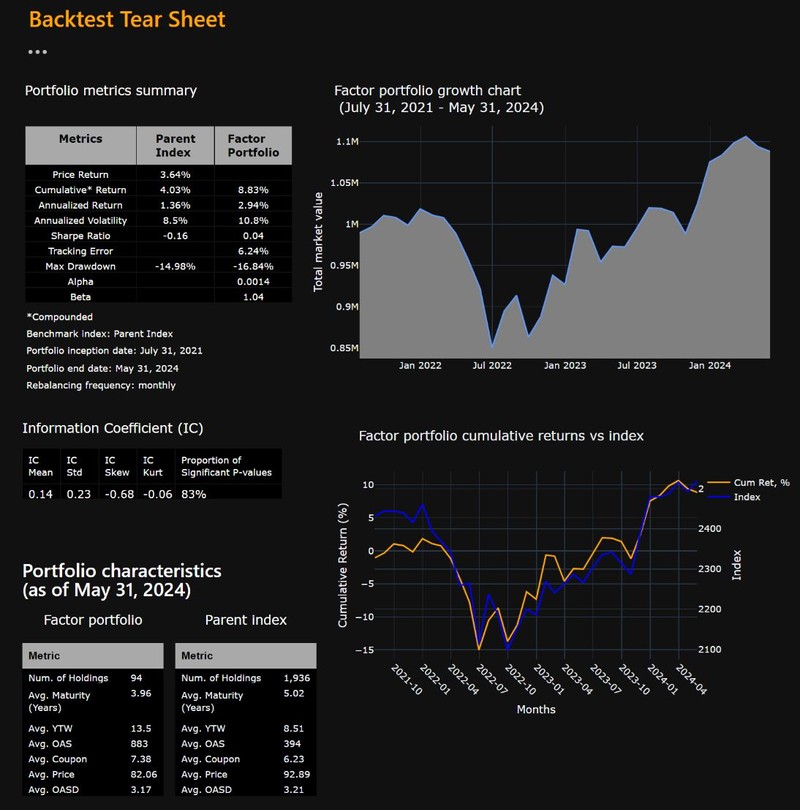
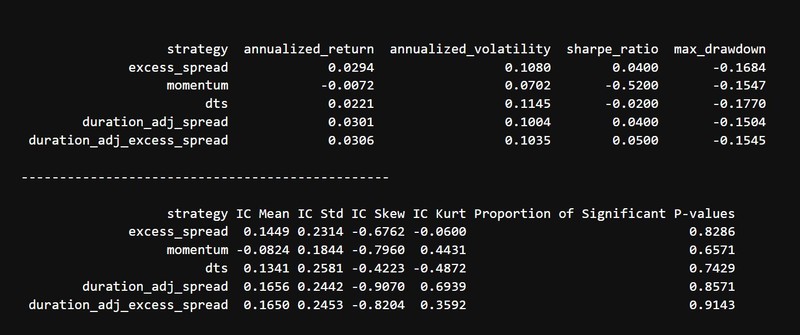
Four core reports can be extended further. The Backtest Tear Sheet report calculates the portfolio’s performance metrics, including Sharpe, Alpha, and Information Coefficient, and provides insights into the portfolio’s characteristics – averages of spread, duration, etc.
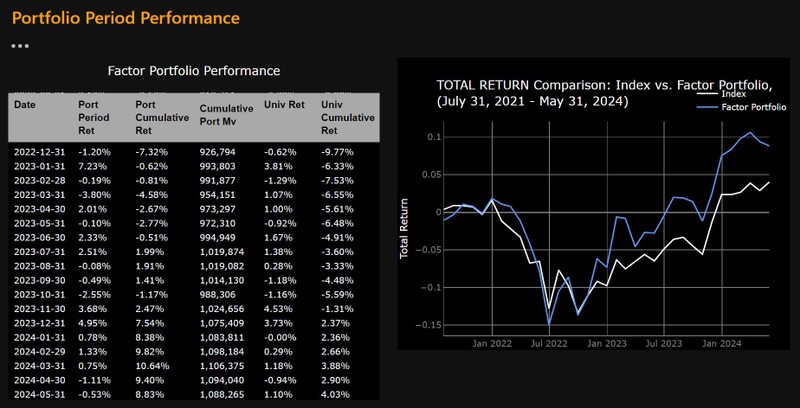
The Portfolio Period Performance report allows to review monthly performance data for the portfolio and selected benchmark:
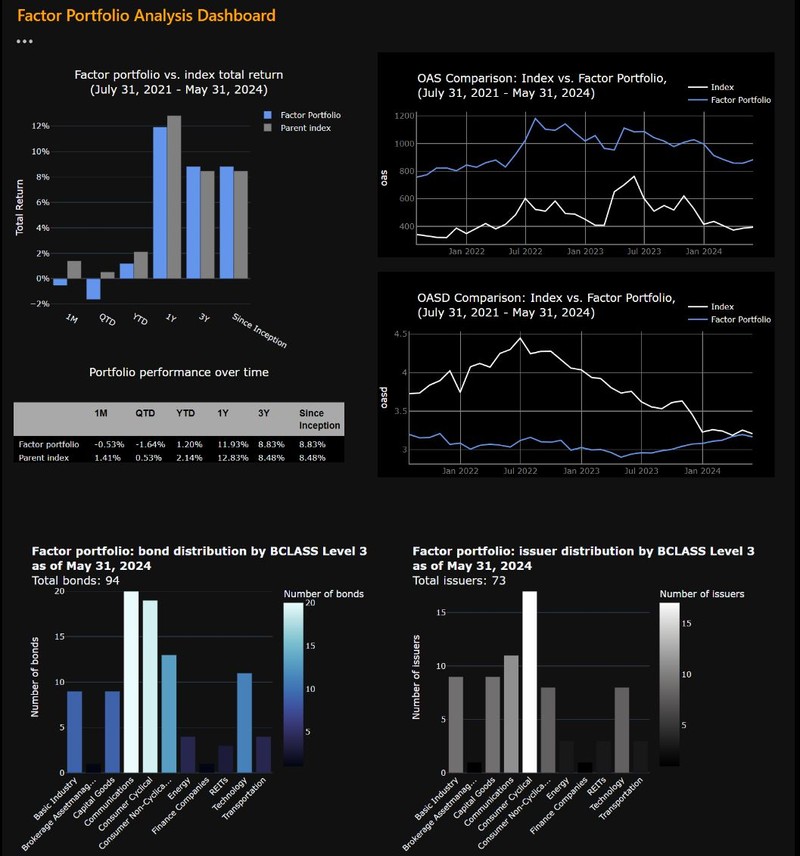
The Factor Portfolio Analysis Dashboard represents BCLASS3’s portfolio distribution at the bond and issuer levels and the portfolio’s OAS and OASD performance over time. The charts can be customized by selecting the appropriate bond and issuer features and descriptive measures.
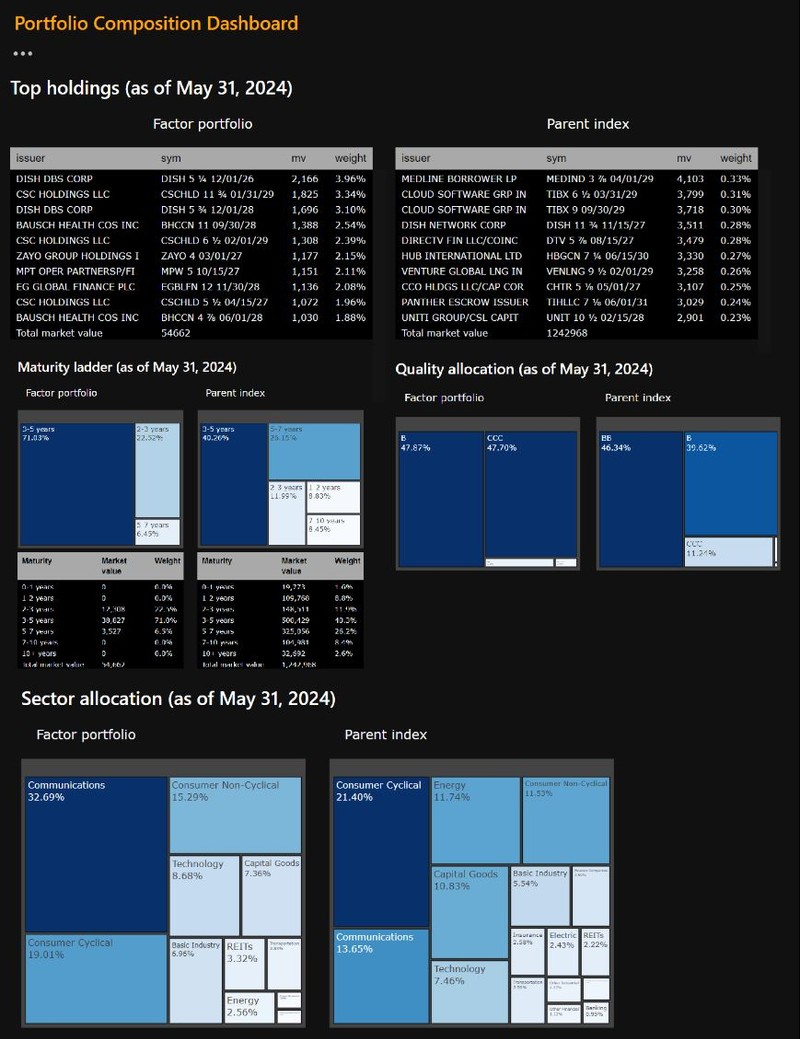
The Portfolio Decomposition Dashboard reports the portfolio’s top holdings and allocation information across credit rating groupings, sectors, and maturities.
Finally, the backtesting notebook can be used for testing multiple factors:
Researching factor performance under risk-on risk-off regimes
Despite the numerous challenges associated with backtesting (see Chapter 11, “The Dangers of Backtesting”, Advances in Financial Machine Learning, Marcos Lopez de Prado, 2018), it remains a valuable tool for scenario simulation using historical and artificially generated data. Often, market scenarios tend to repeat themselves under similar conditions. Armed with this knowledge, we can test various factors’ behavior. The scenario adjustment by filtering the universe, introducing additional financial data features, and shifting the backtest time frames will affect the backtest findings.
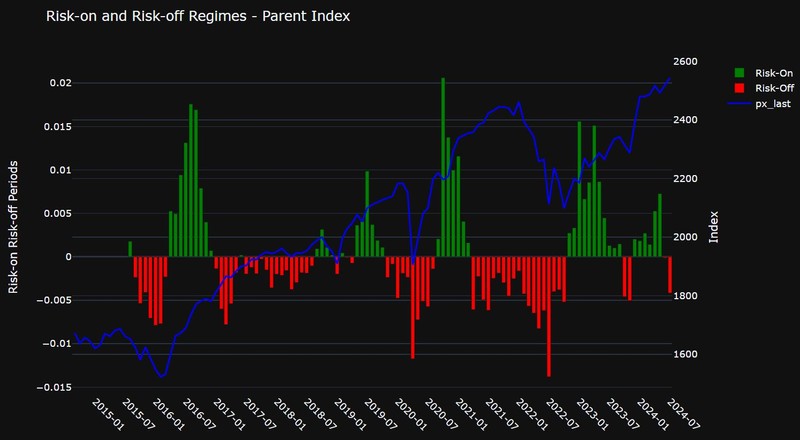
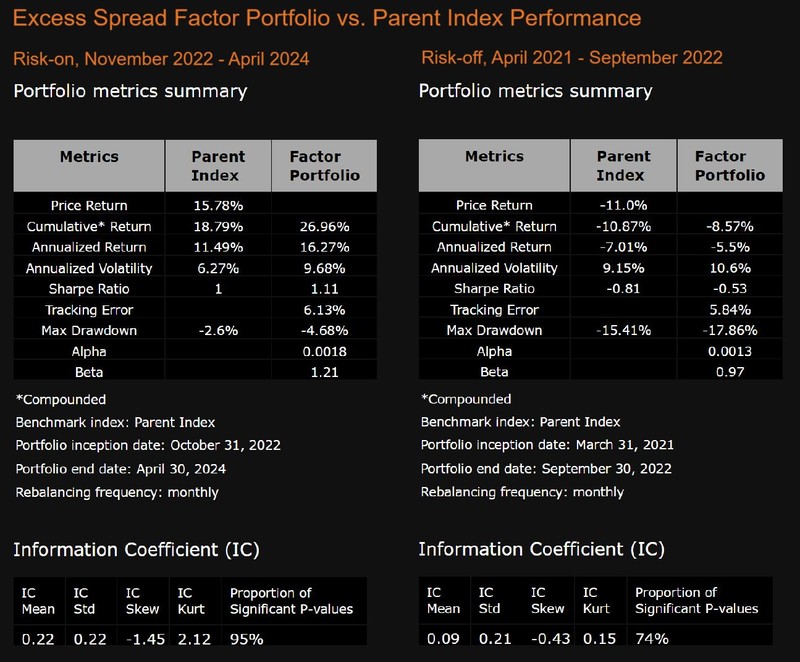
Let’s define an excess spread factor as (individual bond OAS – BCLASS3 average OAS) / standard deviation of all OAS values. Let’s use the resulting z-score as a sorting factor to create a long-only quantile portfolio based on the LF98TRUU Index, filtered for OAS < 1500 and OASD between 2 and 4 years. The portfolio will sample 10% of the LF98TRUU securities.
We can then evaluate this factor’s performance during the recent risk-on period of November 2022 – April 2024 and the risk-off period of March 2021 – September 2022. The Excess Spread factor portfolio outperforms its parent index in these periods. Please see Figure 9. The DTS and Momentum factor portfolios have also outperformed the parent index in both regimes.
Takeaway
Building highly sophisticated and profitable ML predictive models works when the models can learn from high-quality historical data used to design factors and other valuable inputs. In this regard, performing simple factor backtests is a prerequisite for building more expensive and time-consuming models.