Bloomberg Professional Services
This article was written by Jigna Gibb, Head of Commodities and Crypto Product Management at Bloomberg, with contributions from Yeonje Jo, Dario Valocchi and Kartik Ghia.
The key macro headlines for 2024 have anchored around inflation and central bank activity; when will interest rate cuts take place and at what pace? These shifts in monetary policy across the globe would effectively pivot positioning with respect to the economic cycle. While Inflation has cooled recently, measures remain above target levels for many countries. In this article, we discuss the performance of commodities sectors via the Bloomberg Enhanced Roll Yield (BERY) across different macro-economic regimes. A long-only commodities investment is mostly considered in a strategic portfolio allocation for diversification and inflation-hedging. This piece shows why we see value across the commodities BERY sectors for tactical asset allocation in all scenarios.
The Bloomberg Commodities Index (BCOM) offers broad-based long-only benchmark exposure to commodities markets. The BERY index is a roll enhanced dynamically weighted strategy, which closely tracks BCOM, but also targets spot, curve, and carry components of returns. The returns sources for a commodities index can be attributed to components of spot, roll, and carry returns. The spot returns are market beta driven. Roll yield is harvested from the curve premium in futures contract selection. The carry premium is captured based on the shape of the commodities forward curve. BCOM and BERY are comprised of six sectors which are energy, grains, softs, industrial metals, precious metals, and livestock.
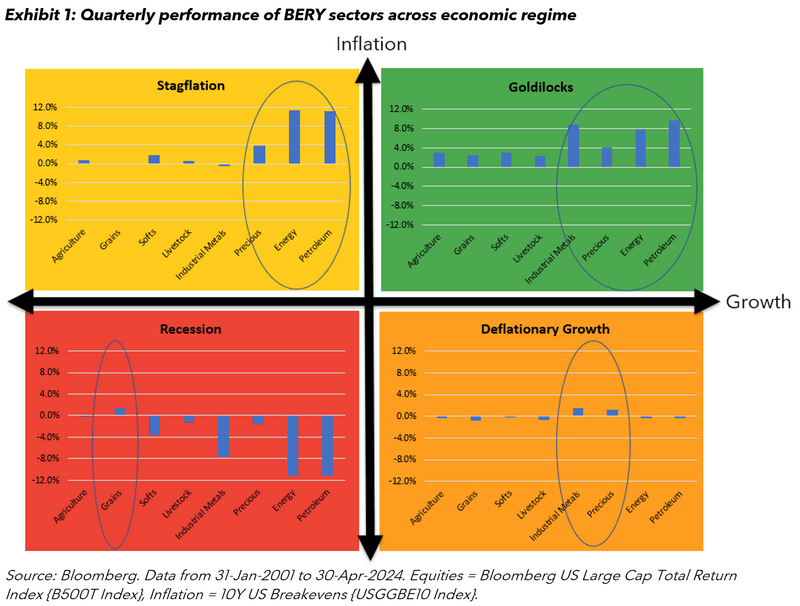
To conduct our macro-economic regime analysis, we use the traditional BERY sectors, plus agriculture and petroleum. In the quadrant chart in Exhibit 1, we highlight which BERY sectors have performed positively across growth and inflation periods. The bar charts show average 3-month returns non-overlapping of each BERY sector, where we have sliced history based on the direction of change of growth and inflation.

Over the 23-year period in which we have BERY sectors data, we have observed the greatest number of quarterly episodes in a goldilocks scenario at 36% when the change in both growth and inflation has been positive. Deflationary growth with positive changes in equities and lower Inflation is the second largest sample set with 29% of the observations. There have been 22% of periods where we have experienced recession and, unsurprisingly, stagflation period of high Inflation and negative growth has only featured 13% of the time.
In each of these economic regimes we find that different commodities BERY sectors have tended to shine.
In goldilocks scenarios, we see energy, industrial metals and precious sectors perform well; combined these sectors can be accessed by BERY ex agriculture and livestock sector.
For deflationary growth episodes both industrial and precious metals sector contribute positively; these are represented in the all-metals sub-index.
During stagflation, energy has been the primary positive performance driver followed by precious metals.
Finally, over a recession, all commodities sectors are down with the exception the grains.
In addition to the traditional sectors, Bloomberg has launched various composite sectors such as BERY ex agriculture and livestock, all metals and energy and precious metals to offer solutions for all environments.
Spot prices are the main drivers of performance, whereas carry is pro-cyclical in nature
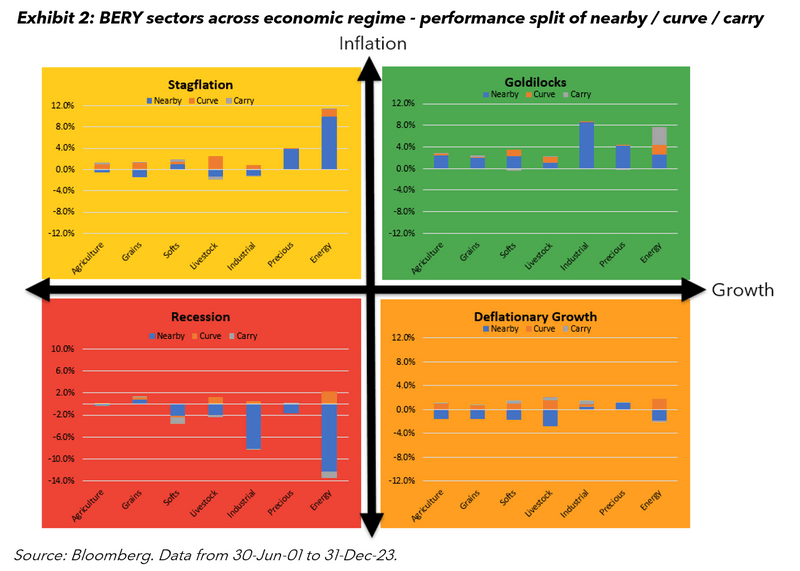
In Exhibit 2, we split out the average quarterly performance into nearby, curve and carry components of returns. We define “nearby” as the returns of the BCOM F0 sector indices which compose of spot plus nearby roll yield, “curve” premium as proxied by the difference between BCOM F3 and BCOM F0 sector indices and “carry” premium is measured by the difference between BERY and BCOM F3 sector indices.

Interestingly, in each of the regimes, nearby has been the primary driver of returns. For almost all the scenarios and sectors the curve premium has been positive. During the goldilocks period, there has been a notable positive contribution from carry in the energy sector.
BERY energy is an effective way to target inflation
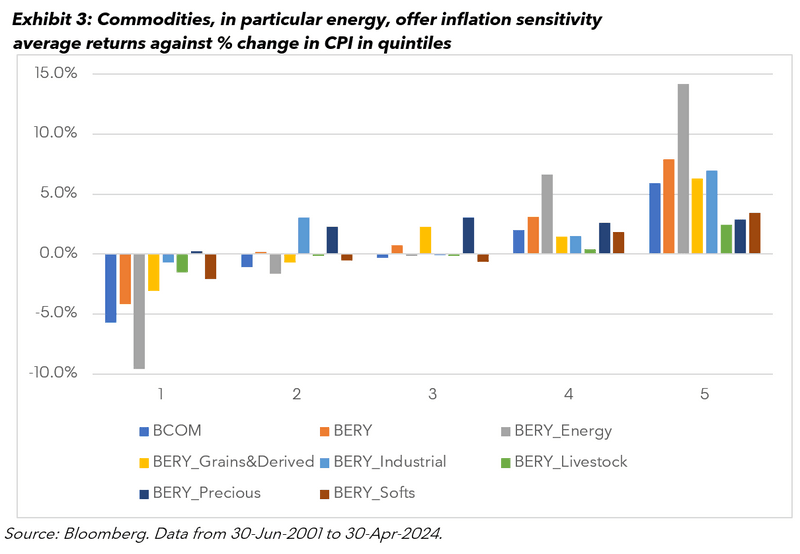
For Inflation, we study the hedging characteristics of commodities against US CPI by testing the quintile-based data. The bar charts in Exhibit 3 highlight the relationship and hedging characteristics of the BCOM, BERY and BERY sectors against inflation. BERY and BERY Energy offer greater inflation sensitivity compared to BCOM in the top quintiles. This can fundamentally be explained that in periods of elevated inflation, physical markets remain in tight supply for prolonged periods of time which is when the carry premia from BERY and the energy sector can contribute additional returns which also reiterates the results seen in the “Goldilocks” quadrant of Exhibit 2.

In the paper, “Hedging inflation risk in fixed income portfolio using commodities”, Ghia et al. measure the inflation beta sensitivity of any asset and then allocate the inverse proportion for an effective inflation hedging allocation. We conducted the same exercise of calculating the 3-year rolling beta of BERY and BERY Energy, against 10y US Breakevens since 2001 and found average betas of 15 and 27 respectively. An inflation beta of 1 implies that a 1% increase inflation is accompanied by 1% increase in asset return. The inflation beta sensitivity allocation to BERY comes to 6.7%, and the equivalent BERY Energy sector allocation is 3.65%. Therefore, even a small allocation to BERY Energy is an effective method to target upside Inflation, however, the chart highlights to avoid the energy sector when Inflation is decreasing.

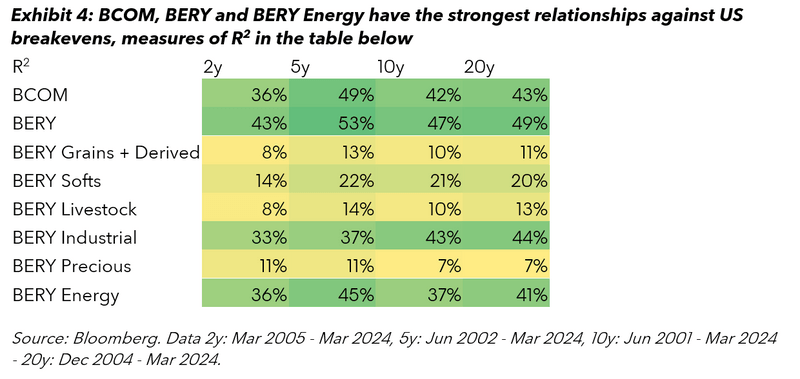
Finally, we run the regression-based relationship measured by R2 between BCOM, BERY and the BERY sectors against 2y, 5y, 10y and 20y US Breakevens using quarterly returns. The 2y tenor is reflective of the short-term expected central bank activity while the 10y tenor is a barometer of long-term inflation expectations. Overall, the broad BERY and BCOM indices, followed by BERY Energy offers the strongest connection with consistent significance against Inflation expectations represented by US Breakevens across the various tenors.
There is a commodities BERY sector for every season
A long-only commodities investment in BCOM and BERY is well positioned in the context of strategic asset allocation and in this article, we explore the use of the BERY Sectors for tactical asset allocation. Broadly, we find that from assessing the quarterly returns of the BERY sectors across different economic regimes there are different times when different BERY sectors have tended to shine. In goldilocks scenarios, BERY ex agriculture and livestock is the best performing sector. For deflationary growth episodes, the all-metals sub-index works effectively. Energy and precious metals sector is a solid candidate for investment during stagflation. Finally, over a recession, all commodities sectors are down except the grains. The rationale for this could be that despite the economic downturn we all need to eat some pasta and bread at the very least.
The data and other information included in this publication is for illustrative purposes only, available “as is”, non-binding and constitutes the provision of factual information, rather than financial product advice. BLOOMBERG and BLOOMBERG INDICES (the “Indices”) are trademarks or service marks of Bloomberg Finance L.P. (“BFLP”). BFLP and its affiliates, including BISL, the administrator of the Indices, or their licensors own all proprietary rights in the Indices. Bloomberg L.P. (“BLP”) or one of its subsidiaries provides BFLP, BISL and its subsidiaries with global marketing and operational support and service.