Bloomberg Market Specialists Loïc Frappier and Philipp Zacharias-Langhans contributed to this article. The original version appeared first on the Bloomberg Terminal.
Background
Technical indicators for buying growth or value stocks signal a comeback for companies pricing in faster long-term earnings expansion.
Anticipation of economic recovery from the pandemic drove a rotation into stocks with cheaper valuations and weaker growth prospects since August 2020. The brakes were slammed on that reflation trade after the Federal Reserve signaled it would dial back stimulus in June.
The issue
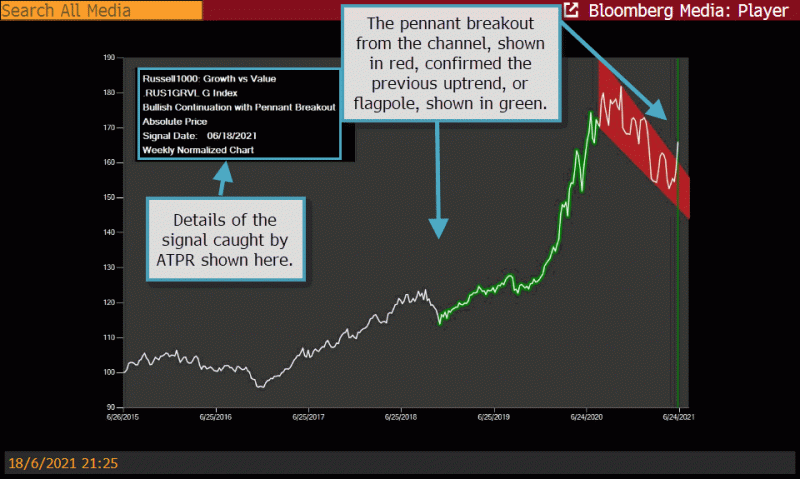
Many market participants have turned to technical indicators to determine how to allocate between growth and value stocks. Bloomberg’s Automated Technical Pattern (ATPR) function can identify major chart patterns between value and growth stocks. The ATPR library is updated once a day by 5:30 p.m. in New York. It includes technical patterns spotted in charts of single equities, exchange-traded funds, benchmark equity indexes, sovereign bonds, currencies, commodities and key ratios.
On June 18, a pennant breakout pattern was formed on the ratio between the Russell 1000 Growth Index and the Russell 1000 Value Index. Pennants are continuation patterns where a period of consolidation is followed by a breakout that confirms a bullish trend known as the flagpole. Most traders use pennants in conjunction with other forms of technical analysis that act as confirmation.

So what other technical indicators are worth looking at for this ratio?
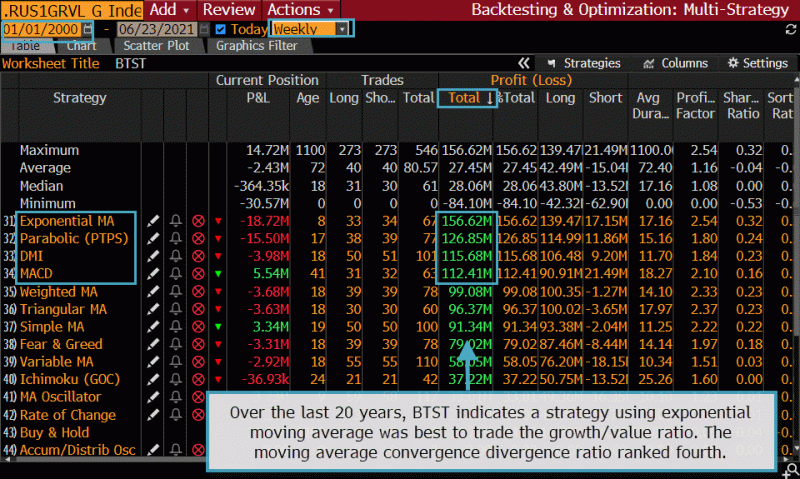
Over the last 20 years, the Basic Backtesting function indicates that a strategy using exponential moving average would have been the best way to identify reversals in the growth/value ratio, while moving average convergence divergence (MACD) ranked fourth.

In the eight weeks following a MACD buy signal, the ratio rose 23 times out of 31 historical occurrences. The mean return was 1.2%. The 32nd buy signal on June 18 has yet to have enough time to be counted as a gain or loss.
Bloomberg functionality can help you find the best performing technicals historically.
Tracking
Examine the impact of MACD buy signals using the Trading Signals tool.

For more information on this or other functionality on Bloomberg Professional Services, click here to request a demo with a Bloomberg sales representative. Existing clients can press <HELP HELP> on their Bloomberg keyboard.