Transaction cost analysis (TCA) has become a vital component of buy-side trading desk operations. Historically, TCA’s focus has firmly been on best execution, but there is another element that allows traders to understand the behavior of their portfolio managers (PMs) and adjust their trading accordingly.
This targeted analysis, called a momentum profile, utilizes benchmarks measuring prices both before and after the trading time. This profile looks at the instruments being traded and the PM’s investment approach. When used in conjunction within these categories, traders can gain insights into timing decisions and how aggressive they can afford to be to get the best result for a given order.
Below, we illustrate how to create and evaluate momentum profiles, while using them to better understand a PM’s behavior and approach.
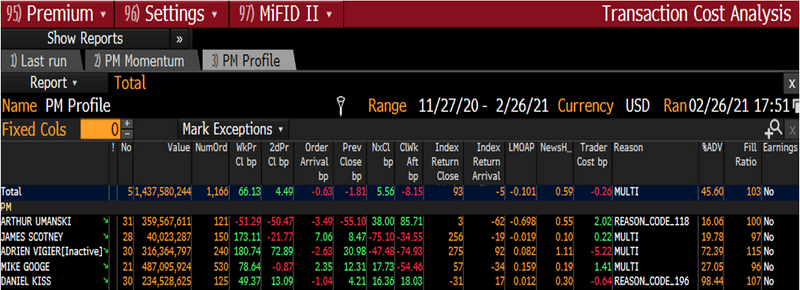
The sample report below allows for the comparison of portfolio managers’ performance over the last quarter, and uses data points that highlight the following:
- Activity levels (value and number of orders)
- Momentum bias (pre-post benchmarks)
- Market and order characteristics (index comparison, momentum, size adv, fill ratio, news heat)
- Execution benchmarks (order arrival and trader cost)
Consider the scenario below:
Good timing
PM DANIEL KISS is not the most active PM by total value traded and number of orders. However, his trades are the best performing in terms of timing. Daniel has outperformed all pre- and post- benchmarks: 49bp compared to 1 week before arrival and 18 bp compared to a week after. The week before index comparison implies a 31 bp slippage suggesting a relative 80bp improvement. Arrival performance is a small slippage of 1 bp which is neither best nor worst.
Context data tell you that orders generally arrived with little momentum from market open and tended to be in securities with minimal news activity. The former is illustrated as percentage change between the open price of the first day of the order and the arrival price of the order (LMOAP column). What makes the performance stand out is the average size of orders are very large, representing on average 98% of ADV. Also, the trader cost benchmark reveals that the trader timing element of this PM’s orders accounted for just over half of the overall slippage of the order.
One side of momentum bias
By comparison, look at PM Arthur Umanski. By trading when he did, this PM underperforms all pre-arrival benchmarks. On the flip side, Arthur outperformed against post-arrival measures. This shows that the orders are eventually vindicated after execution, but performance could have been improved by sending these orders earlier. This serves as an indication of a PM observing a market move and then joining the trend. The comparison of trader cost in context of arrival is also something to consider. Arrival slippage was 3.5bp, but trader cost outperformed, which indicates the traders did a good job of timing when to participate in the market.
And the opposite
Finally, compare this to PM Adrien Vigier. In almost the opposite of the previous example, he outperformed pre arrival benchmarks but underperformed post arrival benchmarks. This indicates that, when orders for this PM arrive on aggregate, the traders can afford to take more time to execute in order to improve performance.
Visualizing insights
Another approach is to visualize the momentum performance against the full array of pre- and post- arrival benchmarks. Using Momentum Charts makes performance comparison simpler and trends and outliers are much easier to detect. Here is how you can interpret timing of a PM based on the curve shapes.


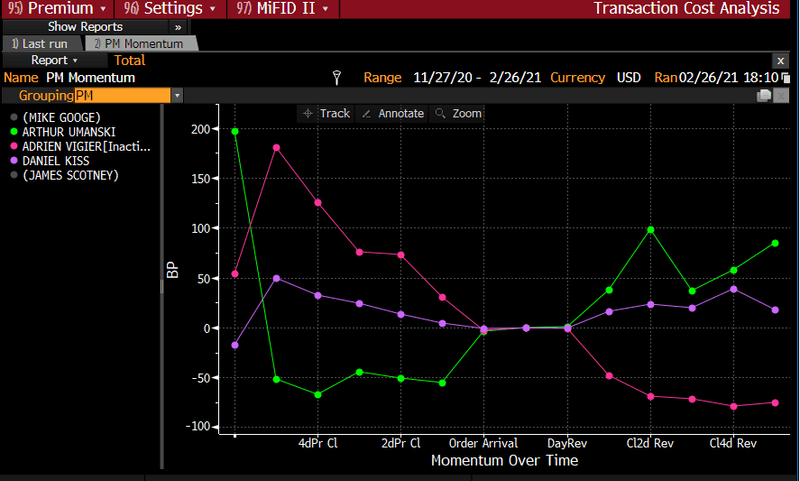
Above, we compare the same five PMs over a rolling quarter. Each PM is represented by a different coloured plot and shows performance against benchmarks ranging from 1 month before to 1 month after arrival. All benchmarks are side adjusted so provide a normalized view of performance. When comparing the PINK plot for ADRIEN VIGIER and the GREEN plot for ARTHUR UNANSKI we see the performance described above visualized. Note the general slope from high left to lower right showing outperformance moving to under performance as it passes the order arrival time for ARTHUR UMANSKI and the opposite slope for ADRIEN VIGIER. The more granular nature of the Momentum chart using a wider array of benchmarks allows for deeper insights to be gained. Note the slope for DANIEL KISS confirms the outperformance both before and after arrival. For simplicity, we are plotting only the three PMs in question to illustrate.
What we have seen is that by using benchmarks outside of best execution enhances TCA analysis with the PM-Trader paradigm. Using benchmarks, measuring prices before and after the trading allows to draw meaningful insights about PM profiles and to make practical decisions about future trading.
To access a sample interactive PM profile report on the Terminal go to BTCA <GO> -> Sample and highlight “PM Profile” report .
To visualize a sample “PM Momentum” report go to BTCA <GO> -> Sample and highlight “PM Momentum” report.